


Wall Street’s optimism narrative on the economy got a massive boost yesterday when the Bureau of Labor Statistics announced the US economy created 130,000 jobs in January.

Total nonfarm payroll employment rose by 130,000 in January, and the unemployment rate changed little at 4.3 percent, the U.S. Bureau of Labor Statistics reported today. Job gains occurred in health care, social assistance, and construction, while federal government and financial activities lost jobs
The BLS data dwarfed last week’s dismal ADP jobs print of only 22,000 jobs. Certainly those looking for an upbeat positive economic message need look no further, as a robust jobs report can only mean the jobs recession is at long last coming to an end. Right?
Only, Wall Street was not impressed. Equities sank on the opening bell, and finished the day with marginal declines in all three major indices.
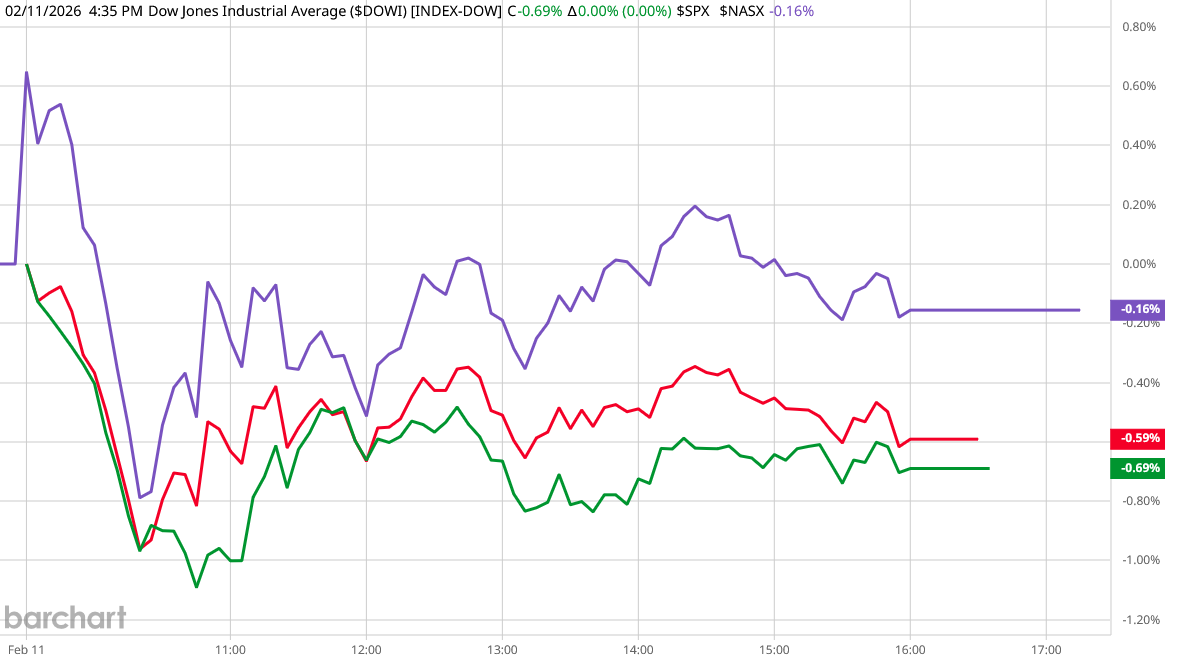
Treasury yields reacted the same way as equities, with the yields jumping 10 basis points when the Employment Situation Summary was released.

Wall Street saw something in the jobs report that gave it serious pause. Almost certainly, that something included the annual benchmarking revisions, which made one million jobs vanish from the data.
Not only was 2025 less than spectacular for jobs creation, 2024 was even worse than previously realized.
That is an optimism-killing sort of jobs report. That the 130,000 jobs figure is itself almost certainly the result of Lou Costello Labor Math merely emphasizes how little good news the January jobs report possesses.
Lou Costello Labor Math
It is trite and cliche to point out that when something sounds too good to be true, it probably is false. However, it is trite and cliche because it very often is reality, and the January Employment Situation Summary is no exception.
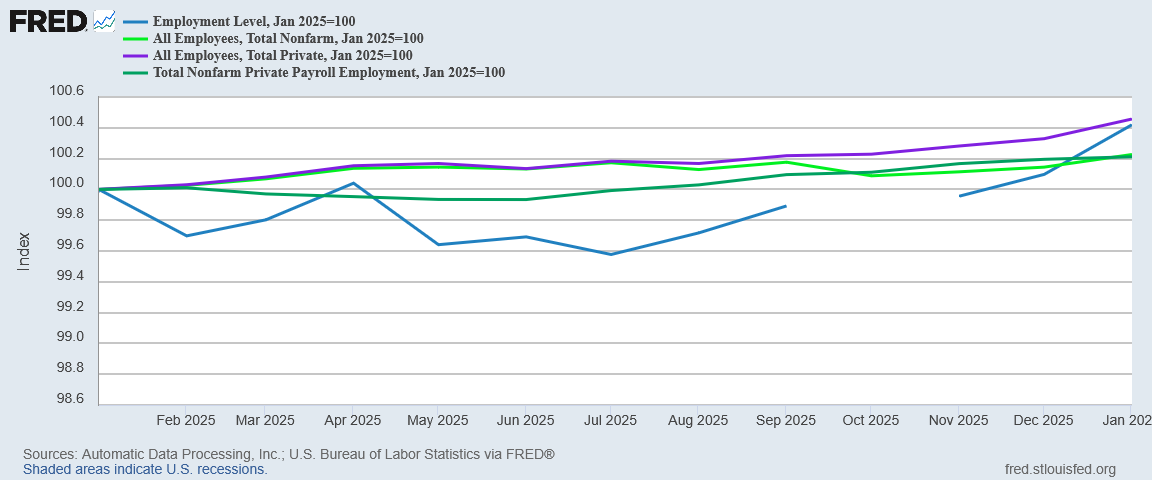
As long-time readers will perhaps recall, one quick thumbnail check on the reliability of the jobs data is to compare the ADP data, the Current Employment Statistics data, and the Current Population Survey data. As all three data sets are presumably measurements of the same underlying macro population, the data sets should converge.
When the data sets do not converge, that is a sign that bias is tainting one or more of the data sets, and that bias is what I have given the tongue-in-cheek description “Lou Costello Labor Math”, as that bias means the numbers are not going to add up.
While the data sets are closer to start 2026 than they were to start 2025, we do see an unusual set of divergences: private employment per the BLS Current Employment Statistics departs from the ADP data, and the Current Population Survey data departs from total nonfarm employment per the BLS Current Employment Statistics.
Another reason to be cautious about taking the numbers at face value is that the 130,000 jobs increase is entirely due to seasonal adjustment factors. In the raw unadjusted data, private sector jobs decreased by 2.2 million.
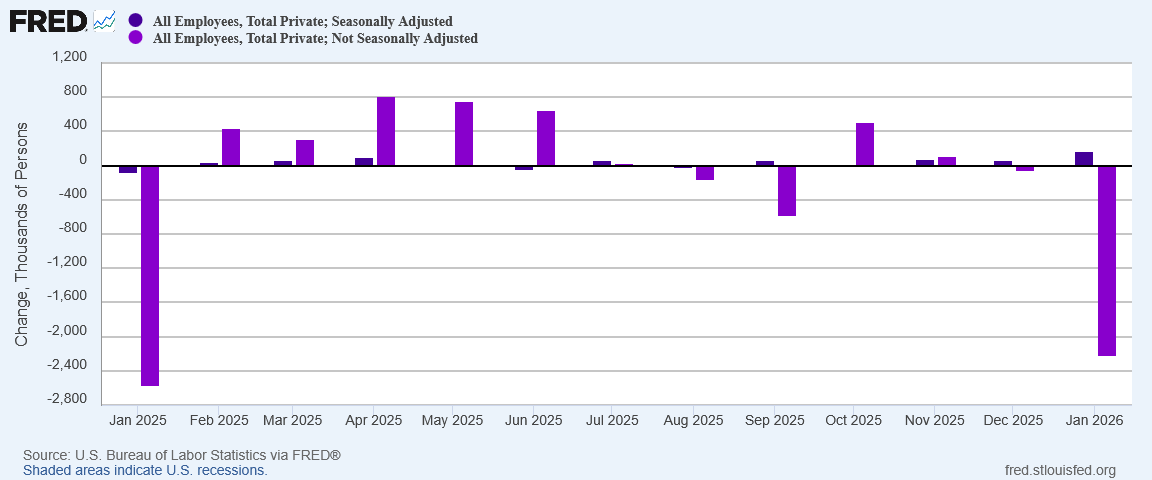
We should not be too shocked at the raw data, as large decreases have been the norm for the January jobs report for the past several years.
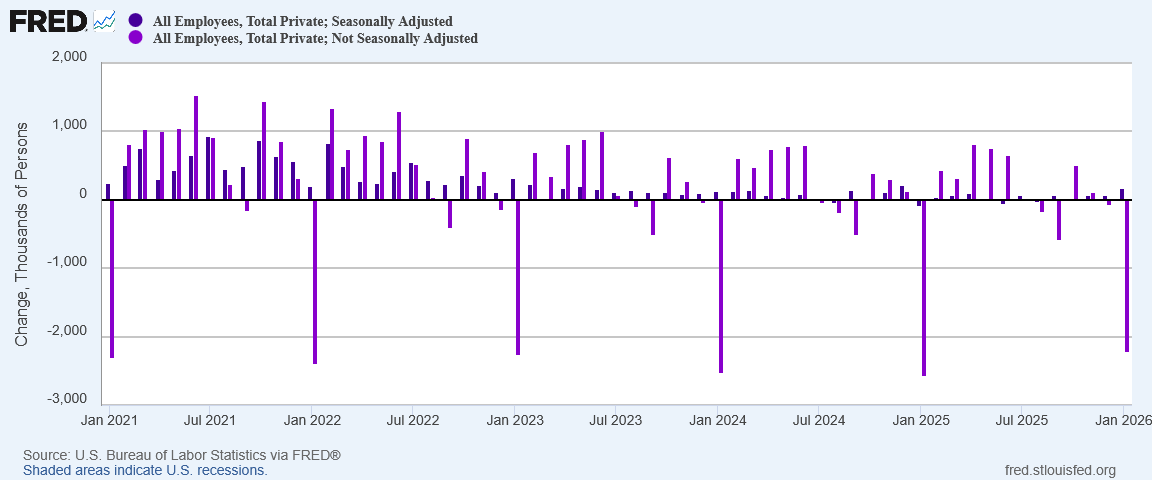
However, these large decreases are a reminder that January is inherently a problematic month for the jobs report, and a robust report that beats expectations is always to be taken with a large grain of salt.
One Million Jobs Gone
With the final revisions as part of the annual benchmarking process that occurs each January in the BLS data, one million of the jobs initially reported by the Bureau during the year were simply erased from the data set.
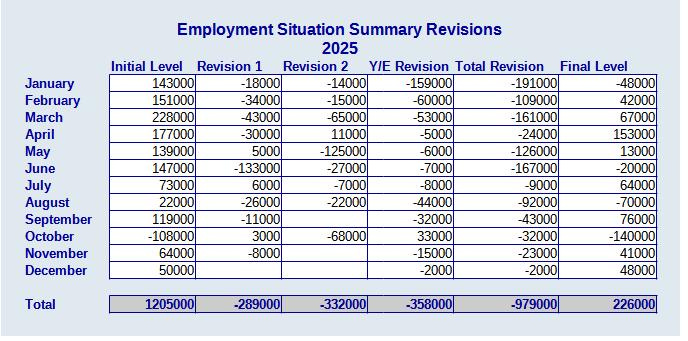
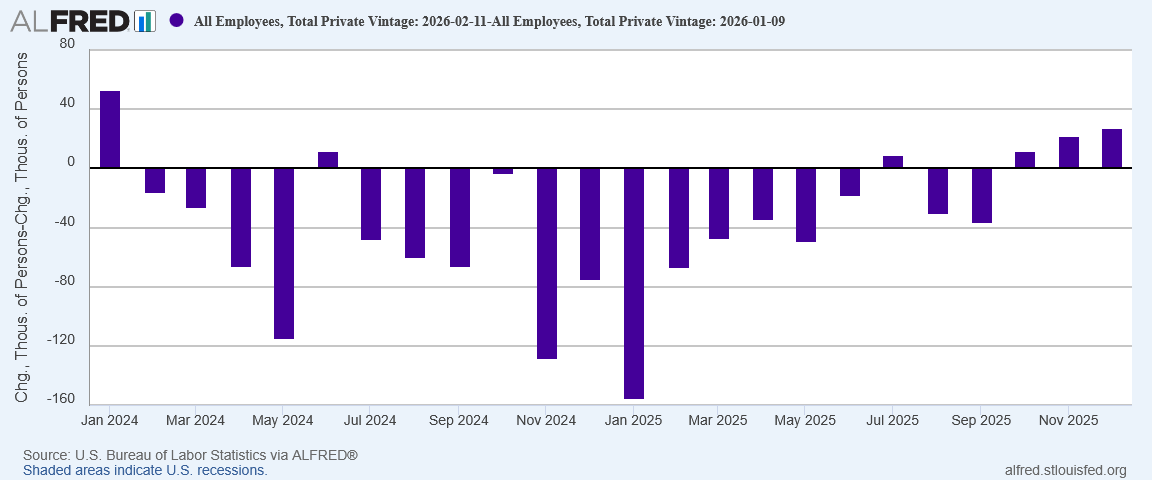
Even more disconcerting is that the revisions in each and every month for 2025 were negative. There was not one single month where the BLS underestimated job growth. In every month of 2025 the BLS overestimated job growth.
When the data consistently skews too high or too low, that is an unequivocal sign of bias, and that by itself is conclusive proof that the jobs data is tainted with bias. Once again, the very thing that President Trump was derided in the corporate media for asserting last summer—that the jobs numbers fudged and phony—stands conclusively proven.

My reaction to the annual benchmarking revisions is simply “I told you so.” Having analyzed all the ways the BLS jobs data frequently does not add up for going on four years, seeing the latest confirmation of bias and data taint is a victory lap I am just egotistical enough to take!

Yet the benchmarking revisions covered more than just 2025 data. Jobs numbers for 2024 were impacted as well.
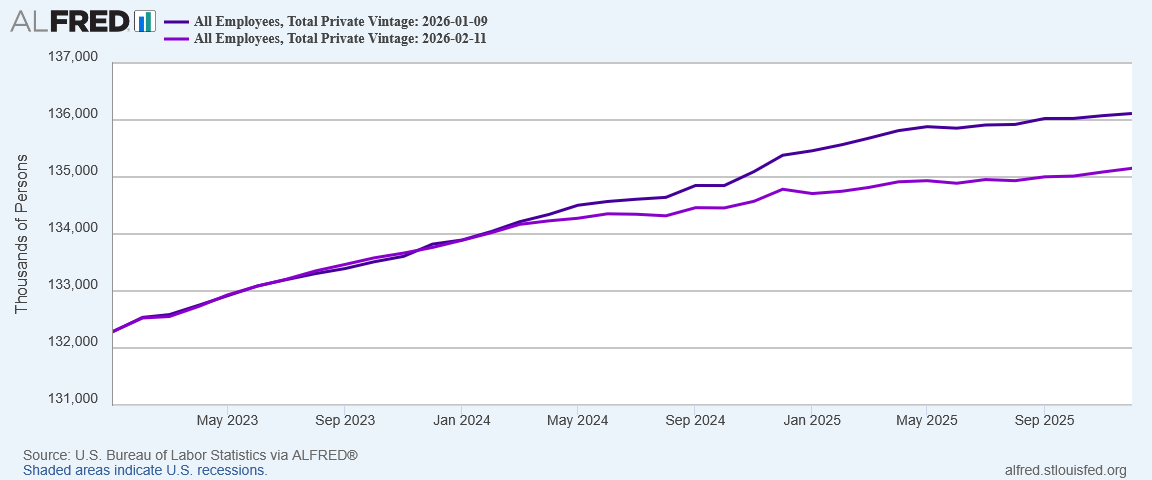
In accordance with annual practice, the establishment survey data released today have been benchmarked to reflect comprehensive counts of payroll jobs for March 2025. These counts are derived principally from the Quarterly Census of Employment and Wages (QCEW), which counts jobs covered by the Unemployment Insurance (UI) tax system. The benchmark process results in revisions to not seasonally adjusted data from April 2024 forward. Seasonally adjusted data from January 2021 forward are subject to revision. In addition, data for some series prior to 2021, both seasonally adjusted and unadjusted, incorporate other revisions.
The end result is a downward revision in nearly every month for the past two years:
Job growth in the United States has been even softer than has been previously reported.
Did Wall Street look at the revisions and have something of a WTF moment yesterday? Certainly that is an easy and obvious inference to draw from the data. Something demonstrably spooked equities yesterday, and the revisions demonstrably qualify as “spooky”.
Sector Data Still Weak
Within the seasonally adjusted data, 130,000 jobs is a robust number, but it is a skewed number. Most economic sectors did not show robust job growth.
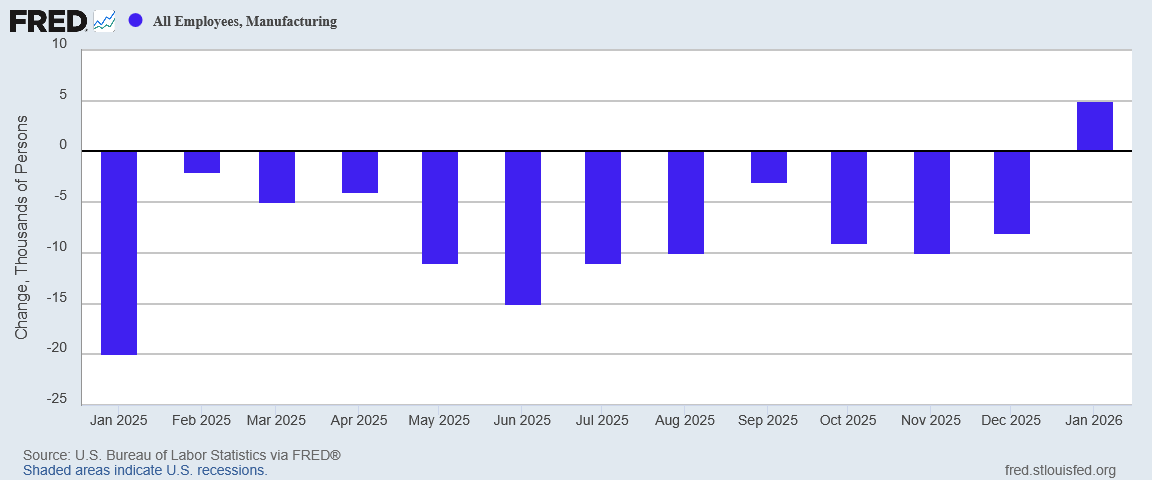
While manufacturing did finally achieve a positive jobs print, at 5,000 jobs the increase is almost nonexistent against 12 prior months of persistent job loss.
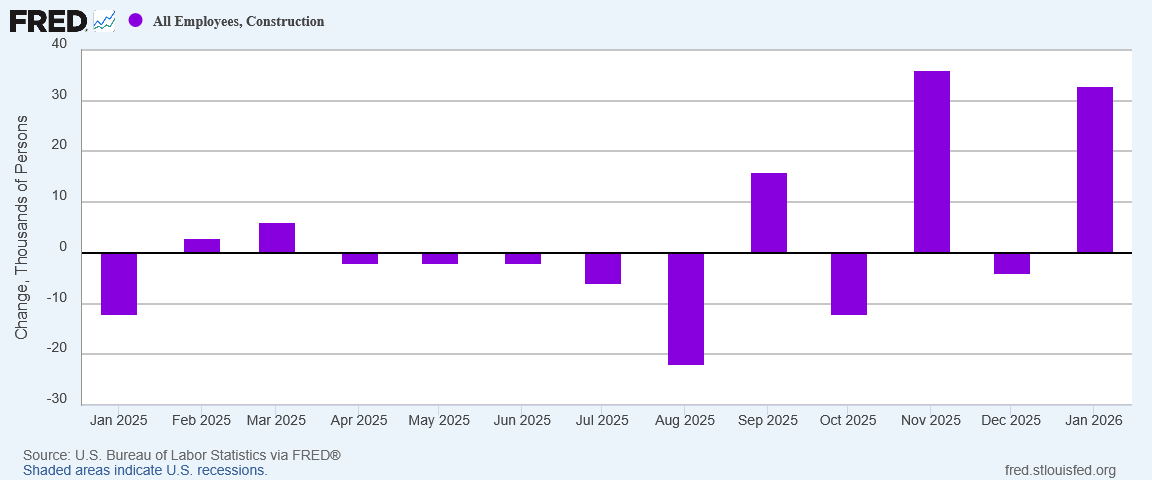
Construction did noticeably better at 33,000 jobs.
Finance and Information both continued to hemorrhage jobs.


Health and Education, Professional and Business Services, and Leisure all showed positive job growth.


Indeed, without Health and Education job growth, every Employment Situation Summary report over the past few months would have been negative.
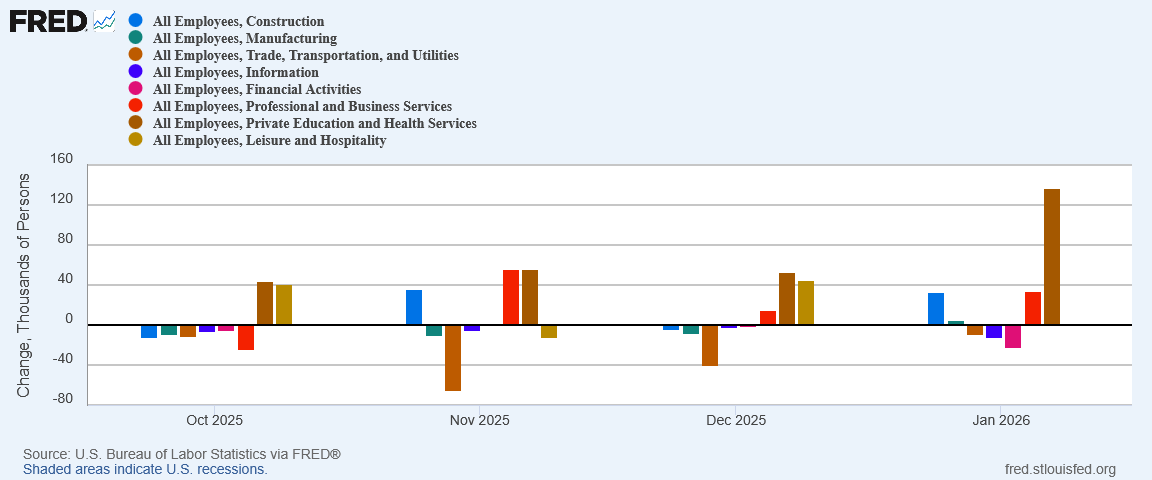
As good as the headline 130,000 jobs figure looks, the details behind that figure show it is concentrated entirely in the Health and Education sector.
Imbalanced job growth is not a positive economic signal.
Joblessness Improved, Earnings Did Not
Two numbers that did show a welcome improvement: the Unemployment Level and the number not in the labor force who want a job now.


The decline in both numbers produced noticeable improvement in both the official and the real unemployment rate (the “real” rate incorporates both the unemployment level and the number not in the labor force who want a job now).
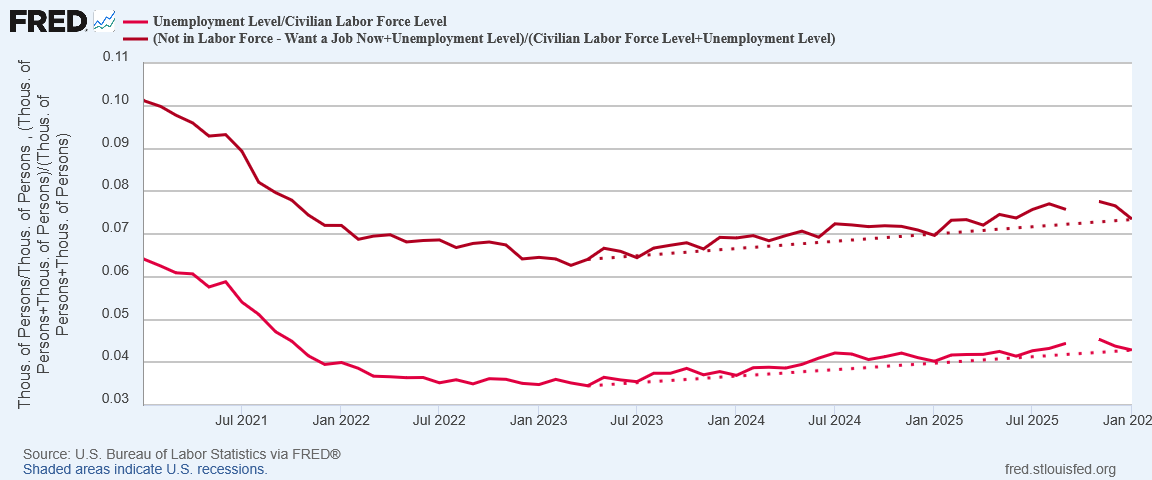
We are still seeing an increase in joblessness relative to April 2023, when joblessness began rising in the US, but the trend has flattened significantly.
That is a welcome movement in a good direction.
What is not welcome is that wages and earnings have still not caught up to inflation after the 2022 hyperinflation cycle.
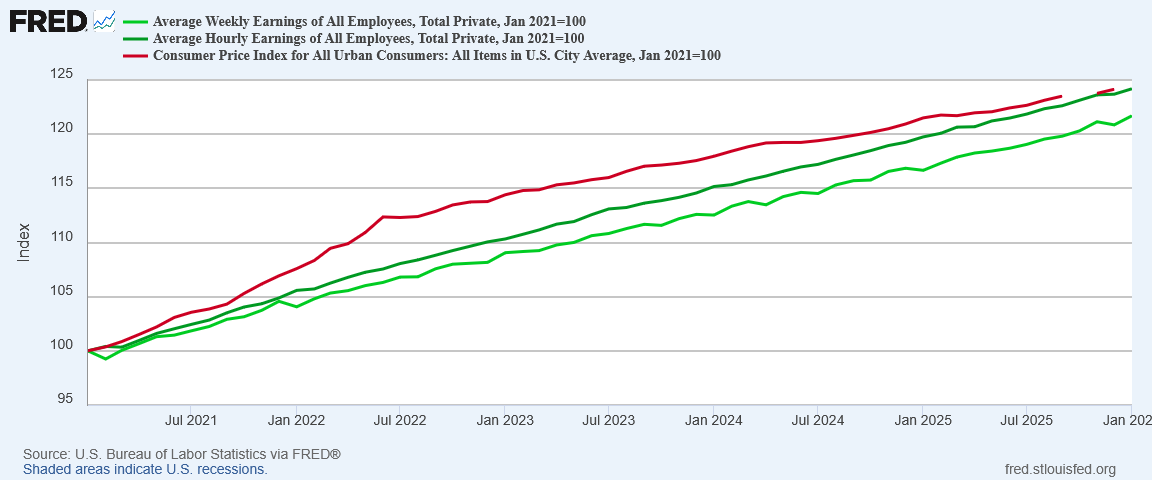
When we index hourly wages, weekly earnings, and the consumer price index to January of 2021, we see that, while wages are tantalizingly close to crossing over the inflation index, at which point wages will have matched price rises since 2021, weekly earnings still lags across all industries.
The differential is the decline in the average number of hours worked per week since 2021, a trend which has bottomed out but not yet reversed.
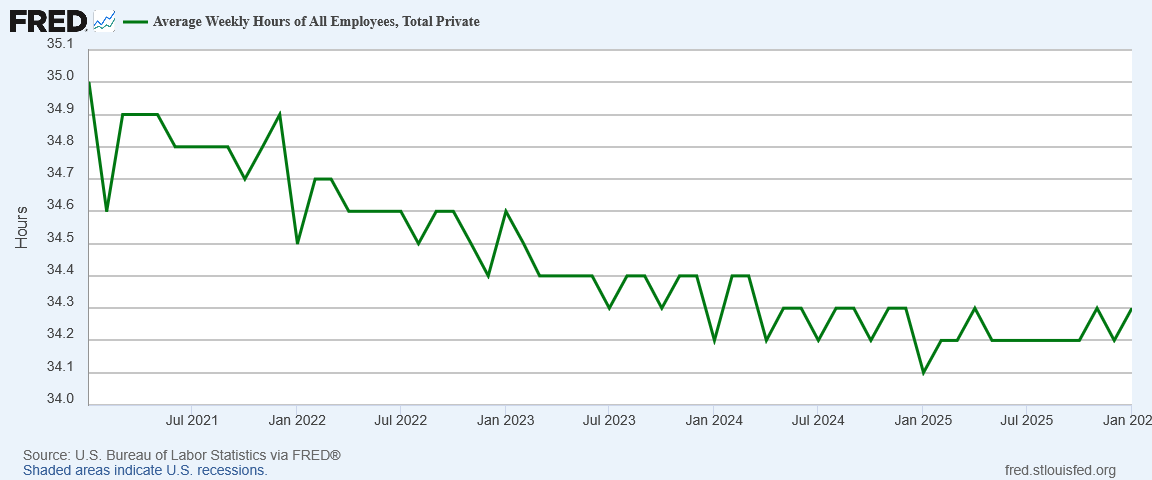
To engineer a true recovery from the ongoing jobs recession, one of the metrics that needs to move back up again is the average weekly hours. More hours worked mean larger paychecks across all wage rates.
Great Headline, Lousy Detail
It would be pure speculation to ascribe a specific factor to Wall Street’s blase reaction to the jobs report. However, once again the report presents a very attractive headline number with lousy details behind it. Which details caught Wall Street’s attention? Perhaps all of them did.
We don’t need to know which number took the wind out of Wall Street’s sails. We know that equities had a down day.
We know that Treasuries matched equities’ lack of enthusiasm.
There is no doubt Wall Street saw something in the jobs report it didn’t like. When we scrutinize the detail within the report, we see quite a bit not to like.
We know from that detail and from the annual benchmarking excercise that job growth in the United States has been considerably softer than most media outlets have reported, to the tune of roughly one million jobs that were reported but which never actually existed.
That is an important nuance to remember about the revisions. The reductions to payroll levels do not signify jobs that were lost. These reductions signify jobs that never existed. Economic narratives predicated on the jobs data showing positive growth at or above expectations are being proven false.
Coupled with jobs that never existed is the sobering reality that weekly earnings growth is proving to be slower than corporate media wants to acknowledge. Hourly wages are close to recapturing all economic ground lost during the 2022 hyperinflation cycle, but weekly earnings still have a significant gap to close.
As nice as the headline number looks, the January jobs report does nothing to alter the overall jobs outlook in the US. We are still in a jobs recession. Job growth has not been great over the past two years. Earnings growth continues to lag and is still well below where it needs to be to overcome the effects of the hyperinflation cycle.
Looking at the detail within the jobs report, the most remarkable aspect of Wall Street’s reaction was that it was not more negative than it was. There are enough warning signs in the report to overcome even the most optimistic and enthusiastic of the “animal spirits” long lionized in financial markets
The January Employment Situation Summary, despite the robust headline number, paints a jobs picture that is as gloomy as what ADP presented last week. The only reason we are not saying the Employment Situation Summary shows the jobs recession getting worse is because the report reminds us that we have already had the “worse”.
Last week we saw signs that Wall Street is clearly looking ahead with optimism that the economy is going to improve greatly in 2026.
Yesterday we saw reminders that optimism does not change data, but data can change optimism.
You are entitled to enjoy a victory lap, Peter. I haven’t read any other analysts or political pundits who have caught the data discrepancies as you have. Great job!
I still have many questions about the data that I hope will be answered in time. For example, construction jobs have increased, and that’s good news for construction workers. But construction of what, exactly? If it’s building new single-family homes, that’s a great sign that the economy overall is improving. If it’s construction of apartment buildings - meaning that people can’t afford to buy a house - then it’s not. If construction is all about building new data centers, then that’s an entirely different signal about the direction of the economy.
More jobs in health care is probably not good news, as it indicates that people are becoming sicker and more disabled. Is it just the Boomers aging, or are there figures that adjust for that? More jobs in social assistance can’t possibly be a good sign, but maybe those will decrease as the fentanyl crisis is lessened due to the border being closed?
I look forward to your future posts digging into the data, Peter. You are just the BEST at this!
Someone please explain to me, like I’m a 5 year old, how the f-ck you can overcount a million f-cking jobs?! BLS must employ to dumbest people on the planet. Meteorologists are more accurate!