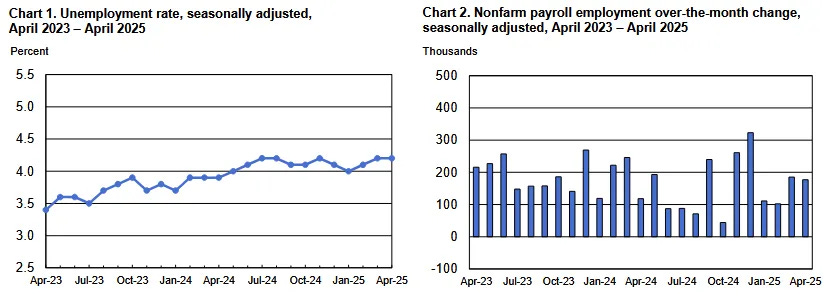
The April Employment Situation Summary marks the second month the Bureau of Labor Statistics put out a seemingly strong jobs report, showing 177,000 jobs were added over the month.
Total nonfarm payroll employment increased by 177,000 in April, and the unemployment rate was unchanged at 4.2 percent, the U.S. Bureau of Labor Statistics reported today. Employment continued to trend up in health care, transportation and warehousing, financial activities, and social assistance. Federal government employment declined.
Do we dare start taking the BLS jobs numbers at face value? Can the days of Lou Costello Labor Math truly be over now that Donald Trump is in the White House?
Or is that all just wishful thinking?
Let’s peel back the layers and see what the data has to say!
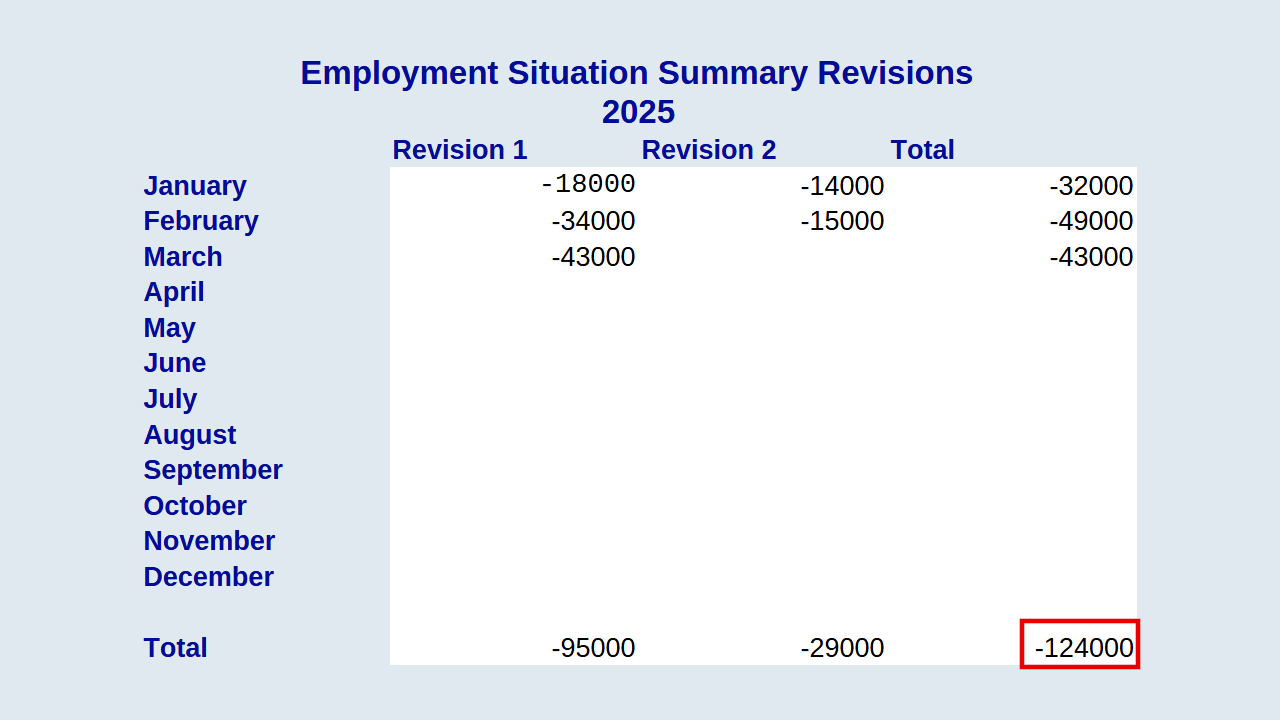
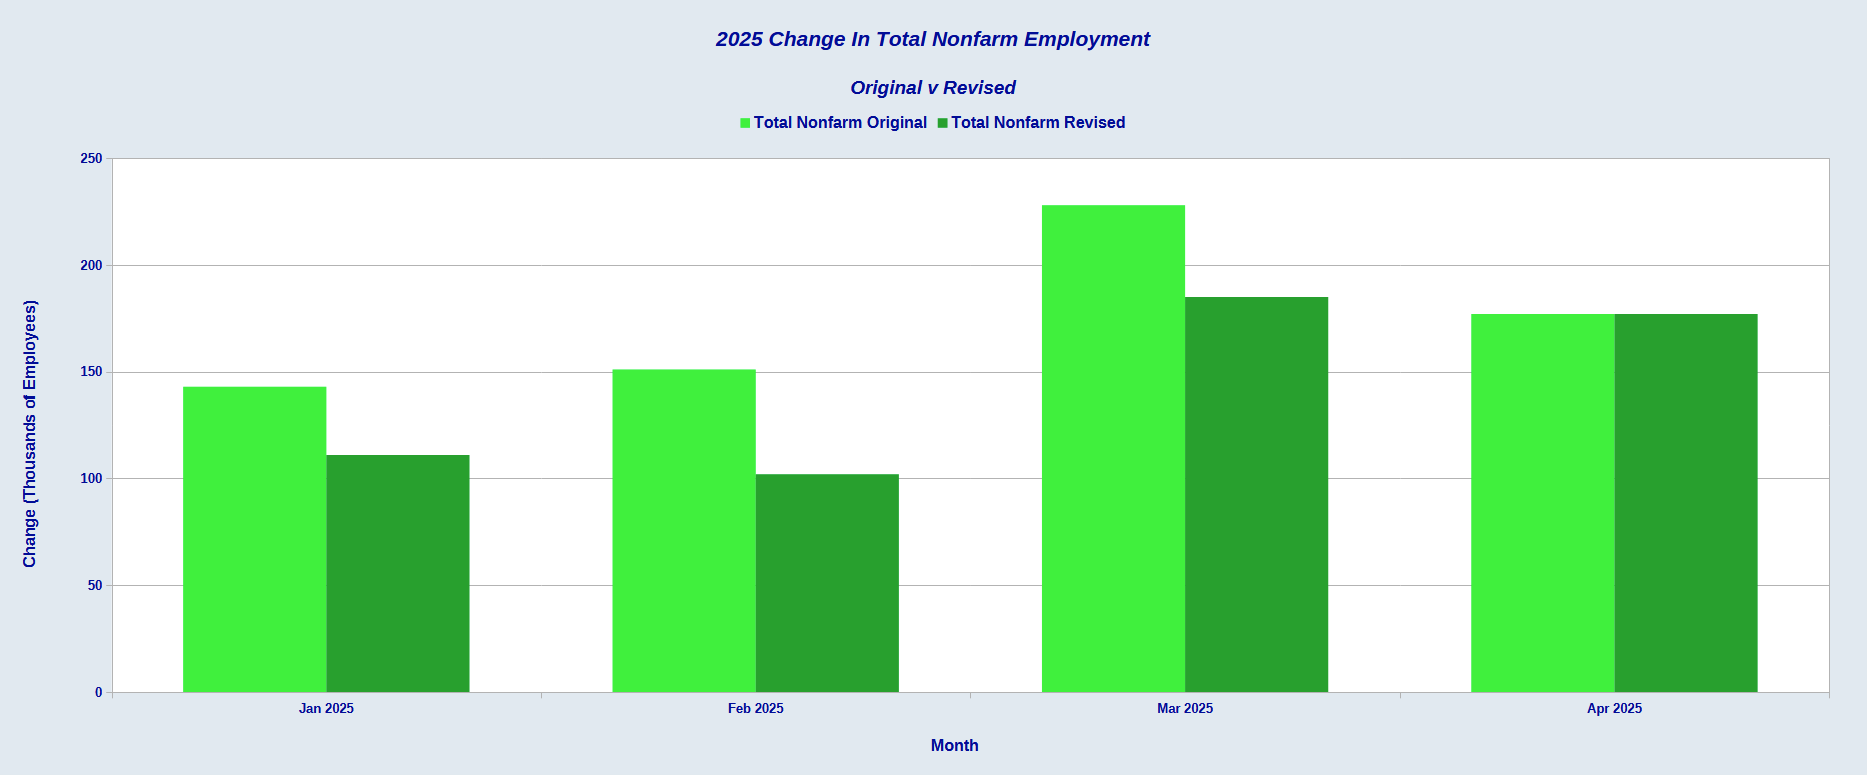
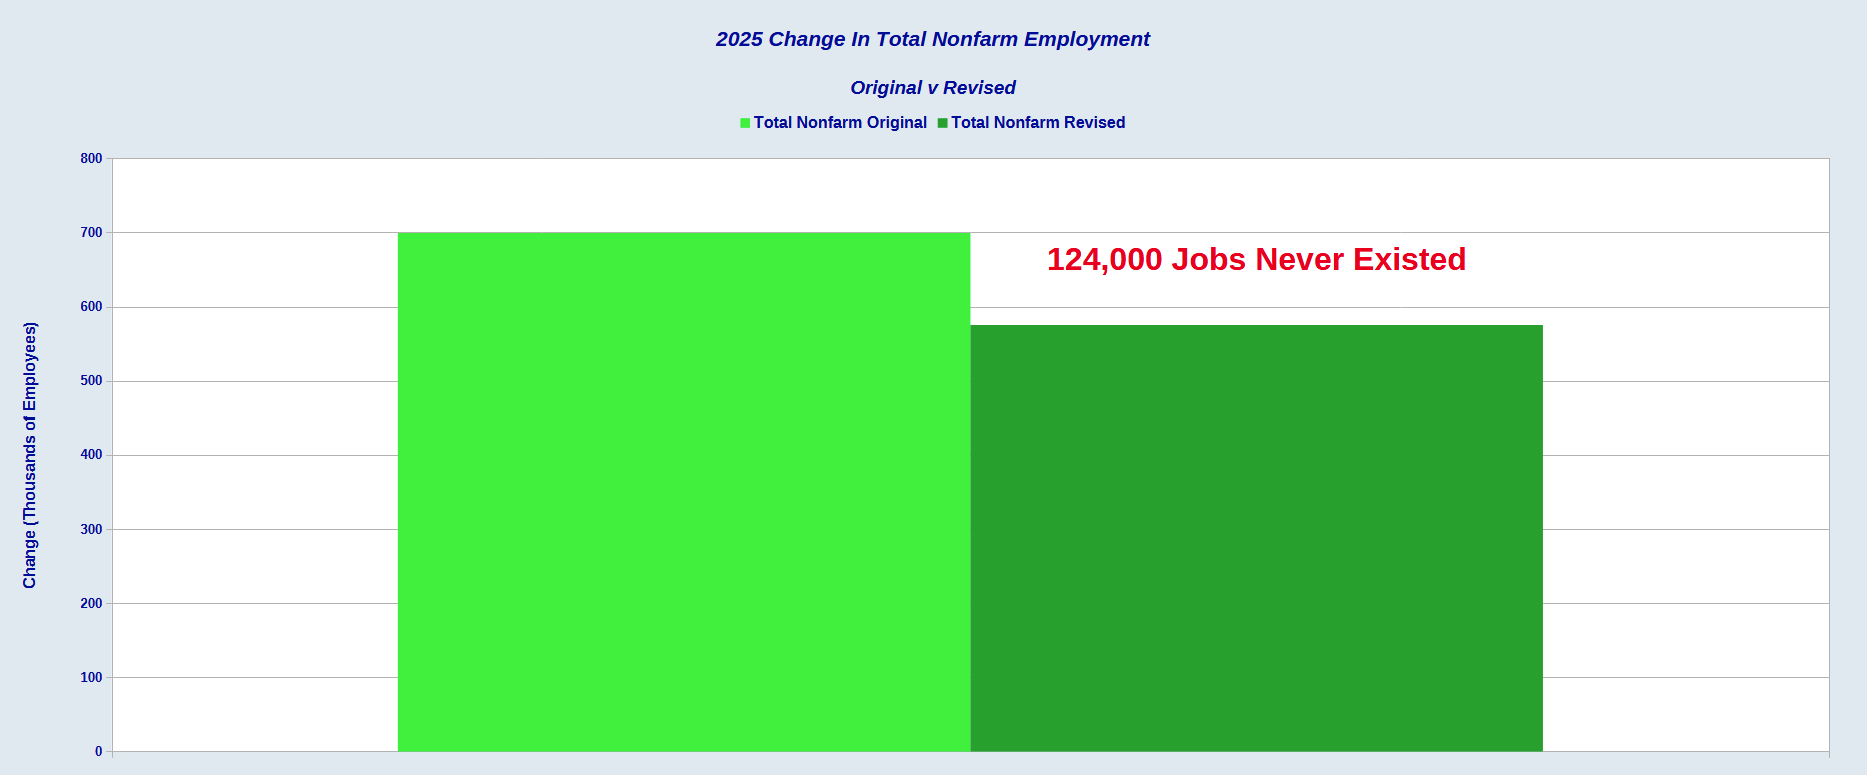
The change in total nonfarm payroll employment for February was revised down by 15,000, from +117,000 to +102,000, and the change for March was revised down by 43,000, from +228,000 to +185,000. With these revisions, employment in February and March combined is 58,000 lower than previously reported.
However, not only do these latest corrections lower prior employment figures by 58,000, but they mean the total correction for the year is 124,000.
That’s just for the first three months of the year.
Every month so far this year, the BLS has overstated job growth for the month.
Obviously, we do not yet have the corrections for April—that will come next month and the month after. Even so, we already have a substantial initial overstatement of employment growth for the year by the BLS.
We can safely assume this error is only going to grow throughout the year—and so will the grain of salt we should take with each month’s jobs report.
Not exactly. Even with the overstatement there is reason to be optimistic that these latest jobs reports are more grounded in reality than that.
When we look at the indexed jobs levels reported by the two independent surveys in the BLS jobs report (the Establishment Survey and the Household Survey), as well as the ADP National Employment Report, we see that, through much of 2024, the Household Survey data did not chart anything at all like the growth charted by the other two surveys.
The Establishment Survey and the ADP National Employment Report missed signals picked up by the Household Survey showing an extended pause in job growth. In the summer of 2022 and throughout 2023 and 2024, the Household Survey quite literally charted zero job growth.
Bear in mind that these independent surveys are still sampling what should broadly be the same data set—employed individuals in the United States. Even if their counting and statistical methodologies produce different totals each month, if the methodologies are being consistently applied we should expect to see broadly similar trends across all three surveys. From 2022 through the end of 2024, we did not see that at all.
That means for most of that time we were looking at Lou Costello Labor Math in the jobs report. The data was not merely inaccurate. The data did not add up. The trend deviation is an incoherence that calls into question the entirety of the BLS jobs data set for 2023 and 2024 at least.
However, this deviation is also why we can be guardedly optimistic about the current BLS data. After the January report, the Household Survey and the Establishment Survey have so far largely returned to showing the same broad growth trends.
We must always question the BLS data. However, at present the three independent surveys are reaching broadly similar conclusions on job growth. For now, that means we are not looking at Lou Costello Labor Math.
There Was Job Growth
If we are not looking at Lou Costello Labor Math then we have demonstrable job growth in the United States. While the number is sure to be “corrected” next month, at present we have a coherent report showing 177,000 jobs created in April.
The ADP National Employment Report was not nearly as optimistic, showing only a third of the job growth reported by the Employment Situation Summary, but it also showed employment growth.
Across the board, the top level numbers are positive. That is a good sign for the jobs market overall.
At 4,000 jobs gained, the ADP report looked better for manufacturing, but not by much.
Even Trade, Transportation, and Utilities—a mainstay of the service sector in the United States—has been charting weaker growth in recent months, although it did rise to 32,000 jobs for April.
While the ADP report showed a marked improvement in the sector over March at 20,000 jobs created, it still printed lower than the BLS report.
However, even that sector comes with a caveat that the job growth month on month has been trending down throughout 2024 and into 2025. They were the strongest sector in the April jobs report, but the sector’s trend shows weakening job growth over time. That is a cautionary signal and we should not ignore it.
Paychecks Disappoint
One area where the Employment Situation Summary was a clear disappointment was earnings.
Good-producing jobs are close to having recovered in real terms, thanks in large measure to last month’s deflation, but service wages are still not quite there.
On average, the workweek for all workers across all industries is down from January 2021 by more than 0.5 hours.
Not only are the hourly earnings not yet caught up with inflation, the lack of hours means the weekly paycheck is even further behind the inflation curve.
Still A Jobs Recession
Despite the positive top-level numbers, the data also shows the jobs recession has still not ended in this country.
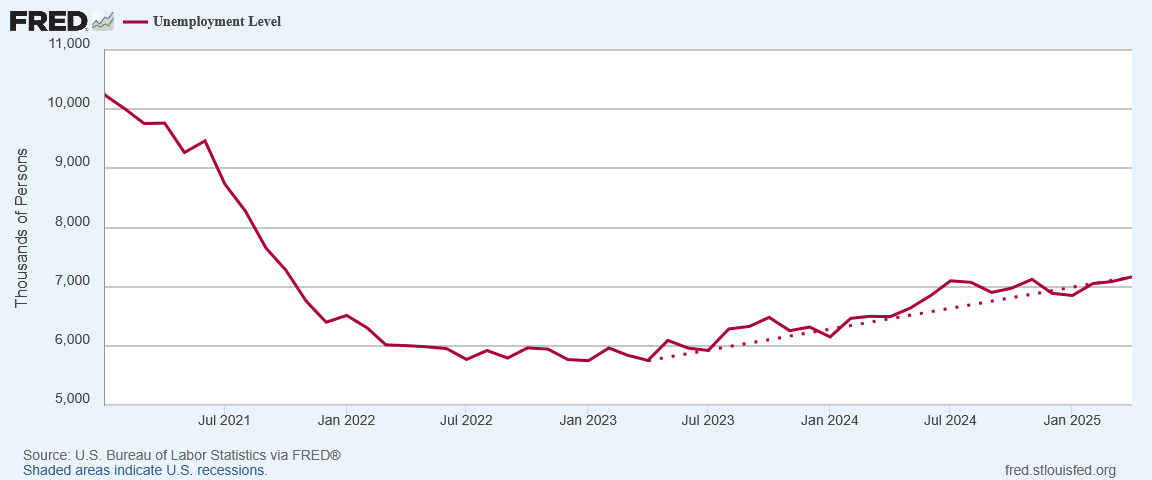
The upward trend in unemployment which began in April of 2023 is still ongoing. That is not a trend we want to see continued. In a healthy economy unemployment levels should be moving down.
While both the unemployment rate as well as the “real” unemployment rate showed a decline for the second month in a row, that still represents only a marginal shift downward in the long-term trend. Remember, the “real” unemployment rate is unemployment with the cohort “Not in the Labor force—want a job now” included.
Additionally, underemployment is a continuing challenge. While the number of people working part-time for economic reasons declined in April, the long-term trend going back to the end of 2022 is still increasing. That means more people are being underemployed—they want a full time job but are unable to find one.
Jobless is rising. Underemployment is rising. These are red flags for any economy.
Good, Just Not Good Enough
The April Employment Situation Summary is a good jobs report. It shows there was real job growth in April, and even with corrections we have reason to have confidence that the overall trend of job growth is continuing.
However, the report is not good enough.
We are seeing job growth, but we are not seeing enough job growth to stave off rising unemployment, and rising underemployment. Joblessness and underemployment are signs of economic weakness, and we have more of both in the US economy than we had, and that is not a good thing.
We also do not have growing paychecks, and that is another sign of economic weakness.
We do not need fancy charts and graphs to understand that the hyperinflation of 2022 meant that prices rose much faster than wages, and that paychecks covered far fewer living expenses at the end of 2022 than at the beginning of 2021.
While 2023 and 2024 saw the situation getting a little better, as of last month the gap between wage growth and price growth had only just been closed, and only for goods-producing wages. With far more people occupying service sector jobs, most paychecks are still behind the inflation curve.
This is lingering jobs weakness. This is the nature of a jobs recession.
We have job growth. We do not have enough job growth.
We have earnings growth for service jobs. We do not have enough earnings growth for service jobs. We have negative growth for goods-producing jobs.
We do not have any growth in weekly hours worked.
We need more growth in each of these areas if we are to finally climb out of the jobs recession we have endured since at least November of 2023.
The April Employment Situation Summary is a good report. It is the second such report in a row and that is encouraging.
It is not a good enough report. The economy needs more jobs, more hours worked, and more earnings per hour. Workers need more jobs, more hours worked, and more earnings per hour.
The trends are encouraging overall, but the labor markets are not yet where we need them to be.
Is your work situation improving, staying the same, or getting worse? Leave a comment and let me know if the BLS jobs report reflects your situation, or if your mileage varies (and in what direction).
Join a growing community that values truth over noise. Become a paid subscriber today!
The Sage of San Antonio has the level-headed figures and analysis. We can count on Peter!
And what fun it will be to see the figures for manufacturing and wage growth as Trump’s policies take effect. I hope we can count on the Trump administration the way we can count on you, Magnificent Man!


The Sage of San Antonio has the level-headed figures and analysis. We can count on Peter!
And what fun it will be to see the figures for manufacturing and wage growth as Trump’s policies take effect. I hope we can count on the Trump administration the way we can count on you, Magnificent Man!