


April’s Producer Price Index exceeded all expectations and not in a good way. It blew past all estimates to print the hottest factory gate inflation numbers in over three years.
The Producer Price Index for final demand increased 1.4 percent in April, seasonally adjusted, the U.S. Bureau of Labor Statistics reported today. Final demand prices advanced 0.7 percent in March and 0.6 percent in February. (See table A.) The April increase is the largest advance since rising 1.7 percent in March 2022. On an unadjusted basis, the index for final demand rose 6.0 percent for the 12 months ended in April, the largest 12-month increase since moving up 6.4 percent in December 2022.
The 6 percent year on year rise was more than a percentage point above what Wall Street projected.
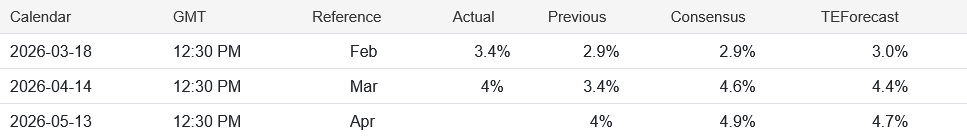
At 5.2% year on year, core producer price inflation was also well above Wall Street estimates.
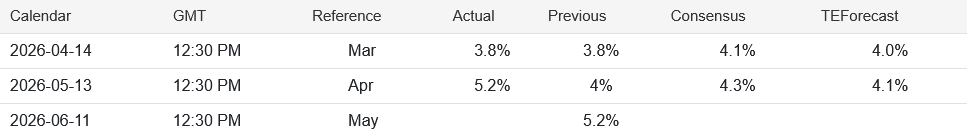
In the space of just two months, headline producer price inflation nearly doubled, and core producer price inflation was not far behind.
The CPI print established that we are seeing the beginnings of stagflation seeping into the US economy. The PPI print is telling us that we are going to see more stagflation over the next month or so…but we may not see much beyond that.
The PPI print is bad. The PPI print may also be telling us the worst is either behind us or very nearly so.
This Time, More Than Just Energy
A 6% headline PPI print year on year is never good news, but when it comes with a 5.2% core PPI print year on year, that is even worse. That is the PPI print we got for April.
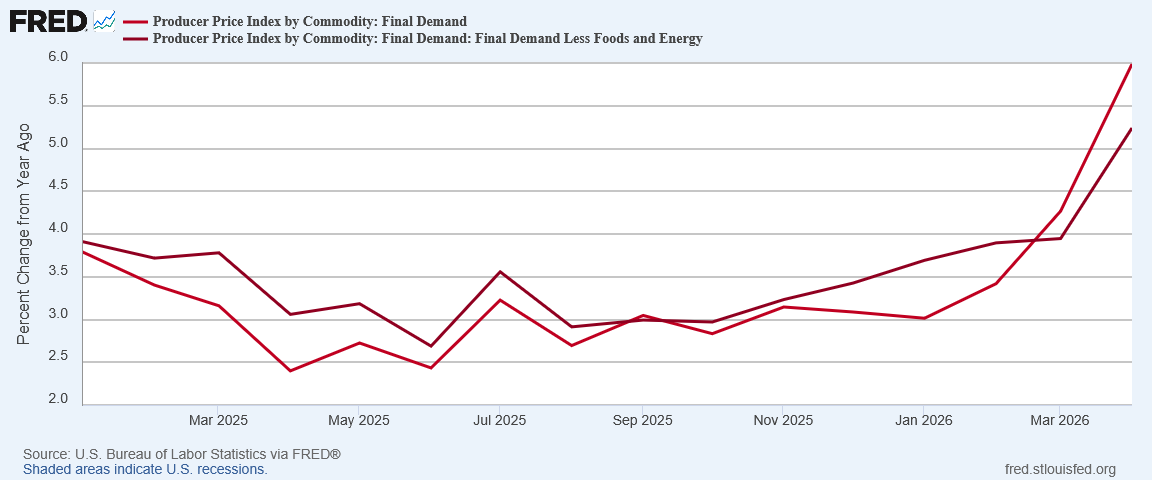
Energy has been pushing the headline PPI data up since the beginning of the year, but in April the price surges extended beyond just energy.
Even month on month, core PPI was hotter than it has been at any time previously during the second Trump Administration to date.
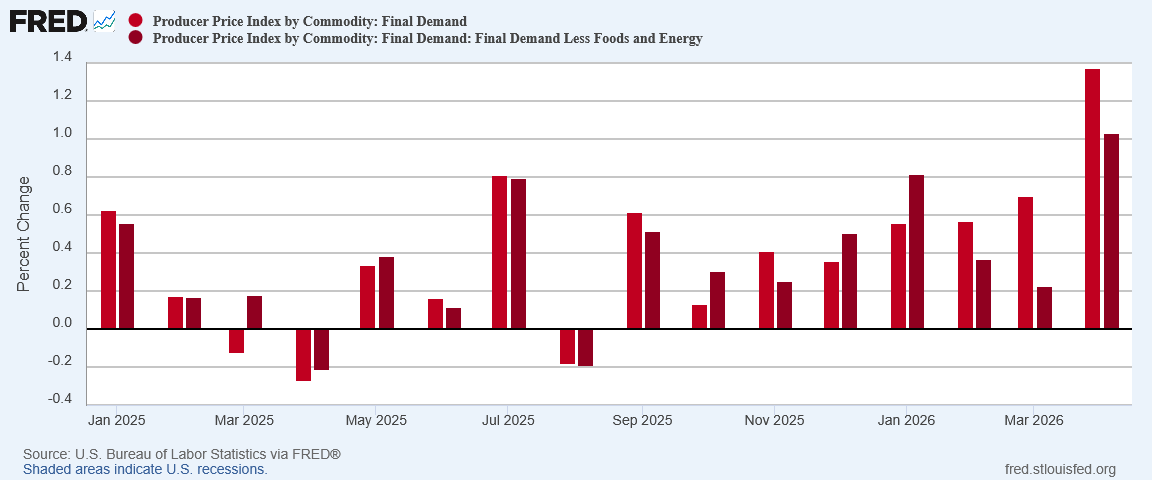
Core producer price inflation had been cooling off since January. April ended that trend decisively. The sliver of good news from the March data evaporated completely in April.
We can’t point to energy prices as the culprit for core inflation—by definition the PPI data set segregates energy prices along with food prices to arrive at the core data set. This surge in core producer prices means there are price shocks and even supply shocks emerging besides energy prices.
In other words, stagflation is spreading.
Energy Prices Hot, But Maybe Cooling?
While energy prices remained elevated in April, within the PPI data energy prices showed some disinflation after the March surge.
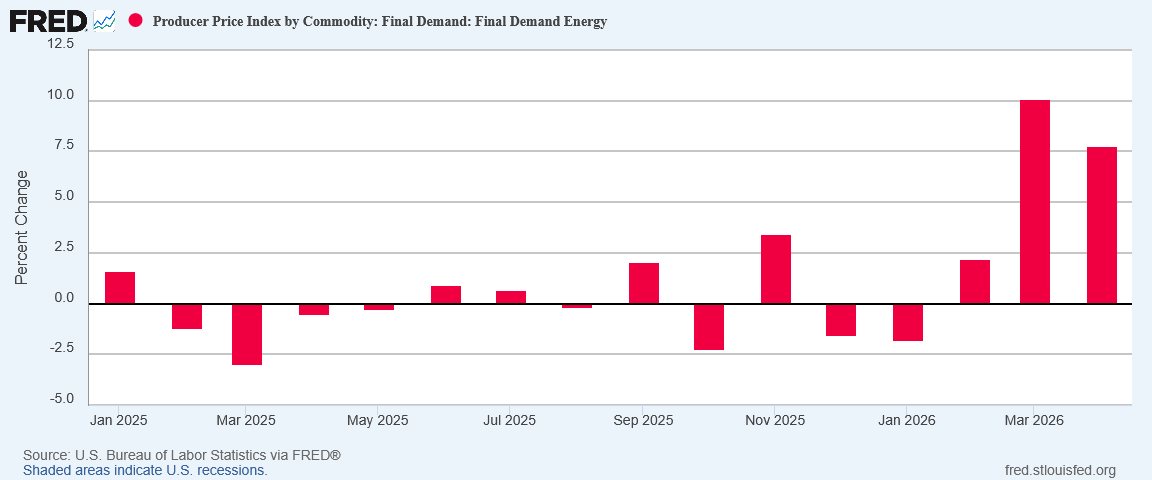
At 7.5% month on month, energy prices still showed the second hottest factory gate inflation print since the start of Donald Trump’s second term of office, but that it came in below the ultra-hot March print of 10% leaves at least a slender hope that there might be future cooling of inflation.
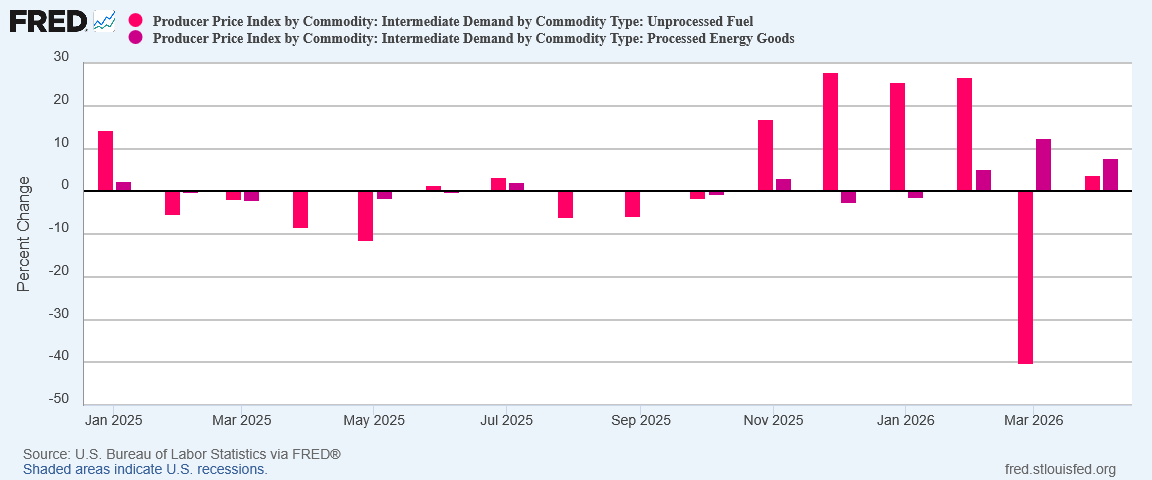
The April data also saw both unprocessed fuel prices rise marginally and processed energy goods prices ease slightly.
The market data shows a similar level of easing. Global diesel prices rose approximately 40% in March, while the Singapore Gasoil Futures contract rose “only” 17.6% in April, while the NY Harbor futures contract for diesel rose 9.8% and Europe’s Gasoil Low Sulphur contract rose 15%
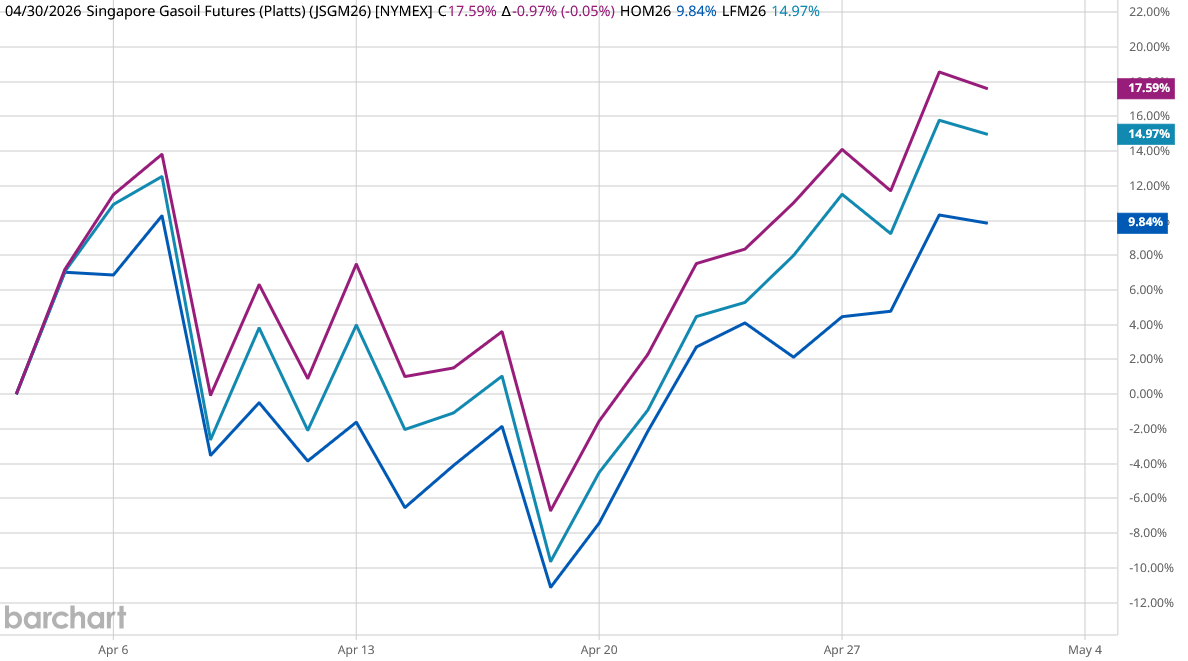
Double digit percentage price growth in a single month is a large price increase. There is no avoiding that reality. There is also no avoiding the mathematical reality that 17% is less than half of 40%. Price inflation for diesel around the world was significant in April and considerably less than March. By definition we are seeing a decrease in inflationary pressures just within diesel fuel.
Maritime bunker fuel rates actually showed some decline in April.
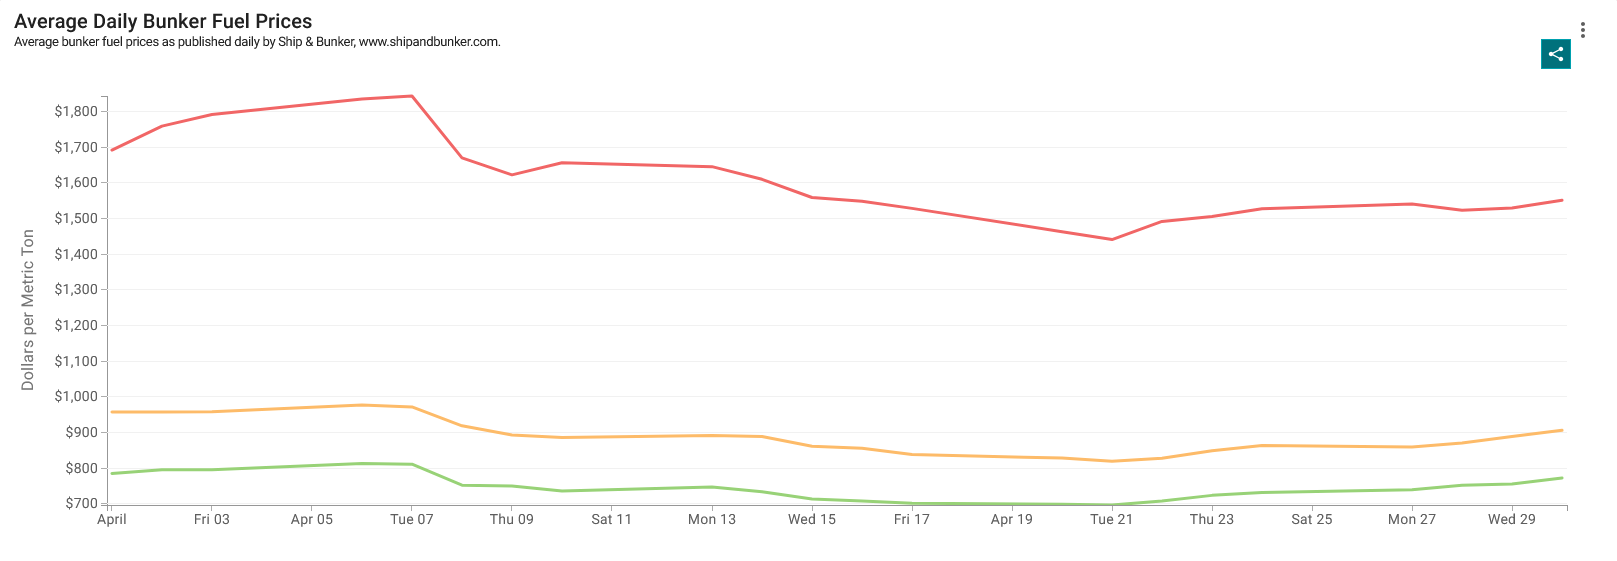
After peaking in early April, fuel rates began to drop again, until April 21 (one week after the US Navy blockade took effect). Even with the rise at the end of April, bunker fuel prices were still below where they peaked earlier in the month. Despite the war with Iran, despite the closure of the Strait of Hormuz, in April we had outright deflation in maritime bunker fuel prices.
That the energy price surges are being driven by the oil dislocations in the Persian Gulf is self-evident. With roughly 20% of global oil supply either offline or in jeopardy, extreme price shocks are exactly what we would expect as a market response.
Even so, we can take some small comfort from the fact that the April surge was less than the March surge, and that the April surge was not across the board in all energy-related products. While we should take care not to extrapolate too much from just two months’ worth of price shifts, if March should prove to be when the inflation data peaked, the overall magnitude of the stagflation crisis we see unfolding in the US economy will be less than it could be otherwise.
That is, of course, me being hopeful. The data itself offers no assurance that we will not see future oil price surges dwarfing what we saw in March and April. April saw less inflation than March, but that is no guarantee that May will not see more inflation than April. With prices being driven primarily by the ebb and flow of war in the Persian Gulf, any change in the geopolitical status quo could either ease the stagflation crisis globally or exacerbate it globally. Neither outcome is improbable at the present time.
Food Prices Crept Up, Along With Goods
In a sign that the inflationary pressures on energy are spreading into other items on the Producer Price Index, food price inflation flipped from deflation in March to rise 0.22% in April.
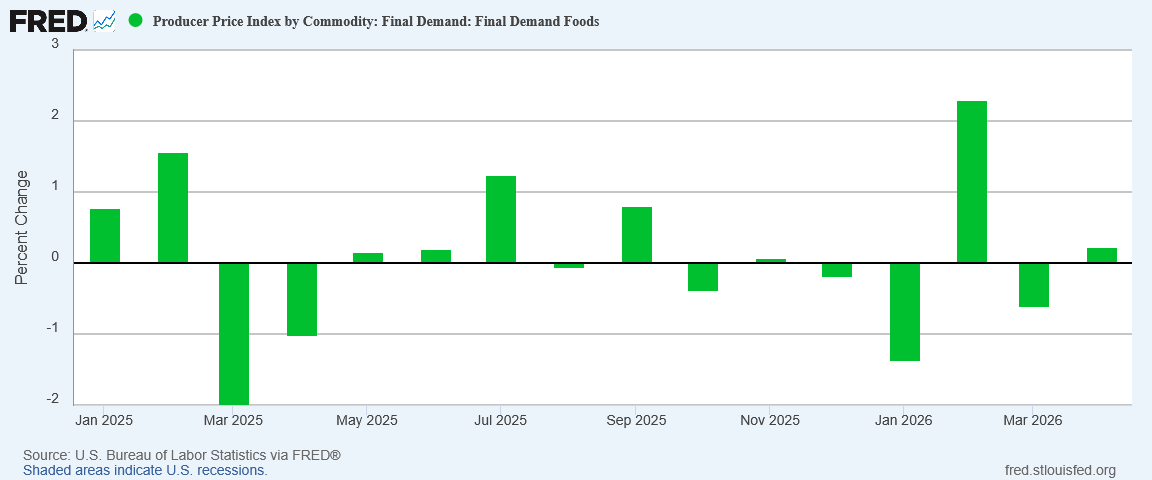
While the return of food price inflation is a signal that the inflationary pressures on energy prices are spreading beyond just energy, we should note that, a less than a quarter of a percentage point, the increase itself is incremental.
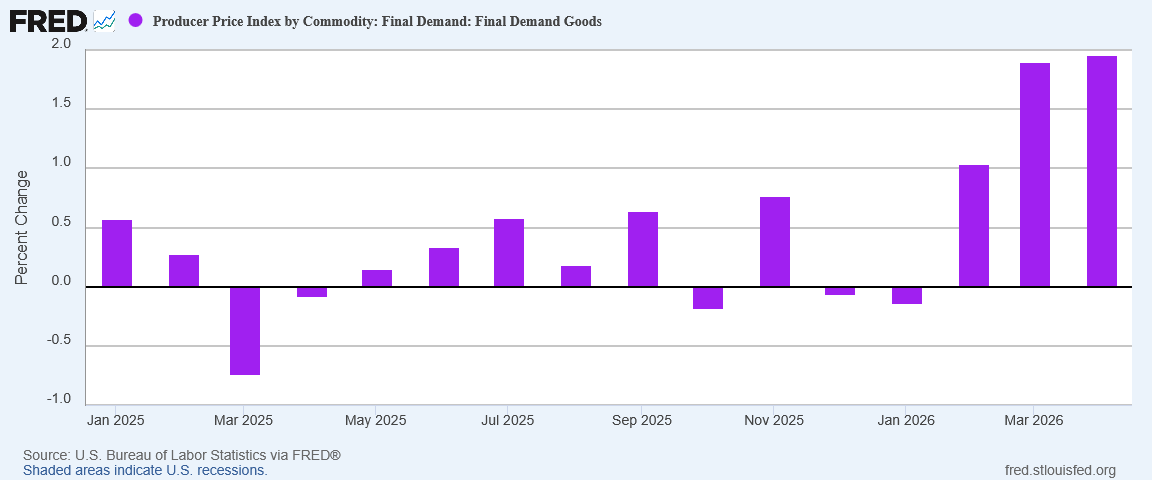
Goods prices showed a similar incremental increase from March, with inflation rising from 1.9% to 1.96% month on month.
Service prices, however surged by very nearly a full percentage point in April.
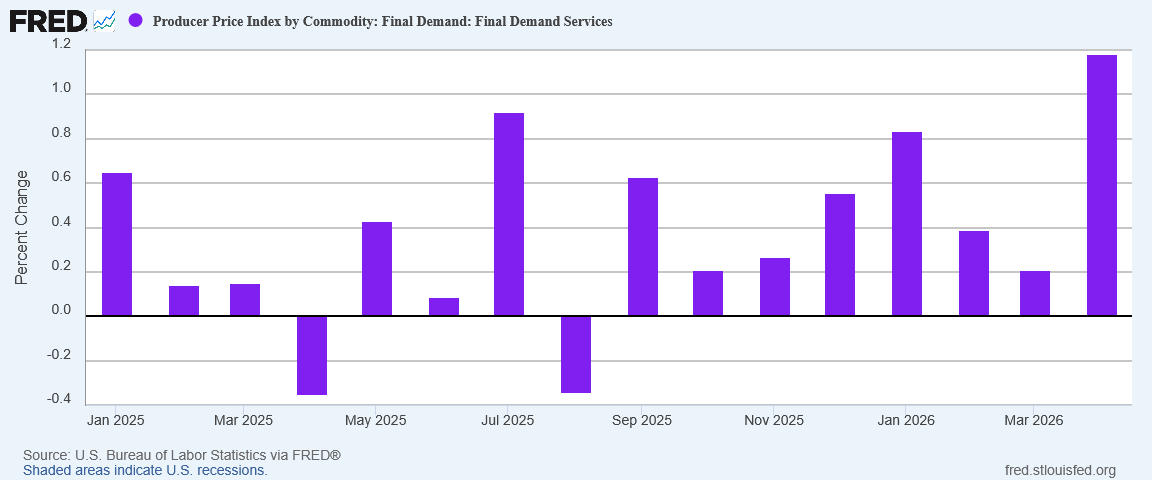
The rise in service price inflation accounted for 60% of the overall rise in the PPI for April. While energy is the obvious price shock, and a continuation from March, services were what drove most of the April PPI increase.
Within Final Demand for Services, the primary inflation driver was in Transportation and Warehousing.
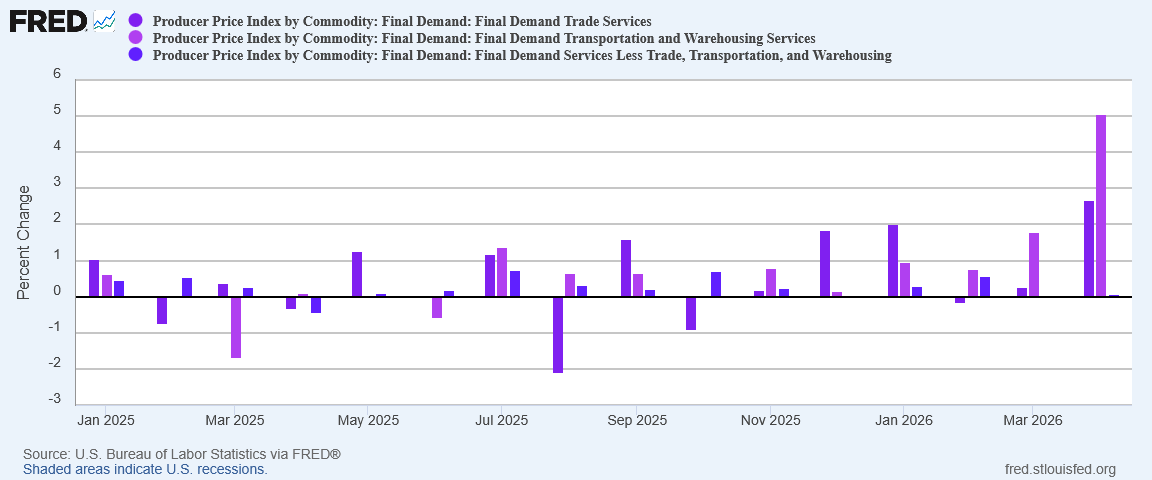
While not a direct energy price itself, transportation prices especially are easily seen as “energy adjacent” (if only because of fuel costs), making them the obvious next layer of inflation to come after a surge in energy prices.
Rising energy prices are pushing up service prices. Given the ubiquity of transportation costs through out the whole of the US economy, as transportation prices are pushed up, we should expect to see other prices being pushed up in future months as well. The price surge is not going to remain limited to just transportation.
Even so, while we are seeing a surge in transportation prices, that is the only place we are seeing significant new inflationary pressures for April. Goods price inflation overall was not much greater in April over March.
When we look at retail fuel prices from the EIA, we have further confirmation that there are no new inflationary prices entering the picture. After posting a nearly $2/gallon increase in March, retail diesel prices largely plateaued for April.
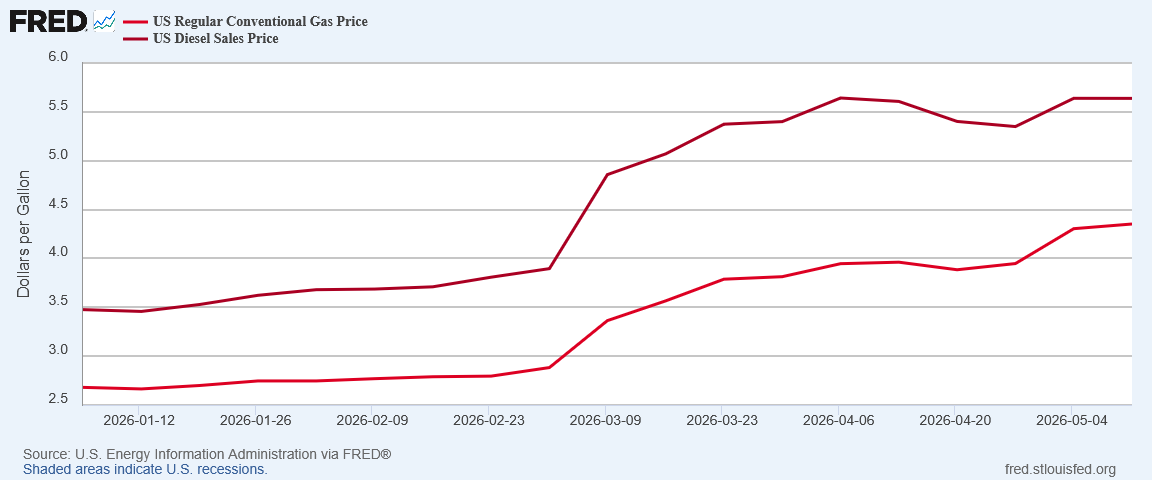
While retail gasoline prices continued to rise in April, the pace of the increase was much slower than in March.
Are we nearing what will be the peak in retail fuel prices? The overall trajectory certainly suggests that fuel prices are nearing a ceiling level. That would also imply that transportation prices might not rise much further in coming months.
The data does not allows us to extrapolate to that degree with confidence, but the possibility is certainly there.
Intermediate Demand Inflation Getting Worse
Where we do not see signs of a ceiling level is among intermediate demand prices. There factory gate inflation rose from March to April for each intermediate stage.
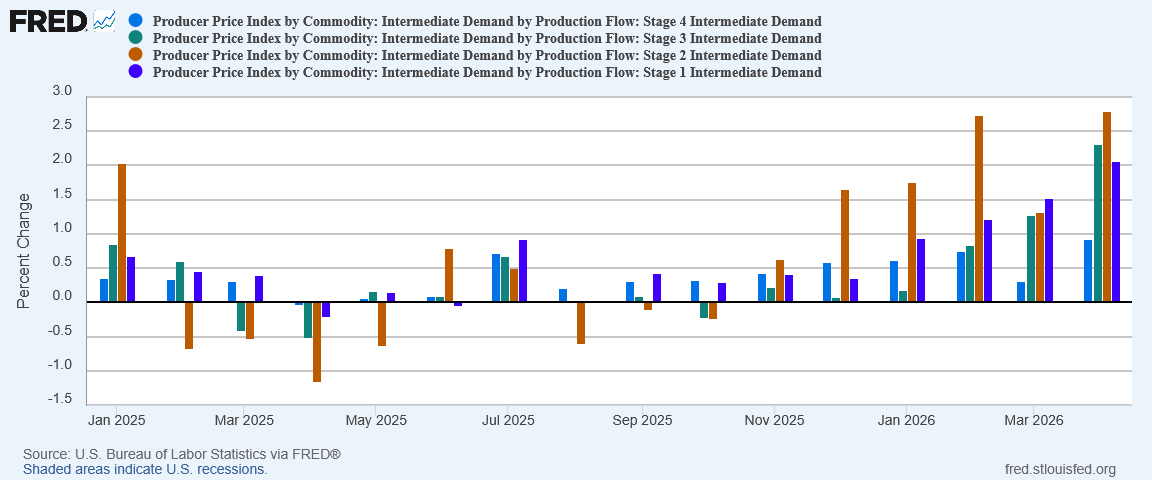
This is the clearest signal within the PPI data set that there is significant inflation still to work through to final demand goods and services, and from there into the Consumer Price Index. While we have reason to hope that some inflationary pressures may already be reaching a maximum, given the levels of disruption from the Persian Gulf, those pressures are still reverberating through the rest of the economy, and that means they will be pushing other prices up in May and June, and possibly beyond.
That is especially worrisome news when it comes to fertilizer prices.
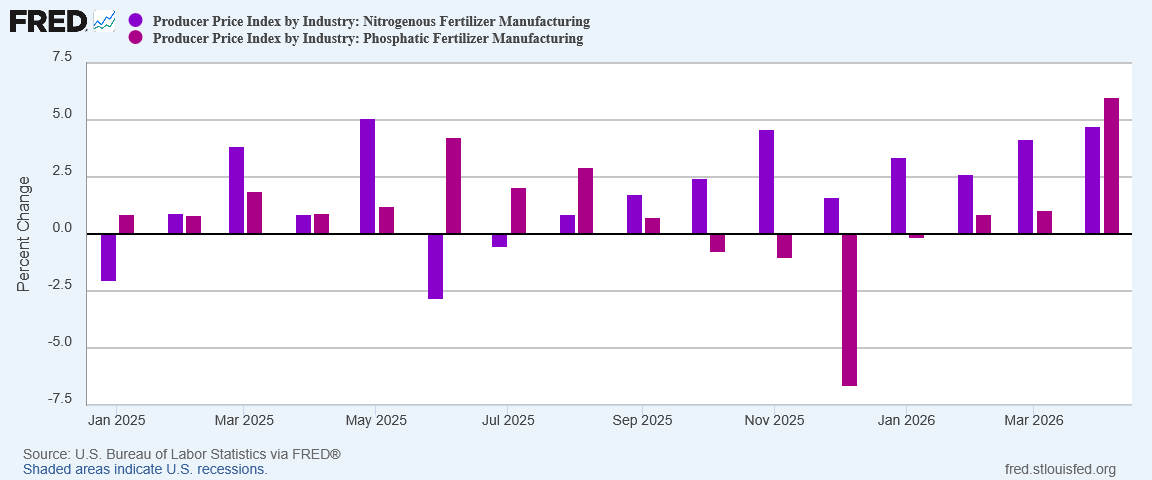
While nitrogenous fertilizer manufacturing has been showing signs of inflationary pressure even back in January, well before Operation Epic Fury, phosphatic fertilizer manufacturing was showing no such pressure prior to April.
If we drop back to the year on year perspective, we see that nitrogenous fertilizer prices have been moving up since early 2025. Phosphatic fertilizer prices do not show much of any price increase before April.
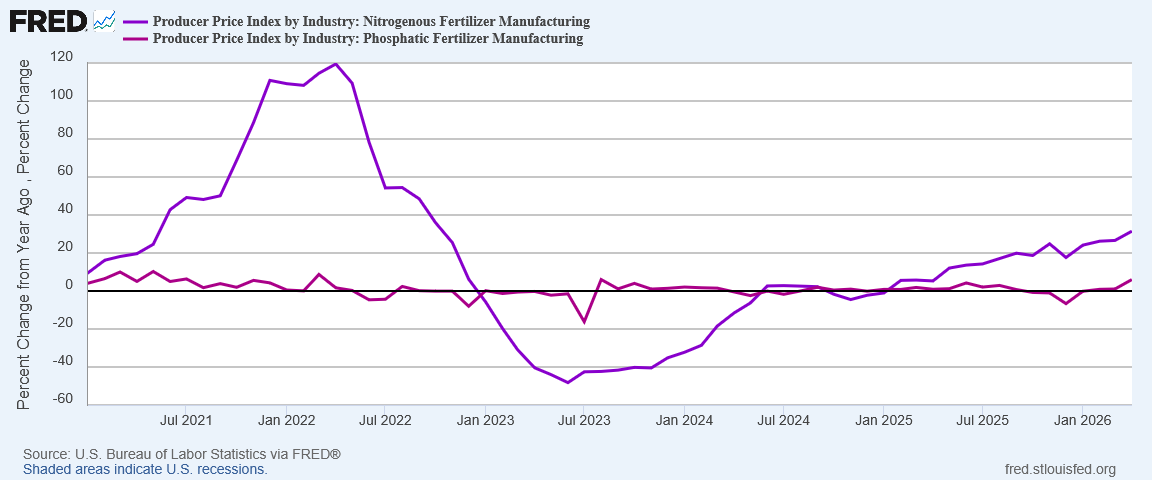
Rising fertilizer prices mean a major cost in food production is also rising—a cost which is difficult to control without diminishing levels of food production itself. Cut back on fertilizer applications and harvest yields are likely to diminish. Both as a direct cost and as a secondary effect of reduced harvest yield, rising fertilizer prices today mean we are seeing a food price inflation surge building for later in the fall and into 2027.
April was a mild month for food price inflation. Future months will not be quite so mild.
How Much More Inflation Will We Get?
The significance of producer prices is that they are seen as a leading indicator for consumer prices. Major inflation shifts often emerge in the producer price index first, and in the consumer price index a month or two later.
Certainly when we look at the Producer Price Index and the Consumer Price Index percent changes year on year, we see the CPI trend is roughly one to three months behind the PPI trend, particularly when there are major price shifts.
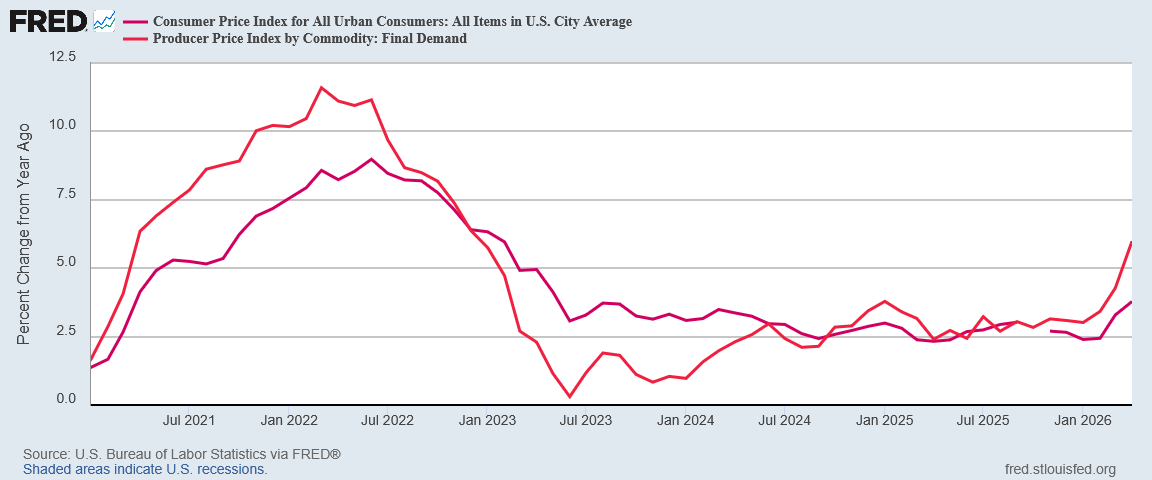
When the changes are smaller the correlation becomes a less certain, but when there are large shifts, they generally impact the Producer Price Index first.
If we see a peak in year on year inflation for the Producer Price Index, we may expect to see a similar peak in the Consumer Price Index in the very near future. If we see a trough in the PPI, a trough in the CPI is not far behind.
Right now, we are seeing a major surge in the PPI. This suggests there are future rises in the CPI for May and probably June also.
Yet we are also seeing signs at least within energy prices that the inflationary pressures pushing prices up may not get much worse than where they are at today. Energy price inflation may have already peaked, and other prices may be on the verge of peaking. Retail fuel prices may be reaching a ceiling level beyond which they are not likely to go.
We are seeing a major surge in the PPI, but we are also seeing signs the peak may not be far off.
While the final verdict on energy price inflation will only come when the Strait of Hormuz is finally re-opened as an international waterway (which itself is not likely to come before there is a final peace between the United States and Iran), it may very well be that the total impact of the Strait’s closure is not going to rise much further. If President Trump and the War Department decide to simply continue the US Navy blockade of Iranian shipping, and do not resume major hostilities against Iran, the current state of affairs in the Persian Gulf may develop a short-term stability, where the magnitude of changes day to day and month to month do not shift dramatically.
Should we see even a temporary geopolitical equilibrium in the Persian Gulf, we should expect to see also a temporary equilibrium in energy prices, and from energy prices transportation and then other prices. Where there is significant inflation today we may not see significant inflation tomorrow.
Note, however, that a possible lack of future inflation is not the same as suggesting that oil and other prices are going to drop quickly. While equilibrium and a price plateau are possible even without peace between the US and Iran, price reductions are not. For oil prices and then other prices to come down, we must first have peace between the US and Iran.
How much energy price inflation—and thus how much stagflation—we ultimately get hinges entirely on the future of oil prices, and that rests entirely on how the war between the United States and Iran evolves. A peace deal would bring prices down, a mere continuation of the US Navy blockade would keep the current elevated prices in place, and a resumption of hostilities could easily push oil prices quite a bit higher.
Each scenario carries its own outcome on oil prices, and thus each scenario carries a consequent impact on overall inflation, first Producer Price Inflation then Consumer Price Inflation. We do not know—and cannot know—which scenario we will have for the coming months until we have it.
Will we get more inflation? It is entirely possible.
Is the worst energy price inflation behind us? It is possible, even probable, that the biggest energy price shifts are already behind us. That would mean the biggest price shifts giving rise to stagflation concerns may already be behind us as well, or soon to be behind us.
That is the optimistic outlook—one might even call it a “Trumpian” outlook. Whether that outlook is the ultimate outcome is, for now, a question for which we do not have an answer.
By the way, Peter, I expect Trump to do “something” while he is in China on his high-profile state visit. What, no one knows, but it will be a move that will impress on Xi and all of the world that Trump is still a vital, powerful man - even though he’s about to turn 80 - and that Trump IS the Top Dog of the world and Xi better realize it!
If you get any inkling, in the next few days, of what it might be, please clue us in, Peter. Your powers of perception are mighty!
Come on, Mr. President, get this war WON and DONE!