


The August Consumer Price Index Summary was, in most respects, a repeat of the Producer Price Index Summary in its predictability. Energy price inflation went up, headline inflation went up, core inflation not so much.
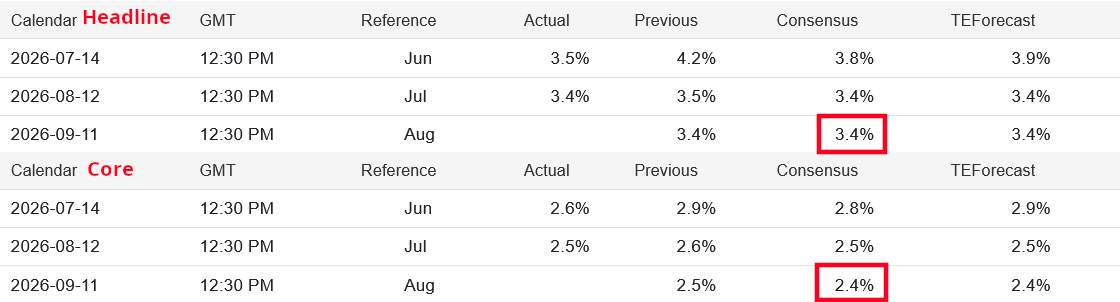
The Consumer Price Index for All Urban Consumers (CPI-U) increased 0.4 percent on a seasonally adjusted basis in August after rising 0.1 percent in July, the U.S. Bureau of Labor Statistics reported today. Over the last 12 months, the all items index increased 3.4 percent before seasonal adjustment.
The index for gasoline rose 3.9 percent in August, accounting for over one third of the monthly all items increase. The index for energy increased 2.1 percent over the month. The shelter index rose 0.3 percent in August after rising 0.1 percent in July. The index for food increased 0.1 percent over the month, as the index for food away from home increased 0.3 percent.
The index for all items less food and energy rose 0.3 percent after increasing 0.2 percent in July. Indexes that increased over the month include communication, lodging away from home, airline fares, education, and used cars and trucks. Conversely, the index for medical care and the index for motor vehicle insurance were among the major indexes that decreased in August.
The all items index rose 3.4 percent for the 12 months ending August as it did for the 12 months ending July. The all items less food and energy index rose 2.4 percent over the year, following a 2.5-percent increase over the 12 months ending July. The energy index increased 16.3 percent for the 12 months ending August. The food index increased 2.7 percent over the last year.
There was no surprise in this, as the headline and core numbers were exactly where Wall Street expected them to be.
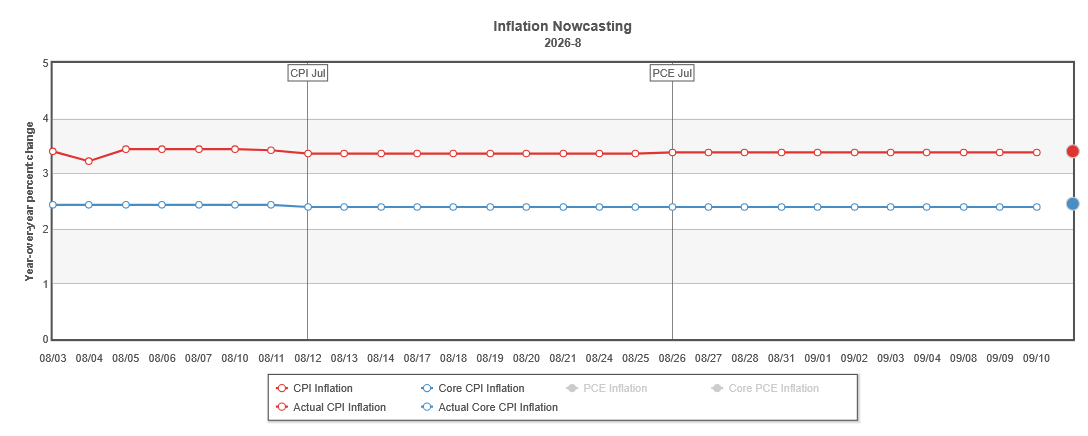
The Cleveland Fed’s inflation nowcast confirmed that Wall Street had a good grasp on the state of consumer price inflation, matching the inflation print almost exactly.
Energy prices rose for the predictable reasons surrounding the war with Iran, and while a supply shock is building within diesel fuel, that shock has not yet triggered either hyperinflation or stagflation within the US economy. We may yet feel one or both economic pains before long, but we are not seeing them in the data just yet.
The question on Wall Street’s mind: will the Fed raise the Federal Funds rate as many expect Kevin Warsh to do? Or will he go off script, actually look at the data, and make a reasoned decision to stand pat on interest rates.
Previously, I looked at the Employment Situation Summary and said a federal funds rate hike now would fail. The lack of core inflation in the August CPI report confirms that thesis.
Everyone Still Expects Kevin Warsh To Raise Rates
Even ZeroHedge agrees with corporate media that the August inflation report makes a rate hike almost inevitable, viewing the September FOMC meeting as something of a “test” for Kevin Warsh.
The jawboning is over... it's sh*t or get off the pot time for Kevin (every new Fed head is tested early on by the markets).
At CNBC, they noted that Wall Street was now almost all in on a September rate hike.
Traders responded to the numbers by ramping up bets that the Federal Open Market Committee will increase its benchmark interest rate by a quarter percentage point. Odds for a hike jumped to about 90%, according to the CME Group’s FedWatch tracker of fed funds futures prices.
CME Group’s FedWatch tracker has been surging upward seemingly with each new economic report that comes out of late. With probabilities above 90%, Wall Street is convinced there will a 25bps rate hike this week.
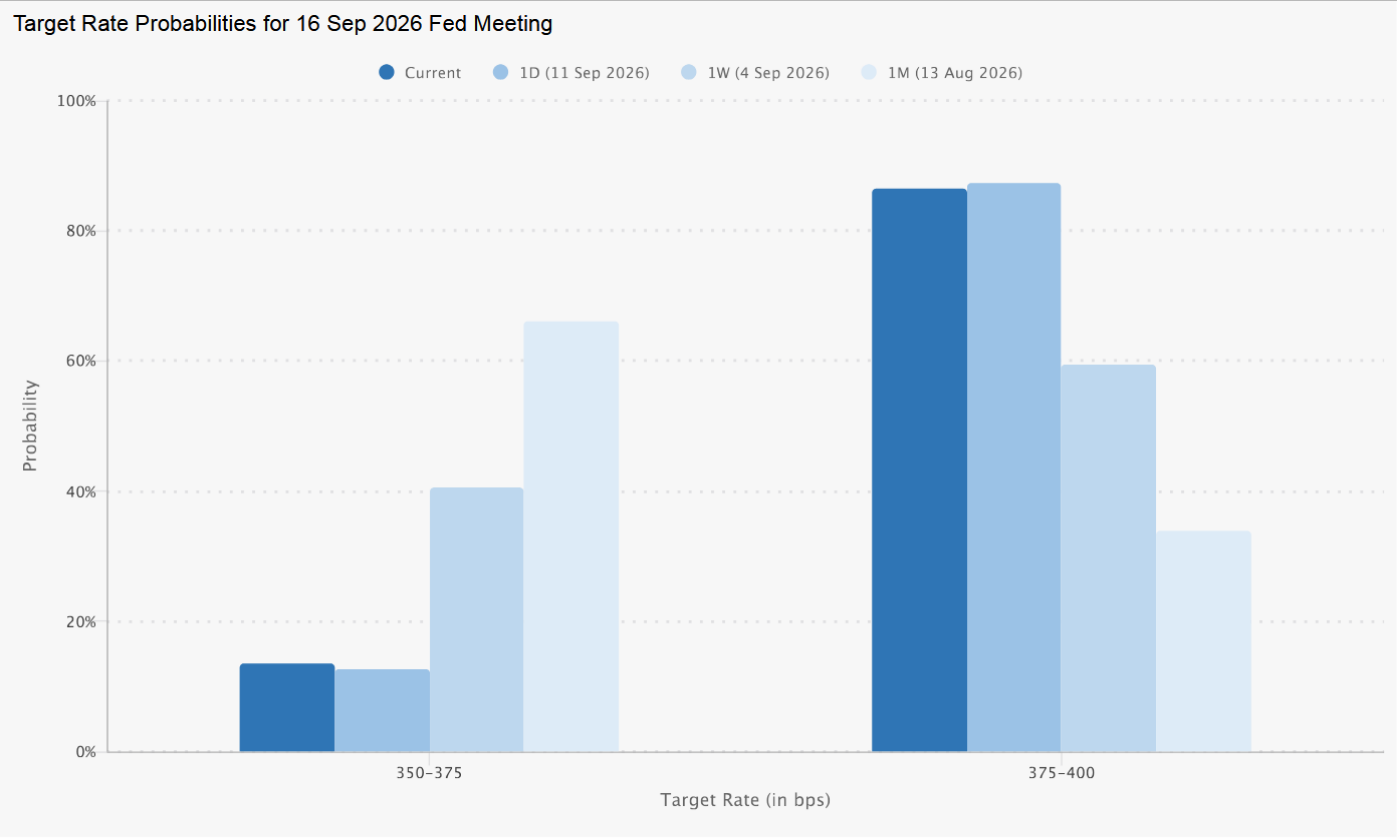
Bloomberg sought to justify the rate hike, since the data showed inflation had not cooled at all.
The consumer price index, excluding food and energy, rose 0.3% in August from a month earlier, according to Bureau of Labor Statistics data out Friday. On an annual basis, it advanced 2.4%.
Overall consumer prices rose 0.4% from the prior month on higher energy prices, and 3.4% from a year earlier. Futures showed investors priced in a rate hike next week as a near certainty, and put a high likelihood on a second increase before the end of the year.
Only alternative outlets such as The Epoch Times pointed out how little inflation really changed.
While no one likes rising prices, and while the rise in energy prices could portend a major economic crisis about to crash over the world’s economies, the reality is that, despite the rising energy prices, the US economy is not showing signs of stagflation or hyperinflation, at least not yet. There is at present no supply shock of sufficient magnitude to warrant a countervailing interest rate shock from the Federal Reserve.
Outside Of Energy, Not That Much Inflation
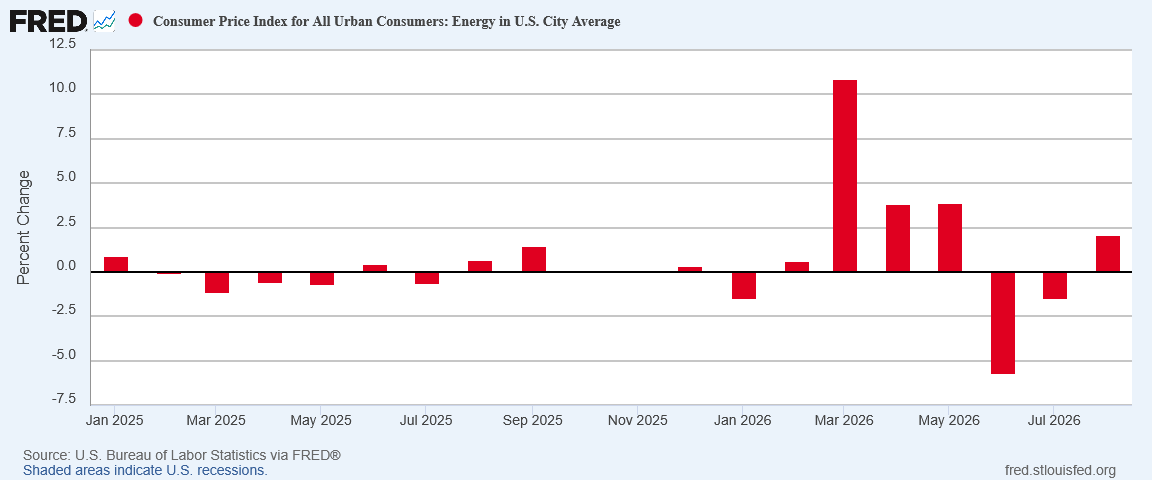
Energy, naturally, is the major inflation story in the August CPI report, returning to inflation from outright deflation at 2% month on month.
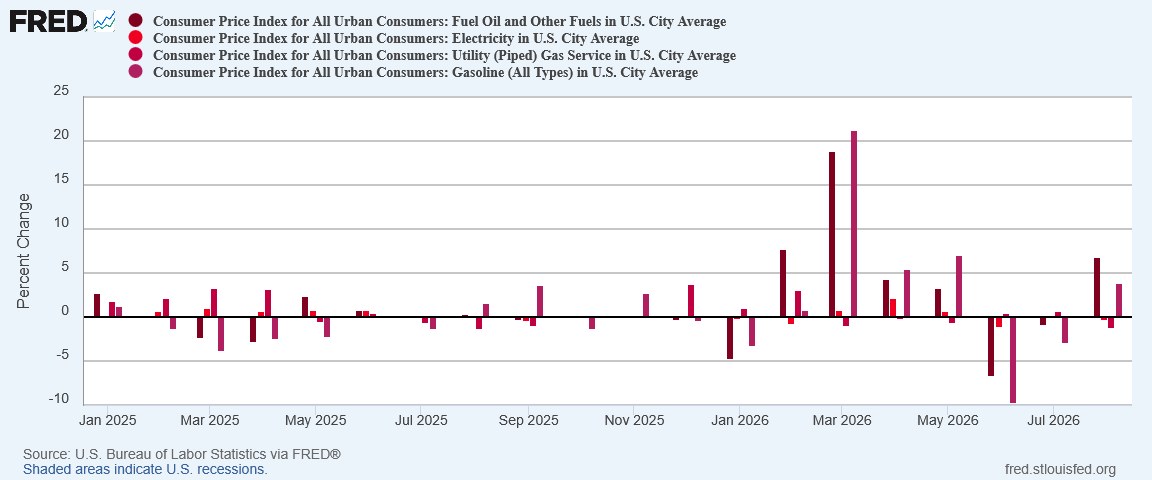
The major contributors to that inflation rate were equally self-evident: Diesel (6.8% MoM) and Gasoline (3.9% MoM)
Even core inflation appears to be heating up, as the month on month number rose to 0.3% from 0.2%.
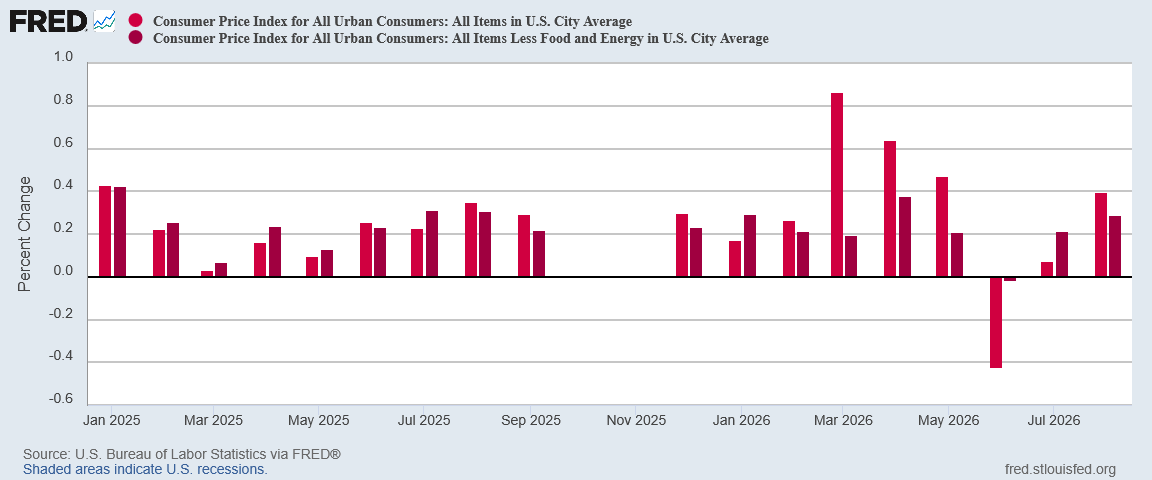
Headline inflation rose to 0.4%, reflective of rising energy price inflation.
The year on year inflation rate, however, shows core inflation to be cooling.
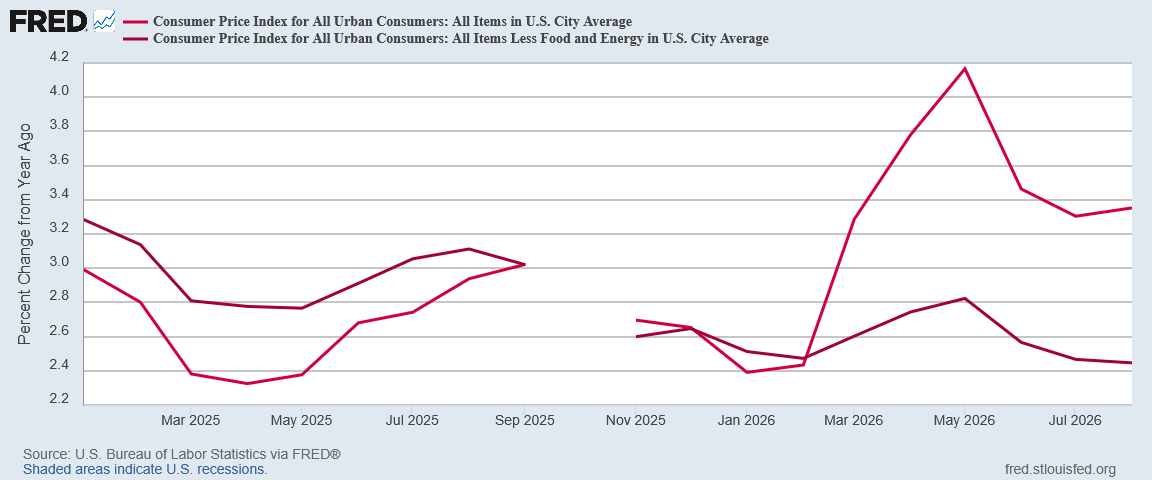
Core CPI has been showing a disinflation trend since August, 2025, and the August, 2026, print of 2.4% year on year did not alter that trajectory.
Yet once again, beyond energy, we are not seeing significant inflation, and we are even seeing continued disinflation.
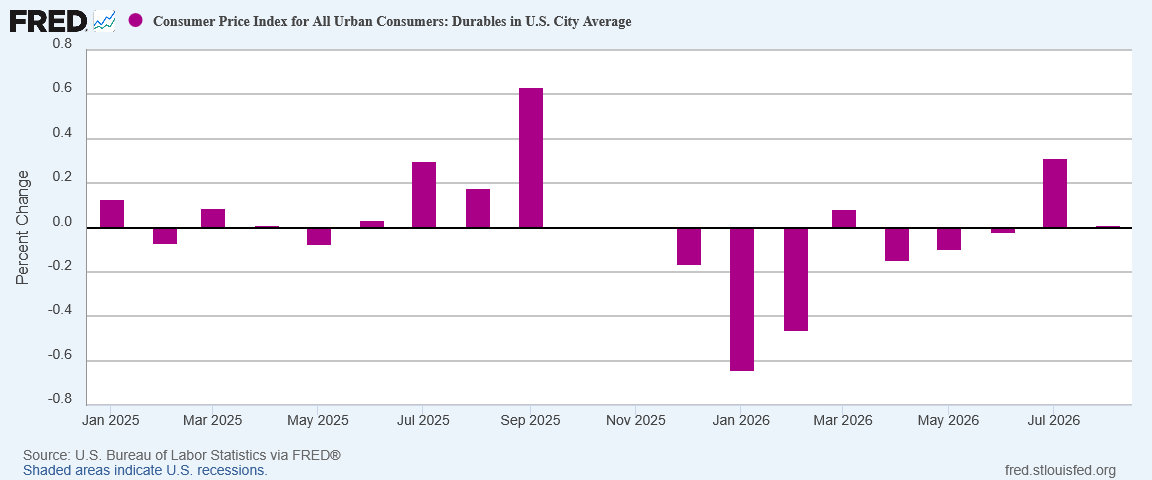
Durable goods inflation all but disappeared in August, making the July month on month spike a decided outlier.
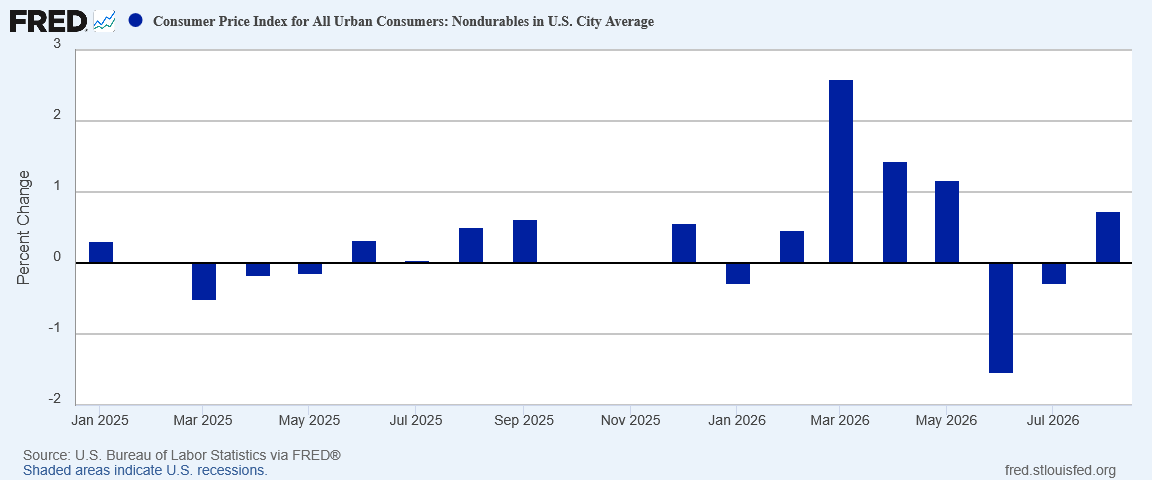
Nondurable goods inflation rose 0.7% month on month, a reversal from the prior two months of deflation.
However, a large portion of that nondurable goods inflation was due to energy prices rising.
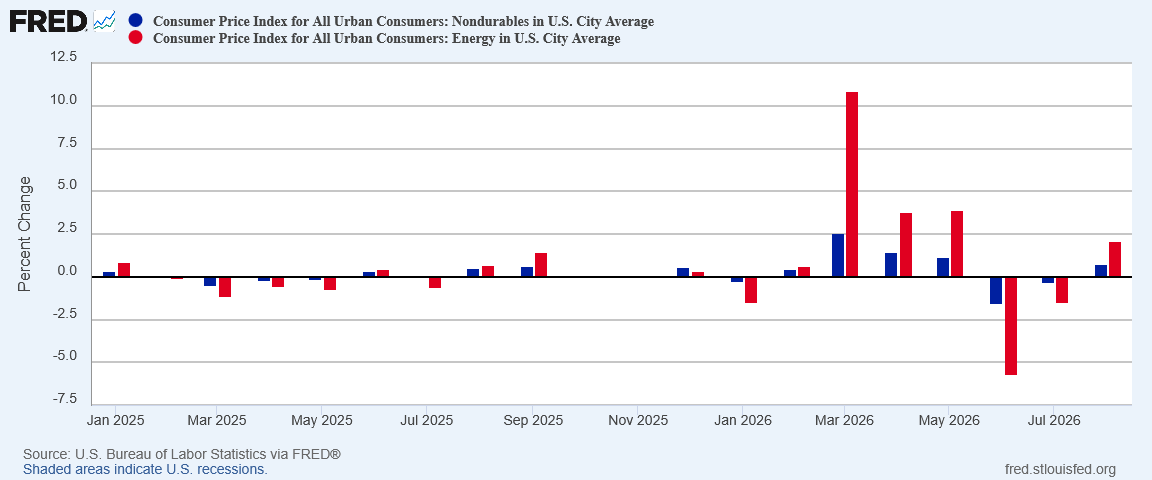
The large uptick in energy price inflation carried nondurable goods with it.
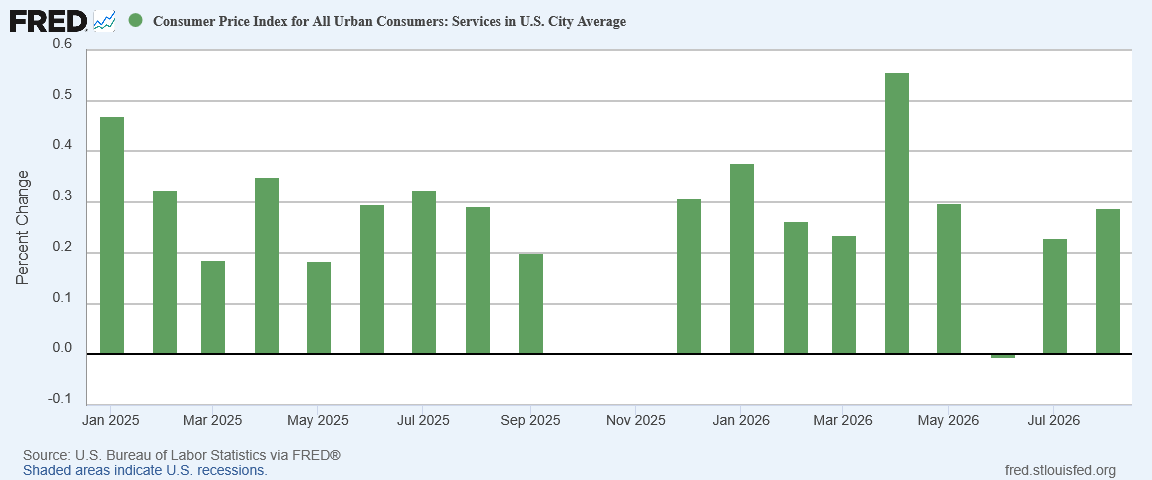
Service price inflation rose incrementally in August, keeping it in the same broad range month on month it has occupied since the start of Trump’s second term of office.
Food price inflation rose marginally, from 0.08% to 0.12% month on month.
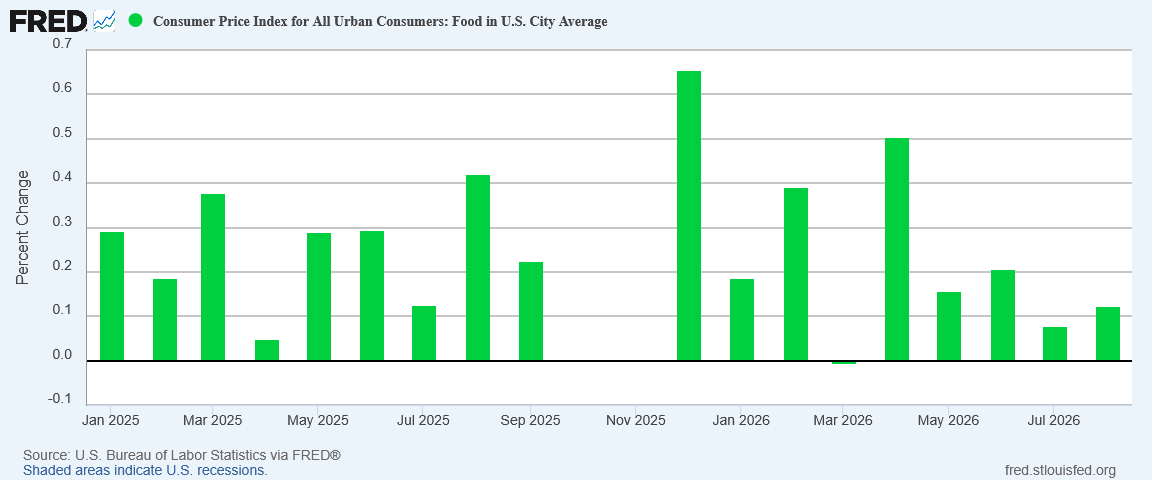
Shelter did show a small spike within the CPI data rising to .25% month on month.
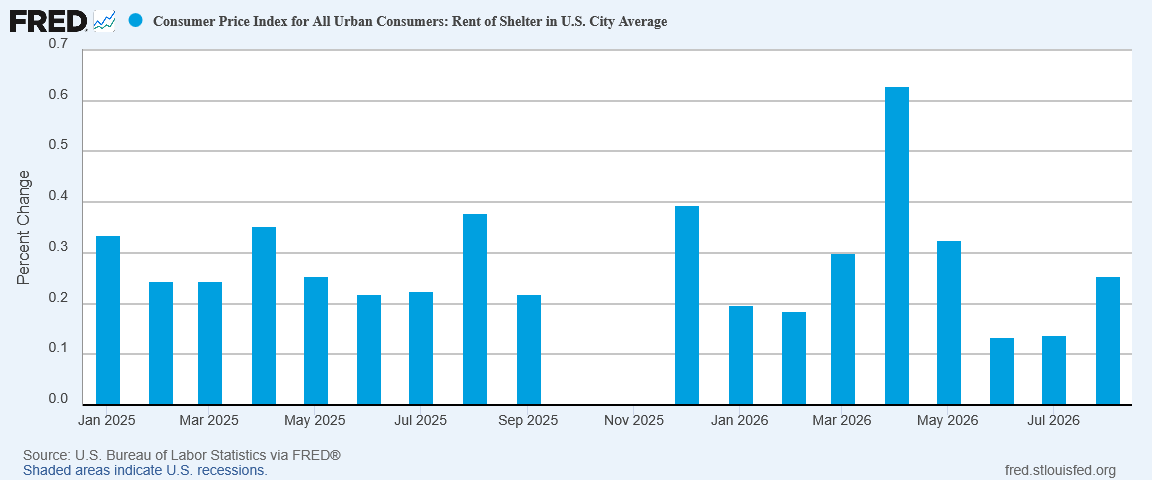
However, the more forward-looking Zillow Observed Rent Index (ZORI), showed rents in continued disinflation month on month.
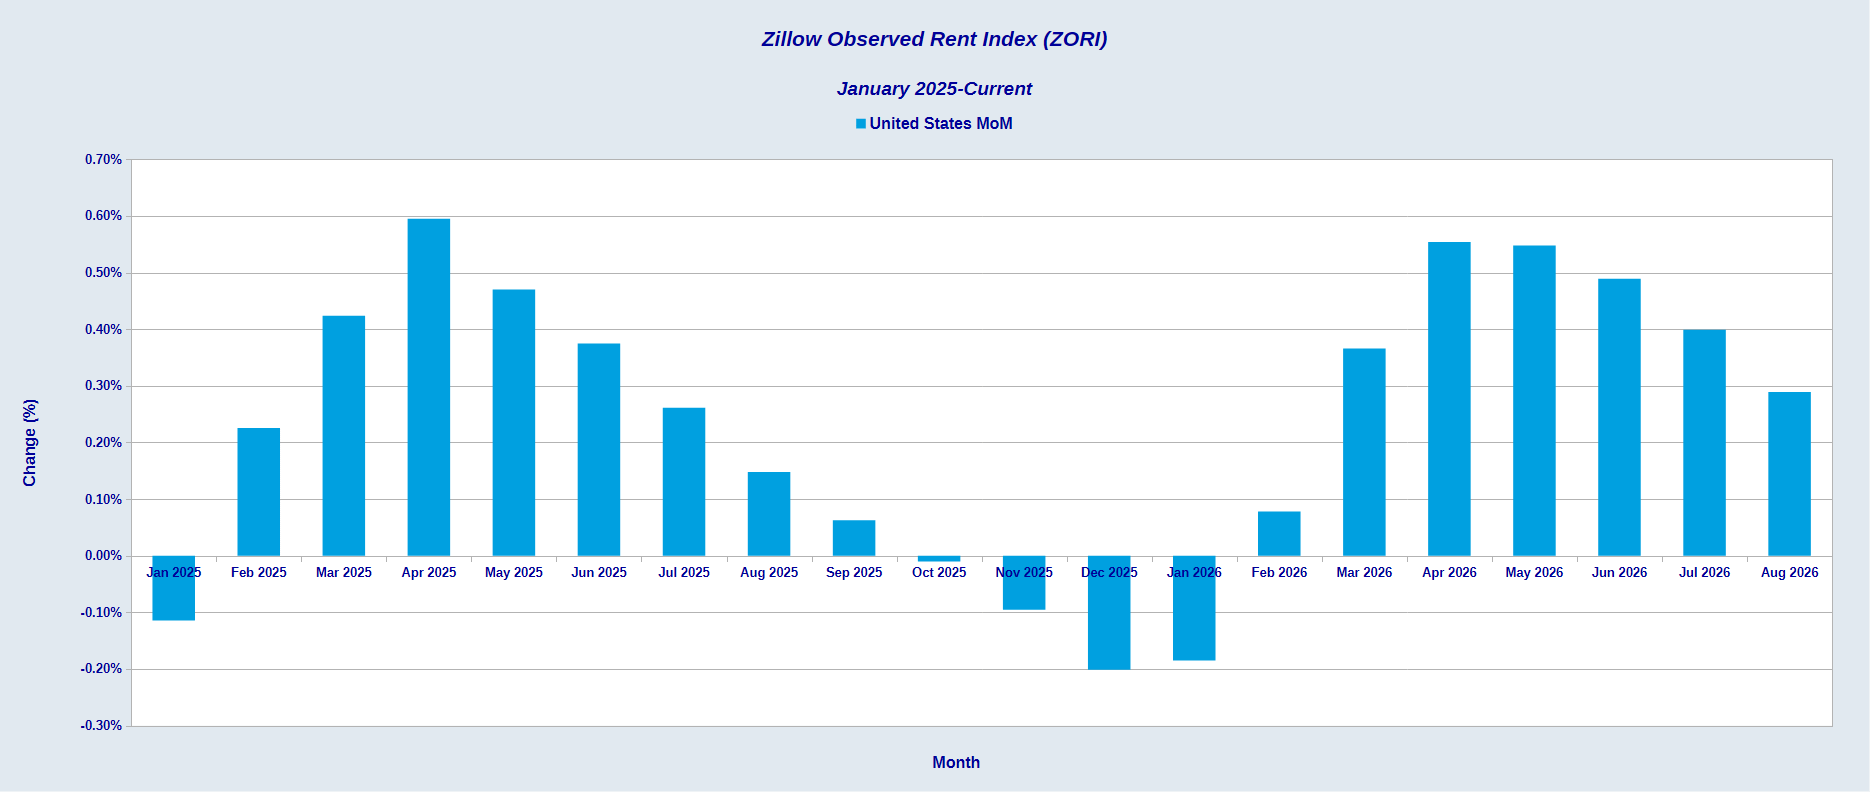
While inflation has not reached the Federal Reserve’s increasingly problematic “Holy Grail” figure of 2%, outside of energy prices—driven almost entirely by the disruptions from the war with Iran—the data is not showing any real sign of inflation heating up.
As the core year on year print indicates, core inflation is still getting cooler.
Energy Not Impacting Other Areas
That energy prices are not yet pulling other prices up is an important aspect of what we are seeing within consumer prices overall.
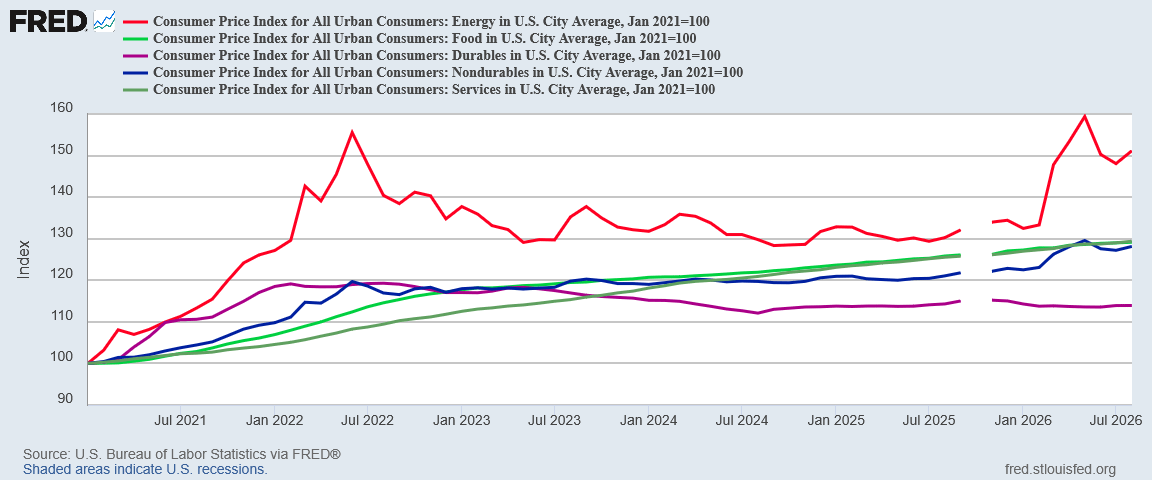
When we index the CPI subindices to January 2025, we do not see the energy increases being reflected in any other category besides non-durable goods (which will always be the case as energy goods are nondurable goods, and so there is overlap there).
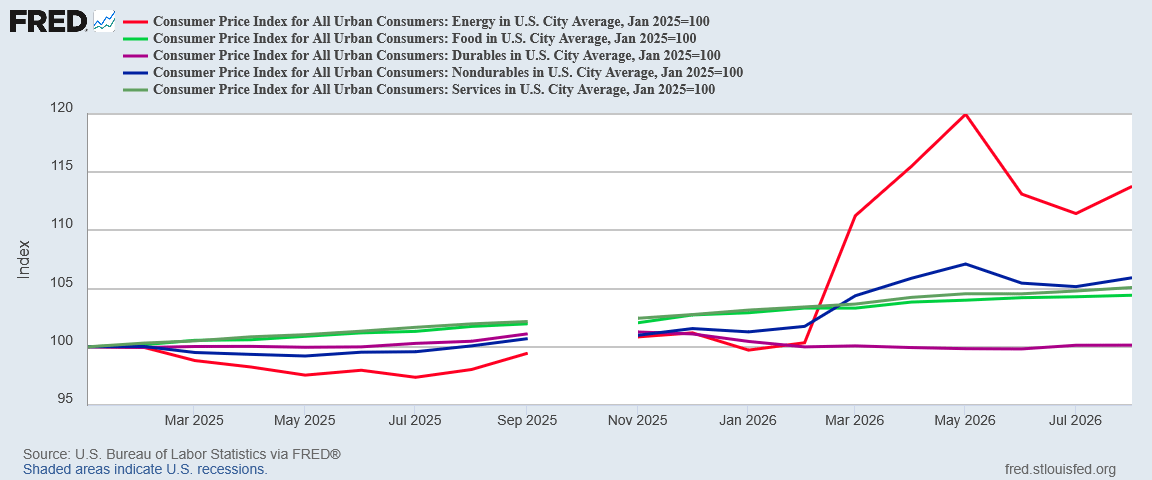
We did see energy prices having more of an influence on other prices during the 2021-2022 hyperinflation cycle.
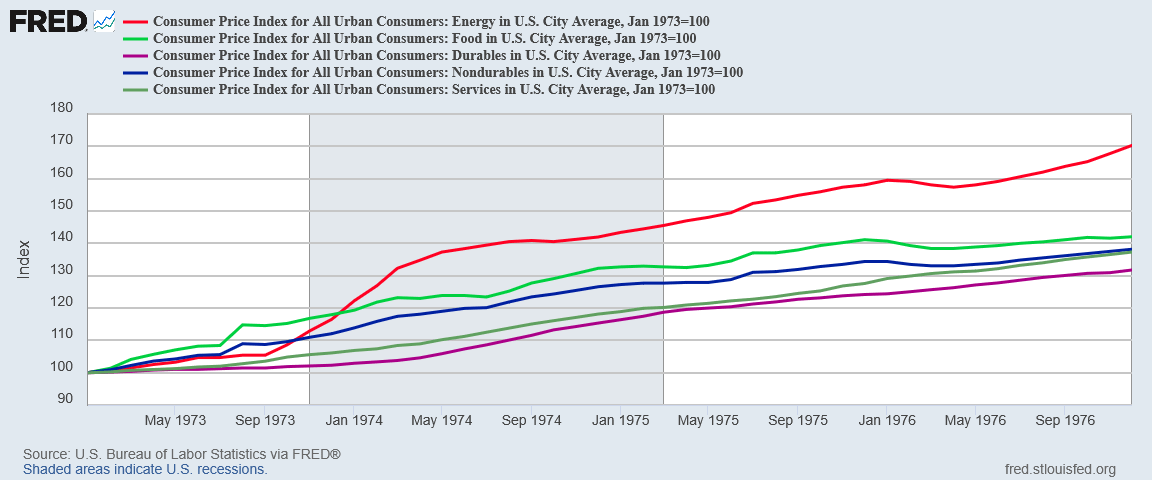
During the supply shocks of 1973-1974, inflation was more pronounced across all categories.
Inflation was also volatile across the board during the 1979 hyperinflation cycle.
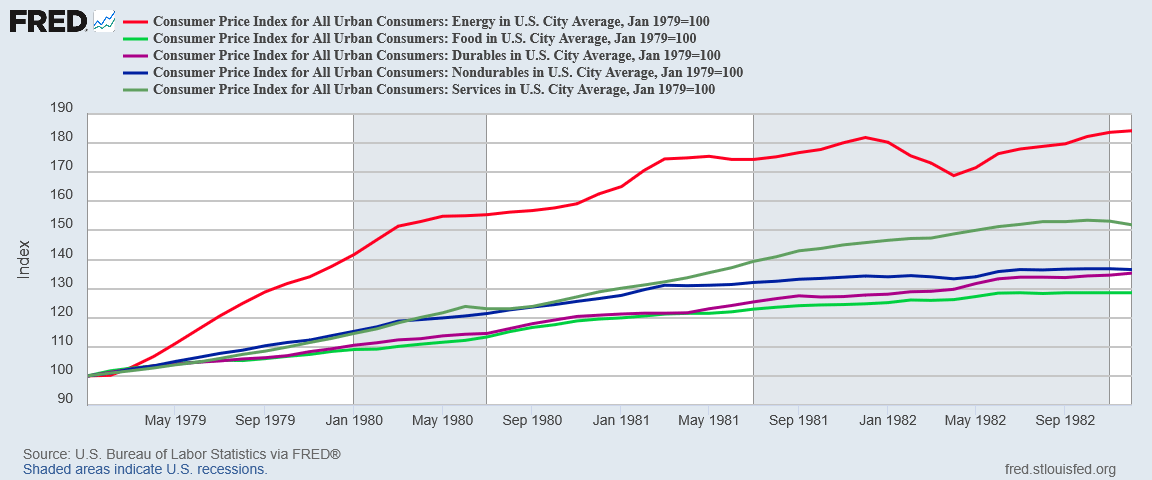
While it would be a mistake to presume that all inflation stems from energy price inflation, as there were myriad influence on prices in the 1973 and 1979 as well as in 2021-2022, at present prices are showing more stability than in previous period. Durable goods is even in a period of outright deflation so far this year.
When considering the rate hike that the Federal Reserve is widely expected to announce on Wednesday, at the conclusion of the September FOMC meeting, these broad demonstrations of price stability highlight the policy error that Kevin Warsh seems to be on track to make.
A Final Word On Energy Prices
While the broad inflation data leaves little to say other than to reiterate the folly of Kevin Warsh raising the federal funds rate at this time, we should take a moment to look at energy prices in greater detail.
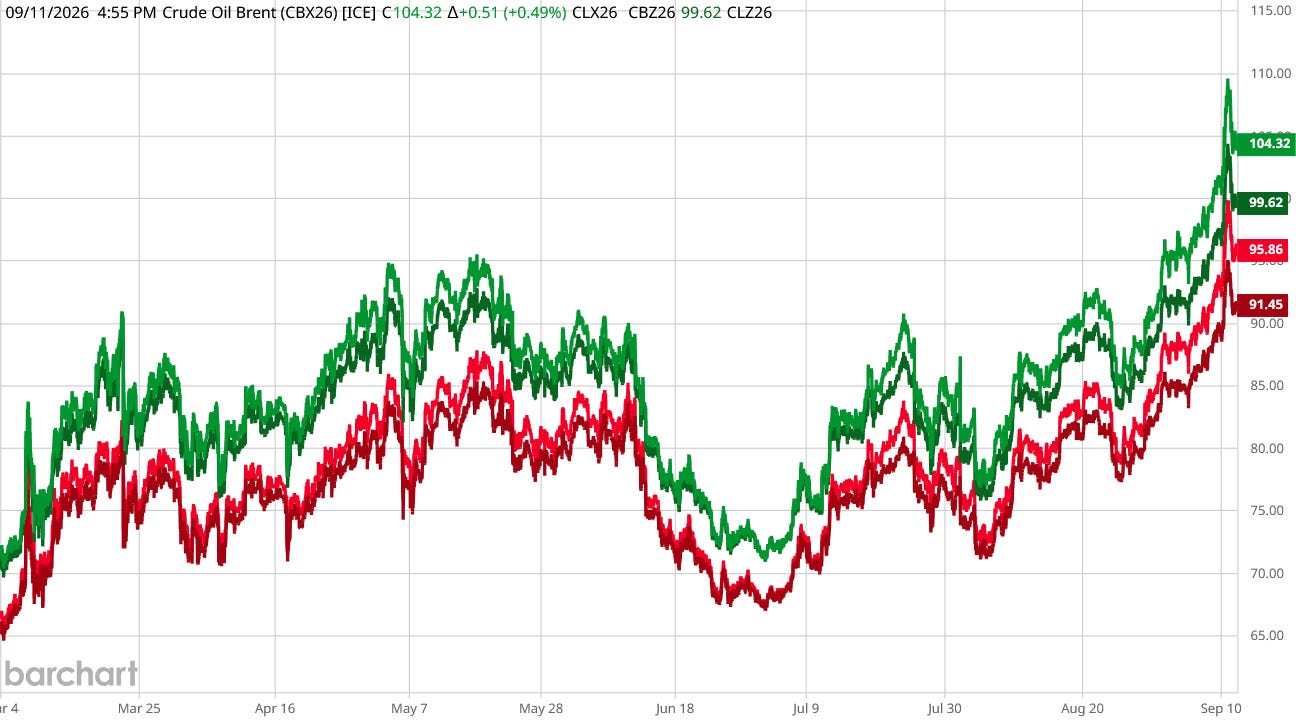
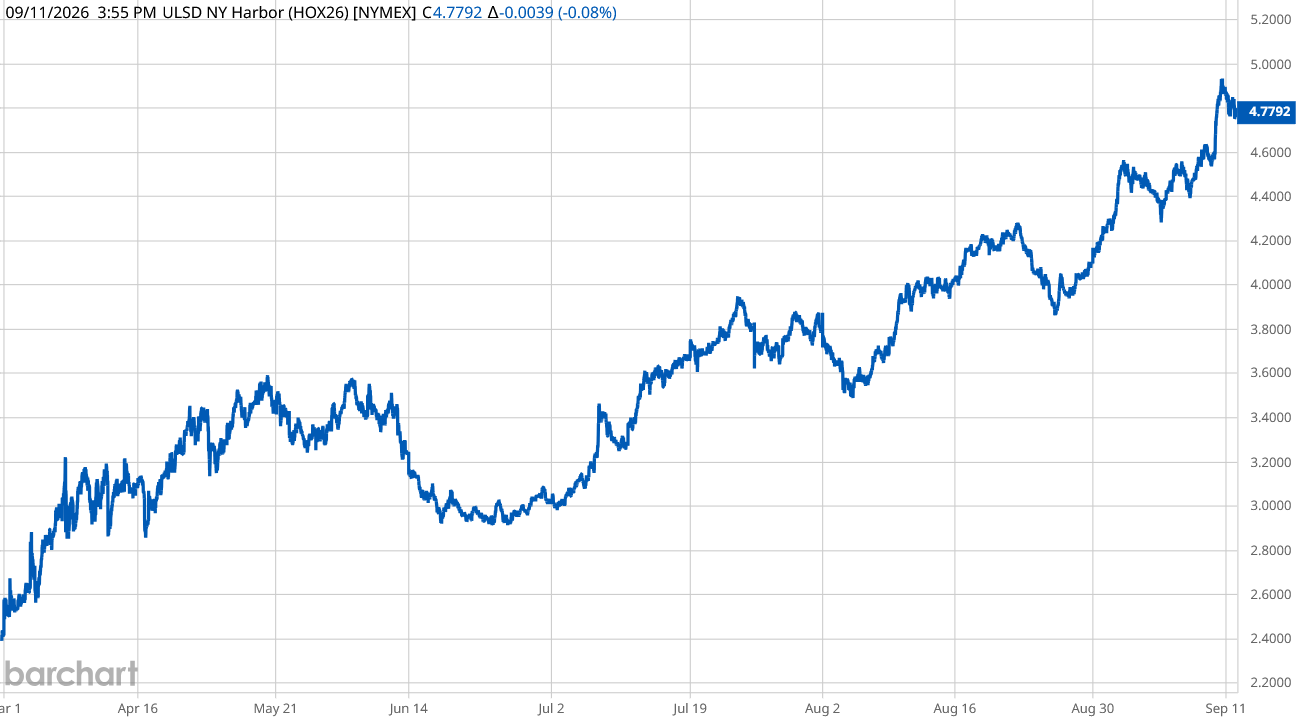
On Friday, West Texas Intermediate flirted with $100/bbl, and Brent Crude is firmly above that threshold.
Diesel prices are closing in on $5/gal.
Gasoline prices are well above $3/gal.
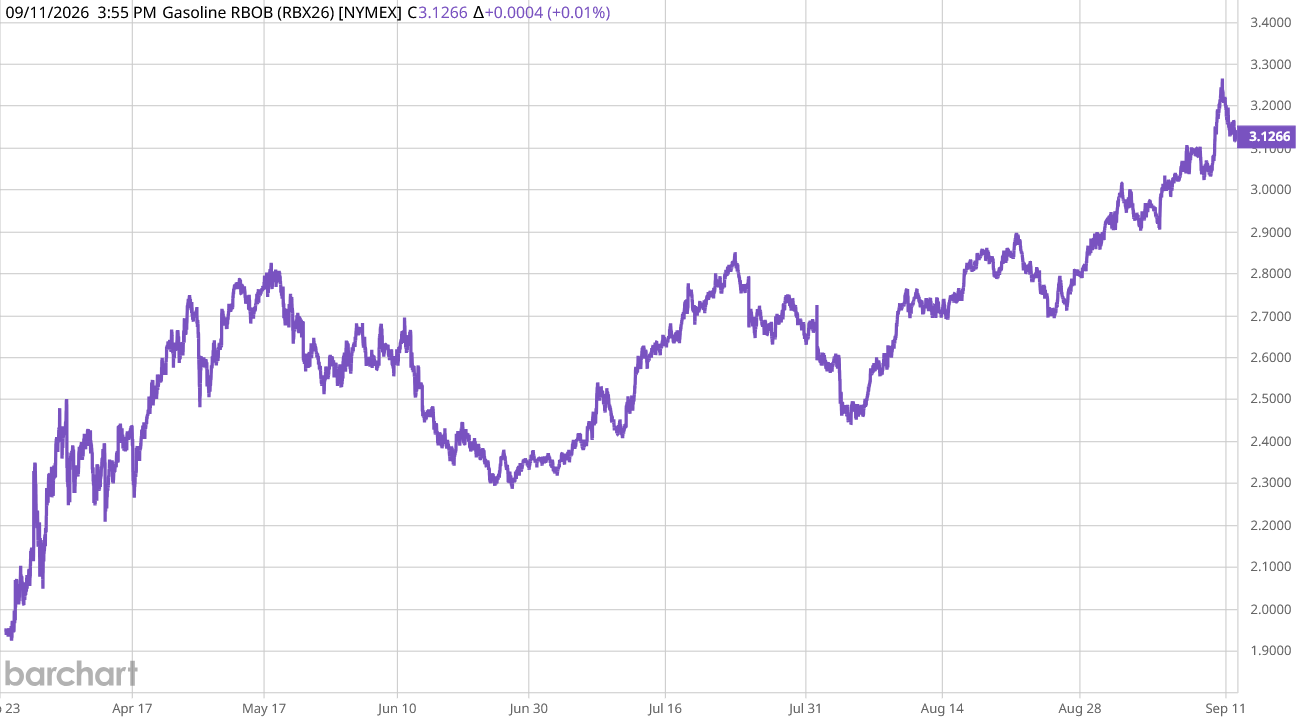
Since mid-summer, market energy prices have moved in one direction—sharply higher.
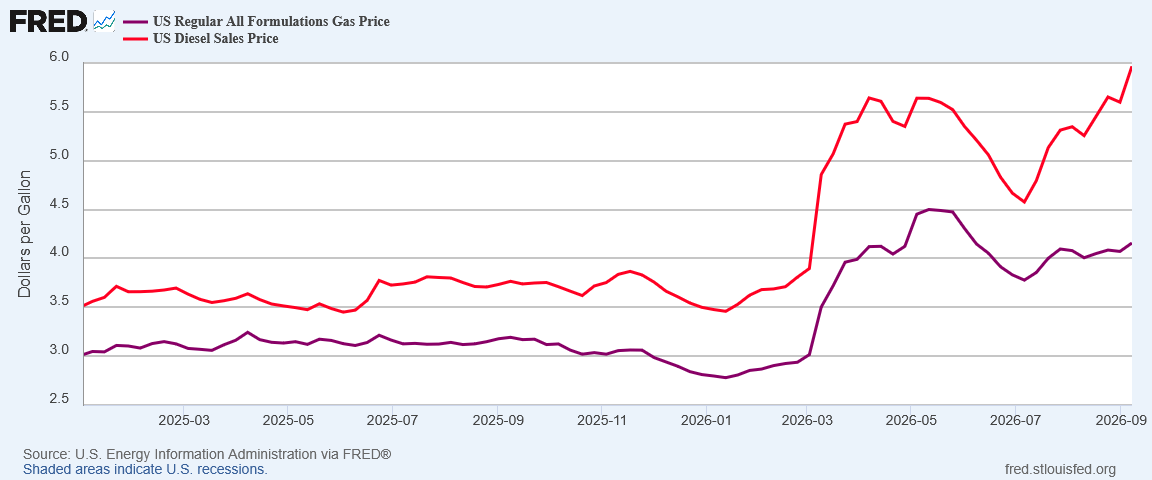
The EIA weekly fuel price averages have been following suit, and as of last week the reported average price for diesel was just below $6/gal.
As of yesterday, AAA reported the average price for diesel at $6.2/gal, and the average price for regular gasoline at $4.3/gal.
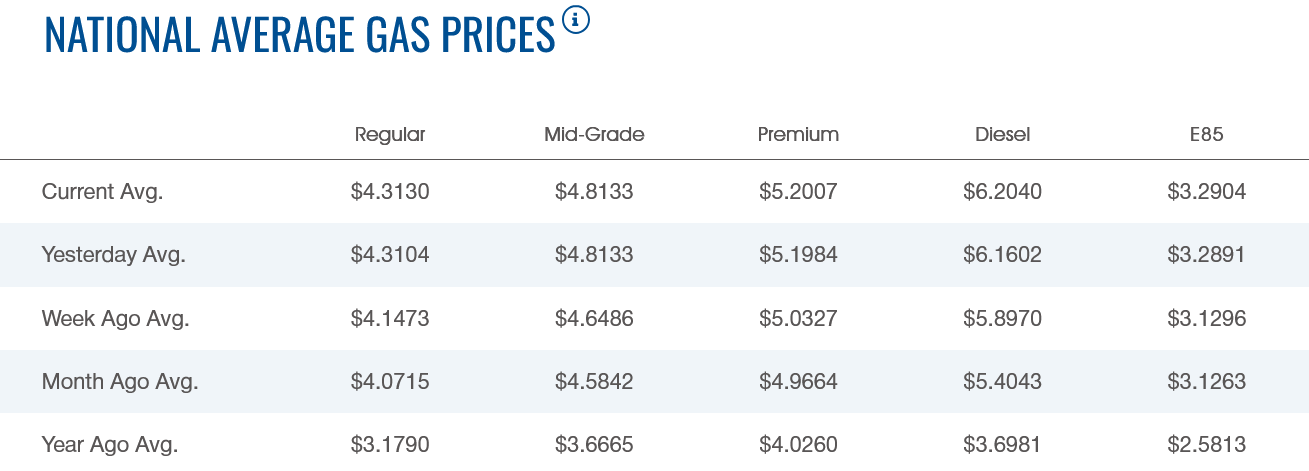
Per the AAA data, gas prices at the pump have risen nearly $0.25/gal in just the past month, while diesel prices have risen $0.80/gal over the same period.
On the year diesel is up some 70%, and gasoline is up some 48%.
These are steep price increases. While we can look at the broad inflation numbers and say “outside of energy, not a lot of inflation,” we should not overlook the reality that inside energy, there is quite a lot of inflation. This is inflation consumers are feeling every time they fill up their vehicles. This is an added cost for every Uber and Lyft driver, and for every grocery delivery person.
These prices are likely to only get worse over the near term, particularly diesel prices.
The crack spread for diesel is at an all-time high, finishing out the trading day Friday flirting with $110/bbl.
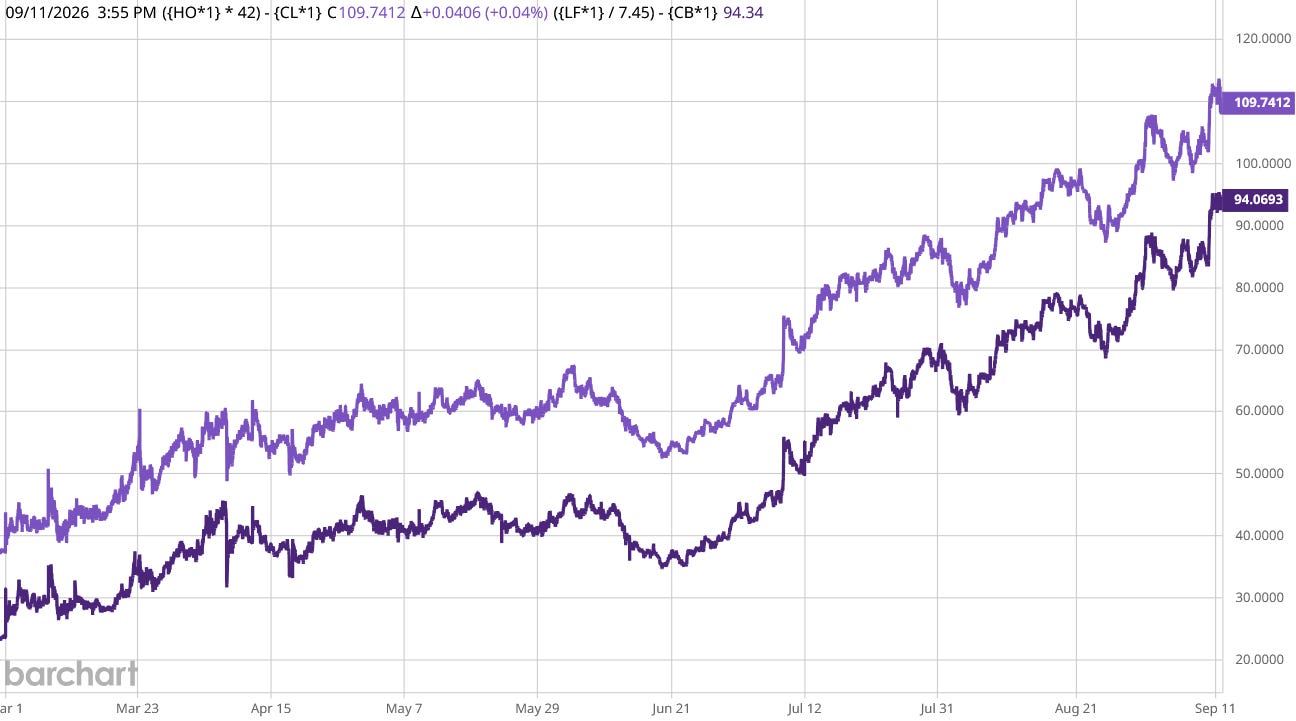
The crack spread on diesel is priced higher than the underlying contract on crude oil.
Gasoline crack spreads have moderated somewhat, but are still considerably higher than they were pre-war.
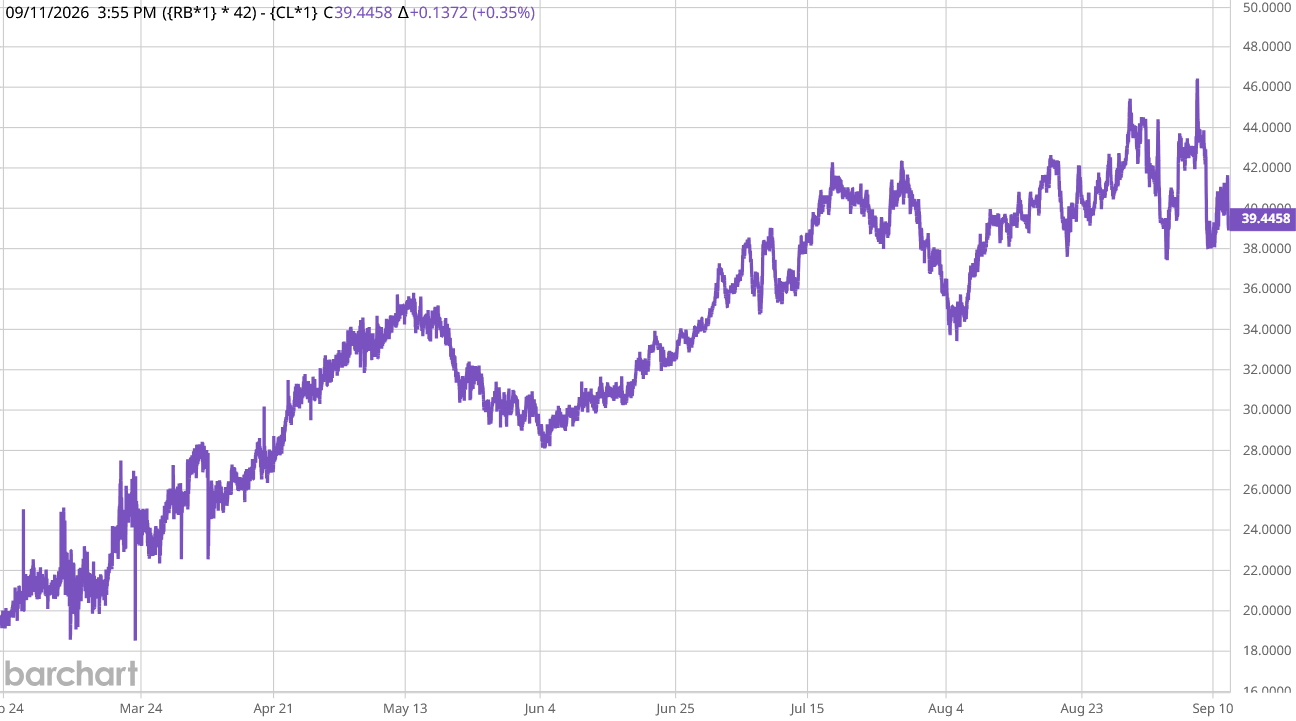
These are not good price trends. These are the sort of price trends that will result in stagflation in the very near future if they continue.
The broad Consumer Price Index and PCE Price Index data at present do not show the US economy to be experiencing stagflation. When we look at the Real Misery Index (inflation plus the real year on year unemployment rate), we see the index has actually moderated over the past few months.
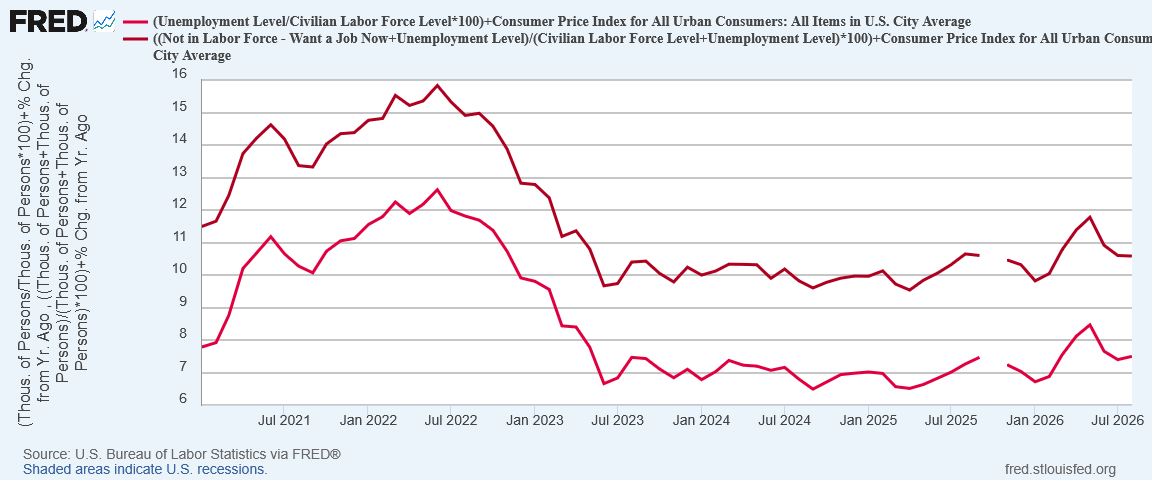
Compared to the Misery Index across the 1970s, the US economy is still on the low end of the range.
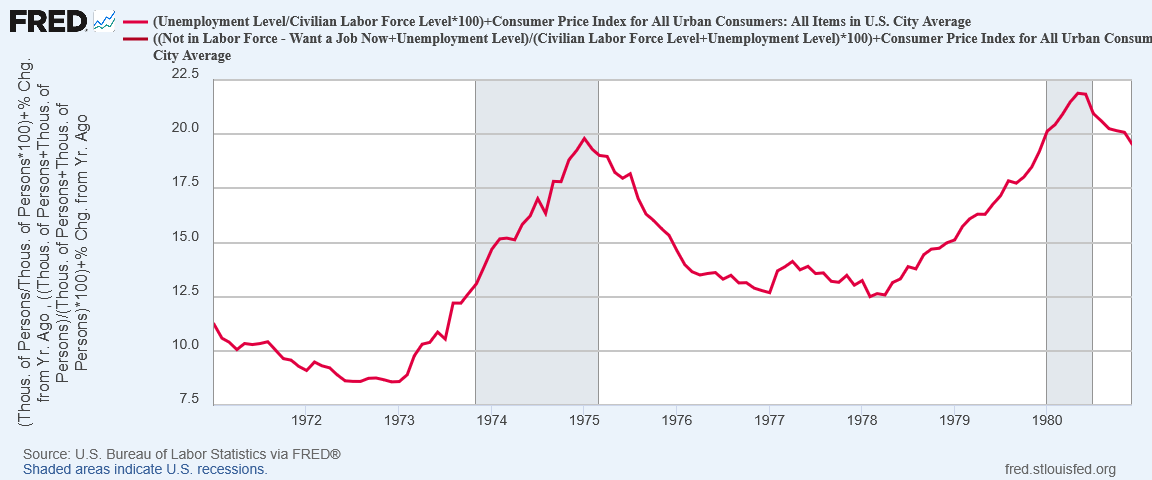
The more energy prices rise—the more diesel and gas prices push energy price inflation higher—the higher the Misery Index will move as well.
We are not experiencing stagflation now, but if energy price trends continue as they are, we almost certainly will, and sooner rather than later.
Interest Rate Hikes Still Not The Solution
August was a good month for jobs in America, and it has been the largely positive jobs reports this year that are helping to keep the Misery Index from moving higher.
Energy prices are already a major concern for most people, and are on track to become an even bigger concern. However, interest rate hikes are not going to make oil flow through the Strait of Hormuz, or move the Houthis off the Bab El-Mandeb. All interest rate hikes can do—and it would require a far larger increase than 25bps to accomplish anything—is suppress consumption and force demand (including energy demand) down to levels consistent with market equilibrium given the current constrained supply situation.
However, suppressing consumption to push energy demand lower will also push all demand lower. That’s how interest rate hikes work. That’s how interest rate hikes are designed to work.
Are lower energy prices worth a recession, when other pricing categories are not on course for hyperinflation?
That is what Kevin Warsh and the FOMC will be risking should they do as Wall Street expects and raise the federal funds rate on Wednesday.
A 25bps rate hike in the federal funds rate will not push down energy prices, and will not slow their rise from ongoing disruptions in the Persian Gulf.
A 25bps rate hike may very well curtail job growth. Depending on how much hiring pressure really exists in the economy, a 25bps rate hike may bend overall hiring back towards a new jobs recession—not immediately, but conceivably by the beginning of 2027.
Outside of energy prices, the August Consumer Price Index Summary was a pretty good inflation report. Given where energy prices are, and where they are going, even the energy price portion of the CPI print could easily have been worse. Given current energy trends in the market, the energy price portion of the CPI print is about to get worse, maybe even a lot worse.
Kevin Warsh needs to do the right thing and not misread the August Consumer Price Index Summary. Like the Employment Situation Summary and the Producer Price Index Summary, the CPI print is still an argument for standing pat on interest rates, not raising them.
“Over the last 12 months, the all items index increased 3.4 percent before seasonal adjustment.” That’s not so bad! It’s a heck of a lot better than the inflation under the Biden administration. We’re in the thick of the midterm elections campaign flurry, so the best news of the day is that the Democrats cannot run ads screaming that we’re all going to die from Trump’s tariff-and-war hyperinflation. It hasn’t happened!
You’re right, Peter, there are still ominous signs that we are on track for serious economic problems if the Iranian war continues. But if the economy can remain fairly stable for the next weeks, Trump could end up with the time span he needs to fix these. For a Monday morning, this is pretty optimistic news!
I very much appreciate your continued factual reporting and level-headed analysis, Peter. Thank you, as always!