


Corporate media is undoubtedly thrilled. After two months of not a lot of inflation in the Personal Income and Outlays report, in August there was finally a burst of actual inflation.
From the preceding month, the PCE price index for August increased 0.3 percent. Excluding food and energy, the PCE price index increased 0.2 percent.
From the same month one year ago, the PCE price index for August increased 3.4 percent. Excluding food and energy, the PCE price index increased 3.0 percent from one year ago.
However, while there was some inflation, there was not as much inflation as either Wall Street or the brain trust at the Fed expected.
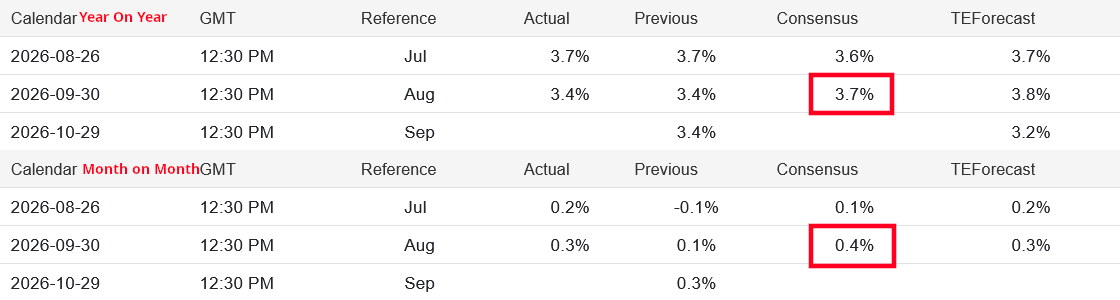
Wall Street had been expecting 3.7% inflation year on year, but only got a 3.4% print. Month on month, Wall Street had expected 0.4%, but only got 0.3%.
Even the Cleveland Fed’s inflation nowcast was unusually wide of the mark.
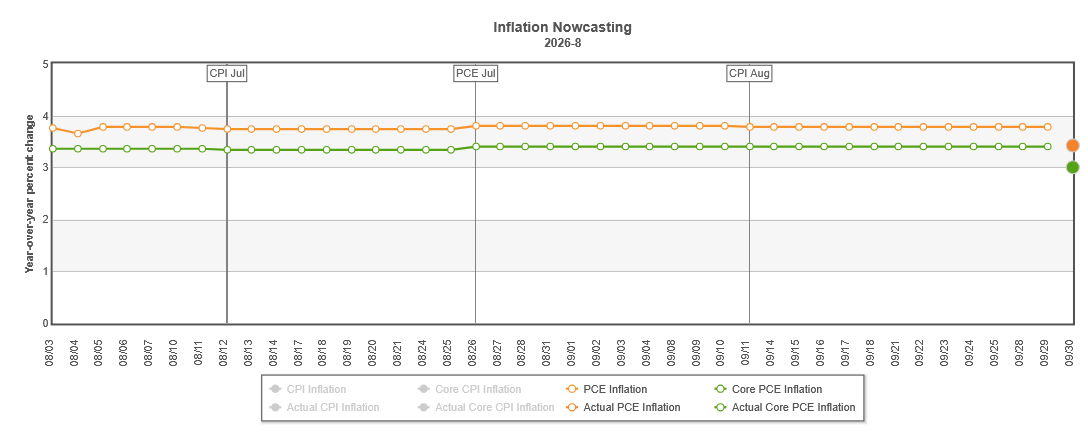
The Cleveland Fed’s inflation nowcast projected headline PCE inflation at 3.8% and core inflation at 3.4% year on year. Actual headline inflation was 3.4% and actual core inflation was 3% year on year.
Month on month inflation did pick up from July. That was all it took to make corporate media happy—a small increase in month on month inflation (a very small increase).
Note, however, that a month on month incremental rise in consumer price inflation is not the same as a trend of rising inflation. Aside from energy we haven’t seen such a trend all year.
Corporate Media As Stuck On 2% As The Fed
Corporate media is perhaps the only entity more obsessed with the 2% “Holy Grail” inflation figure than the Federal Reserve itself.
The only thing making inflation “elevated” or “high” is that it is above 2%. That much is evident just by looking at the headlines corporate media put out in reporting the PCE inflation data.
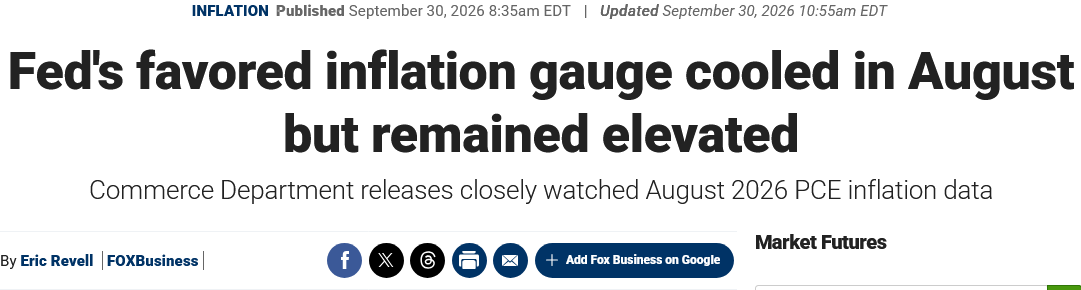
Relatively Trump-friendly Fox News acknowledged the overall trend of inflation—but said it remained “elevated.”
CNN blamed inflation on the war with Iran (of course).

Reuters had perhaps the most honest take on the data, admitting that the inflation numbers put less pressure on the Fed to hike interest rates further.
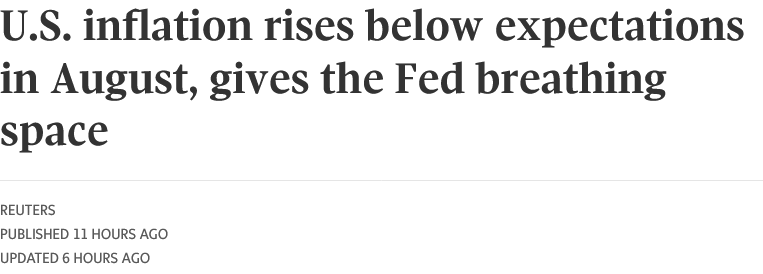
While no one should pretend that 3.4% year on year inflation is “good”, that we are not seeing higher inflation—higher headline inflation, higher energy inflation, higher core inflation—despite an attritional and now largely economic war with Iran is by any measure quite remarkable. If there is one thing besides causing mass casualties at which war excels it is causing consumer price inflation.
Certainly the “experts” were anticipating more inflation than has been recorded for August. When even the Cleveland Fed’s inflation nowcast overshoots the mark, there is indisputably less inflation pressure on the US economy than anyone has been wont to believe.
For Once, “No Change” Gets It Right
Very often, when we see “no change” in news releases for the US government’s economic data, we have to take it with a grain of salt—government economic data can at times vary wildly from reality.
However, for the August PCE Price Index year on year inflation, “no change” sums it up rather well. Headline inflation year on year ticked up by less than 0.1pp, while core inflation barely rose 0.02pp.
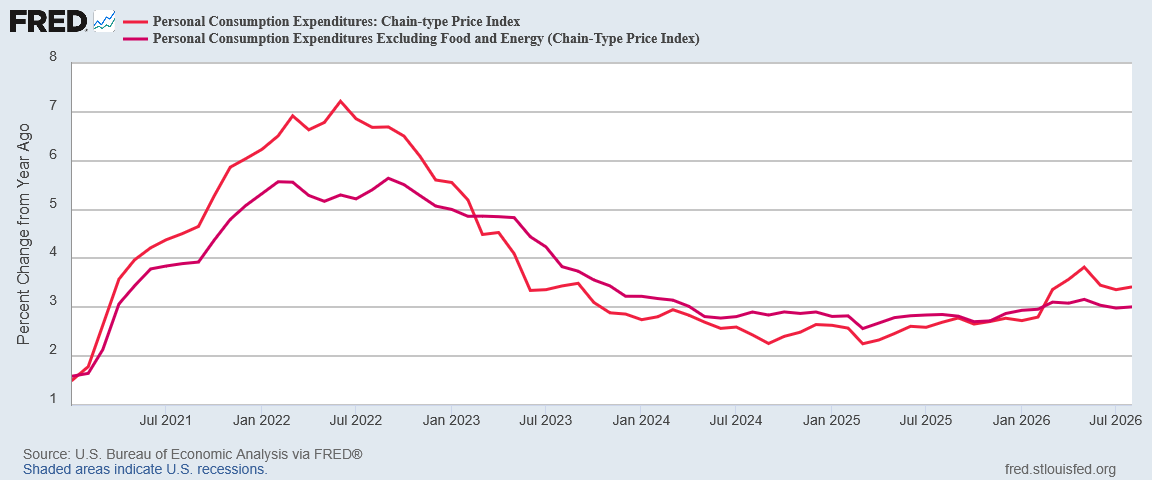
For the year on year metric, those are inflation changes that almost don’t register.
Where we did see inflation rise was in the month on month data.
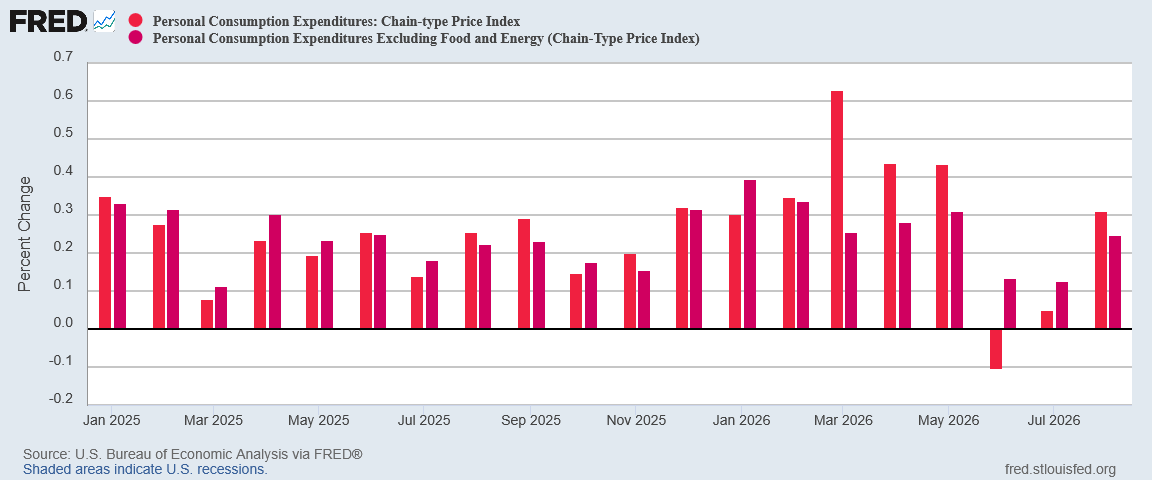
Yet even with inflation rising month on month, headline inflation was the 3rd lowest (2nd among months with positive inflation) for the year. August was core inflation’s 3rd lowest month as well. Overall, headline inflation per the PCEPI is still trending down from its March month on month peak.
We are seeing some inflationary pressure in the economy. We are not seeing a lot of inflationary pressure in the economy. For once, the realistic inflation assessment really is “no [real] change”.
Some Energy Inflation, Just Not A Lot
Energy inflation flipped from printing deflation for the past two months but still came in a little more than half the month on month inflation print from April or May, and well below the March surge into double digits.
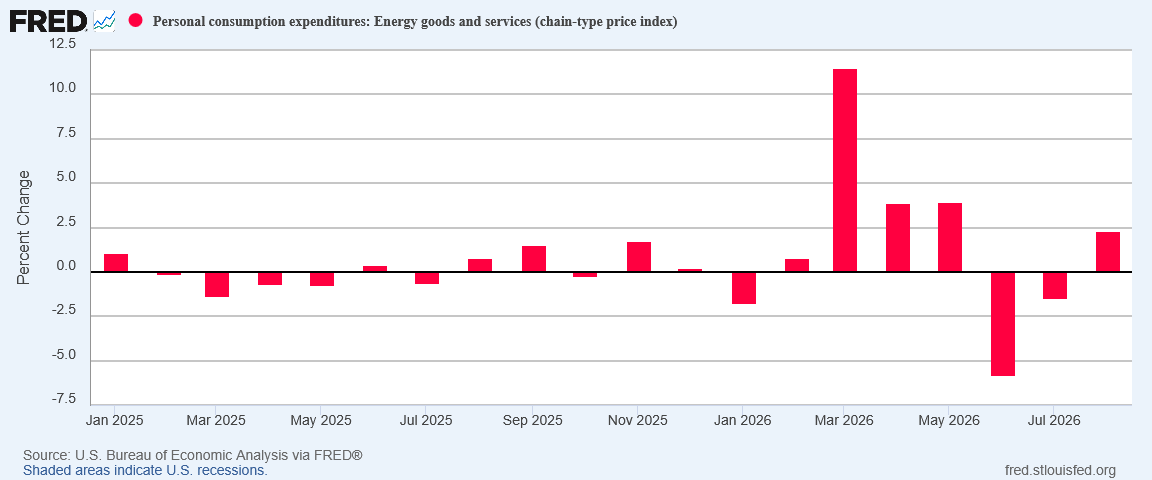
This in a month when oil, diesel, and gasoline rose approximately 12%-15%.
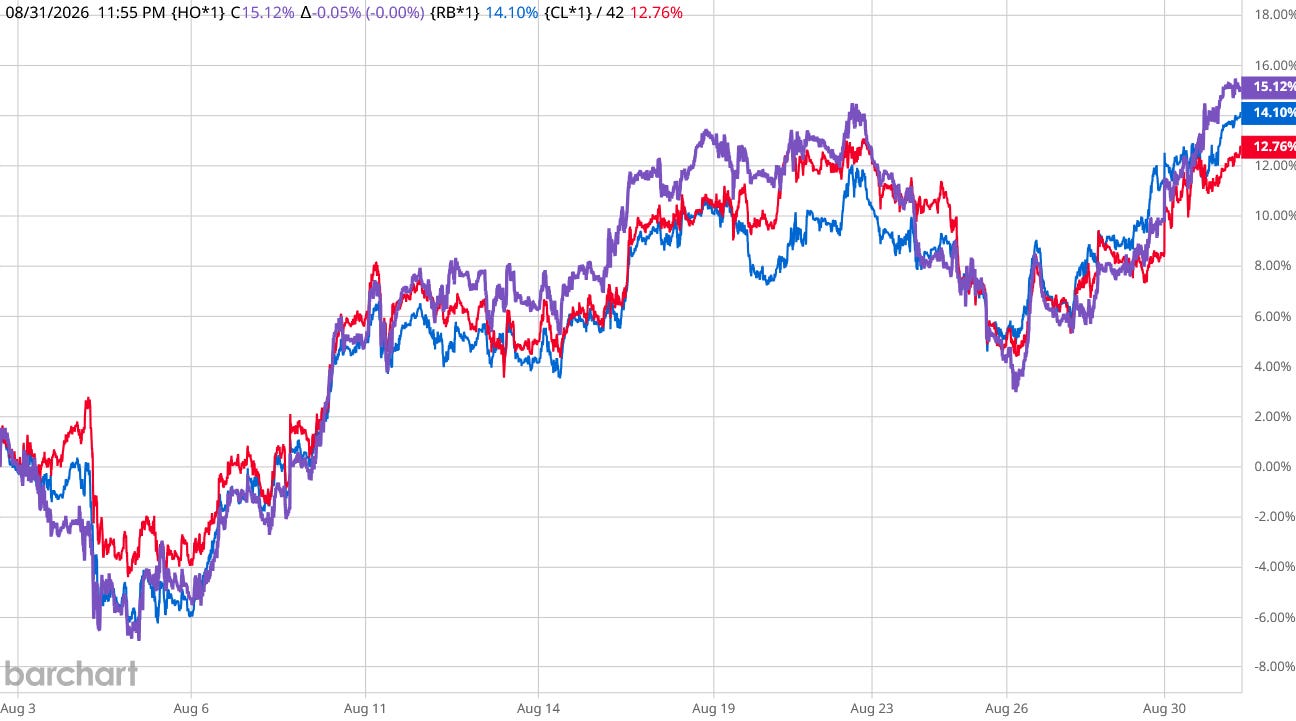
This in a month when diesel crack spreads rose by more than $10/bbl.
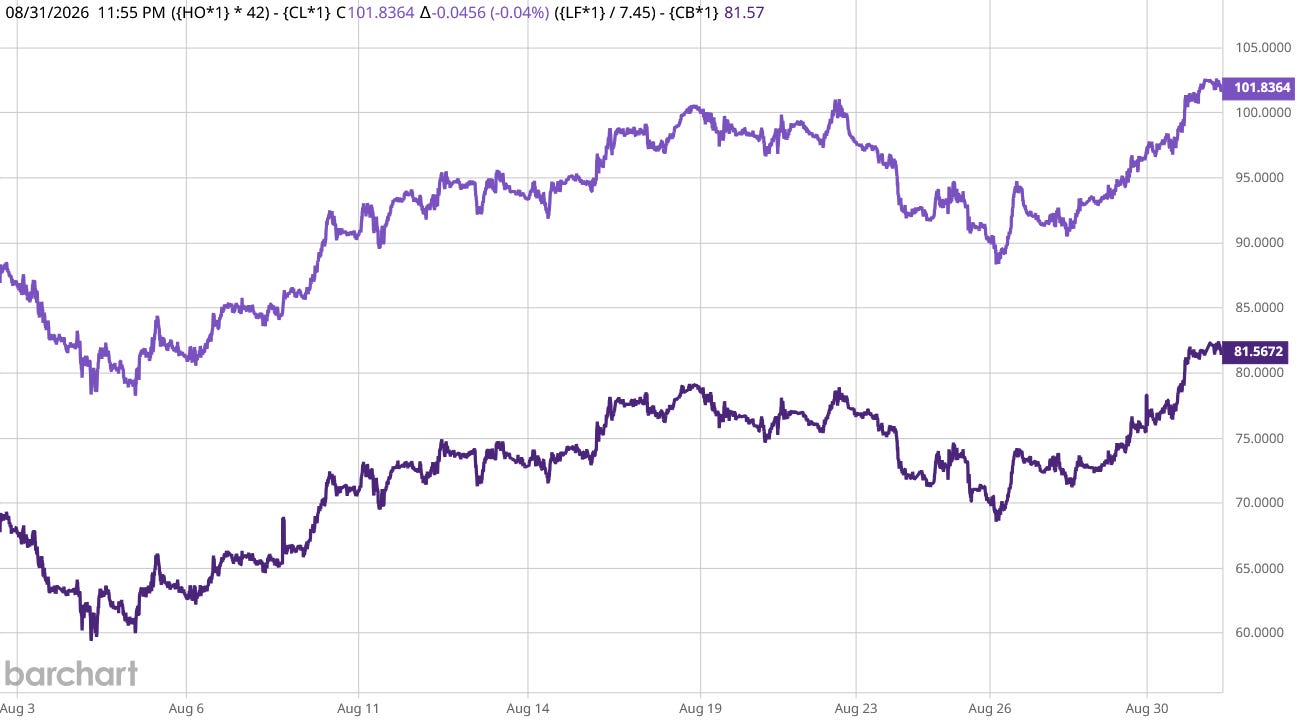
With these price drivers pushing energy prices up, it is not hard to fathom why Wall Street expected inflation to print higher than it did.
Food Price Inflation?
Outside of the months when food price inflation was negative, August printed the second lowest food price inflation metric since the start of President Trump’s second term of office.
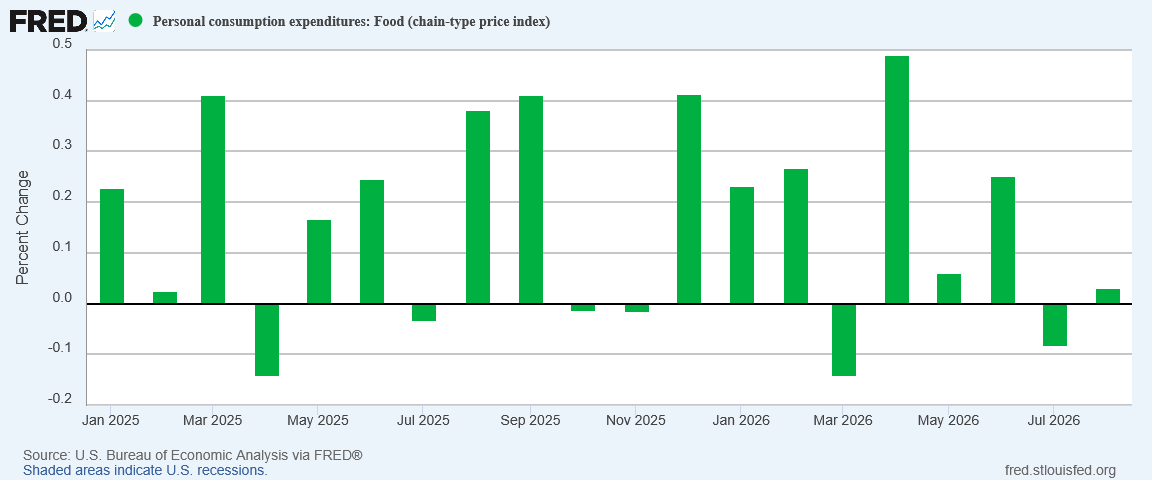
If we back out to the year on year level, food price inflation for August is below the Federal Reserve’s “Holy Grail” level of 2%.
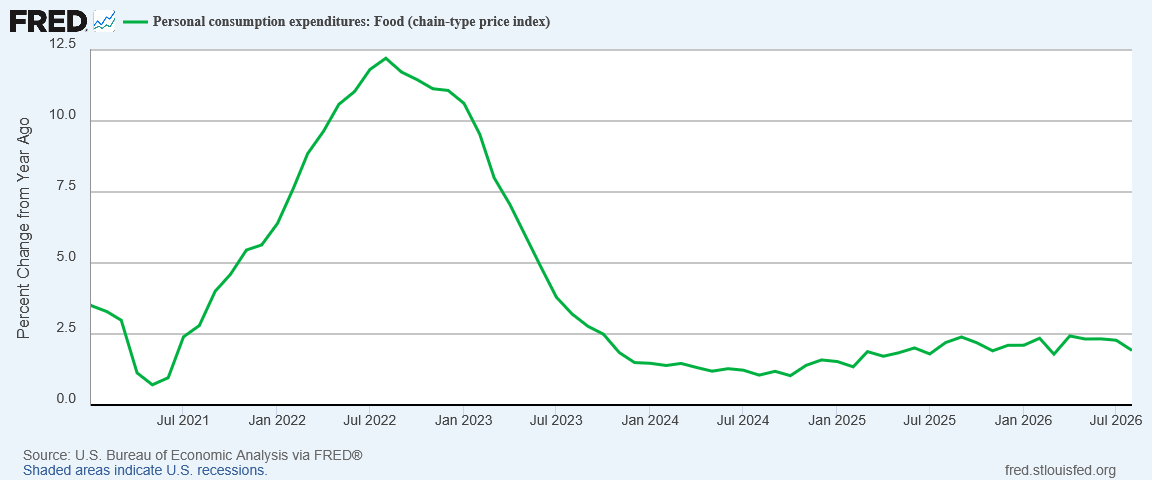
Compared to energy price inflation, food price inflation is practically nonexistent.
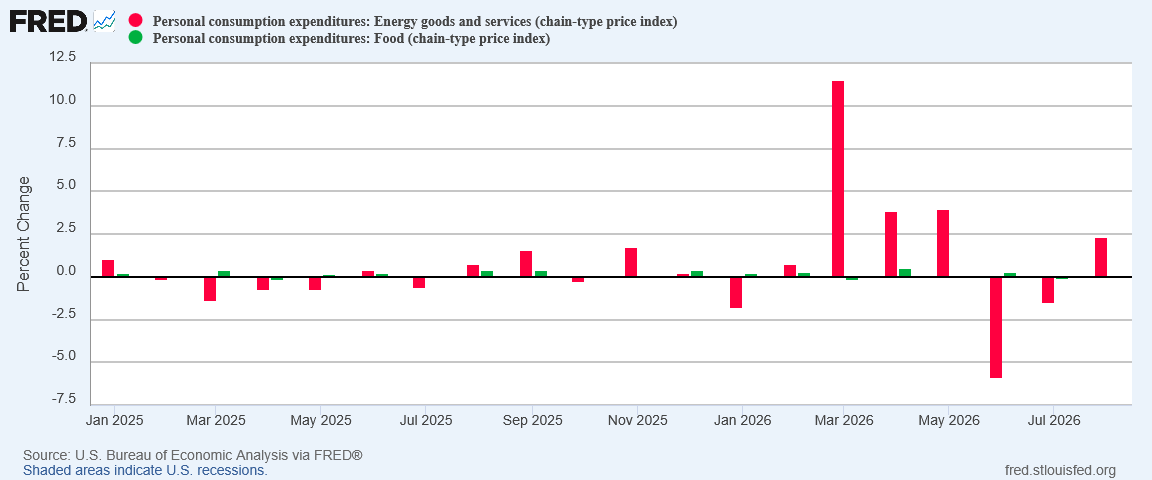
This is a point which deserves some emphasis.
One reason the Federal Reserve monkeys with the federal funds rate is to maintain “price stability.” By law, the Federal Reserve is supposed to conduct monetary policy with a view towards “stable prices.” Broadly speaking, “stable prices” means purchasing decisions are not influenced by the price today vs the price tomorrow.
Price stability exists when average prices are constant over time, or when they are rising at a very low and predictable rate.
At the moment, food prices are quite clearly “stable”. We are not seeing sudden or rapid swings in food prices. Changes in food prices are hard to even detect relative to changes in energy prices.
Even core inflation has been broadly predictable at 3% year on year for several months. We can say that 3% is higher than 2%, but, in the wake of the 2022 hyperinflation cycle, the data also says that 3% has become the long-term norm for core inflation—that makes it predictable and therefore stable.
Energy Inflation Is Still All The Inflation There Is
When we drill into core inflation, we immediately see that food prices are not the only stable prices in the US economy. Energy prices are where most consumer price inflation is occurring at present. We can see that just by comparing energy price inflation to nondurable goods and services.
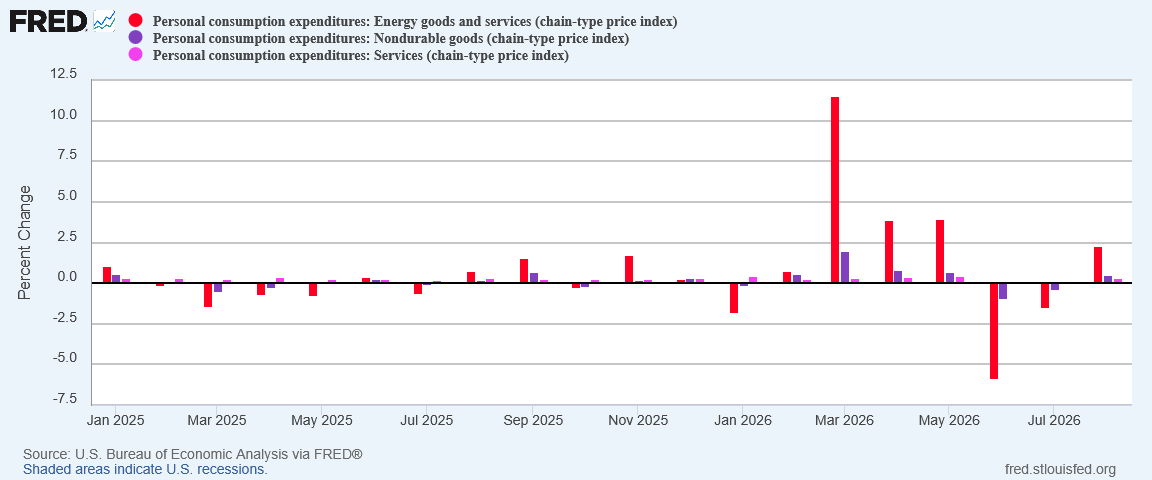
Energy prices, themselves a component of nondurable goods prices, account for the overwhelming majority of nondurable goods prices.
When we look at year on year inflation within nondurable goods and services prices, we can immediately see that, apart from energy, prices have been quite stable—service price inflation is hovering around 3.4%-3.5%, and nondurable goods price inflation has been reliably below 1.5%.
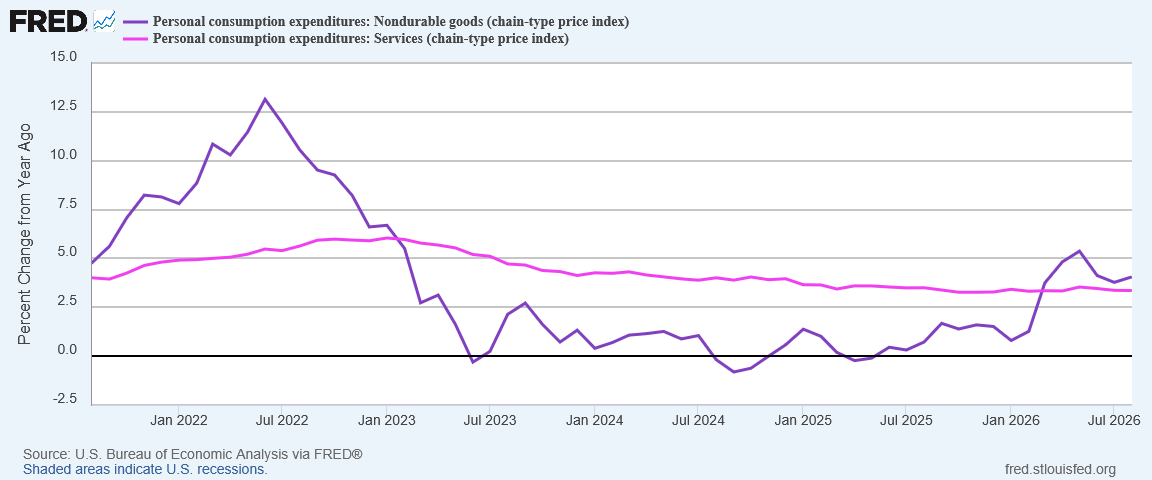
Remember, part of price stability is predictable rates of inflation. For services we are definitely seeing a predictable rate of inflation, and even nondurable goods are proving to be largely predictable outside of energy prices.
To underscore how little inflationary pressure we are seeing in the US economy at present, we do well to remember that real personal consumption expenditures have been increasing throughout the year.
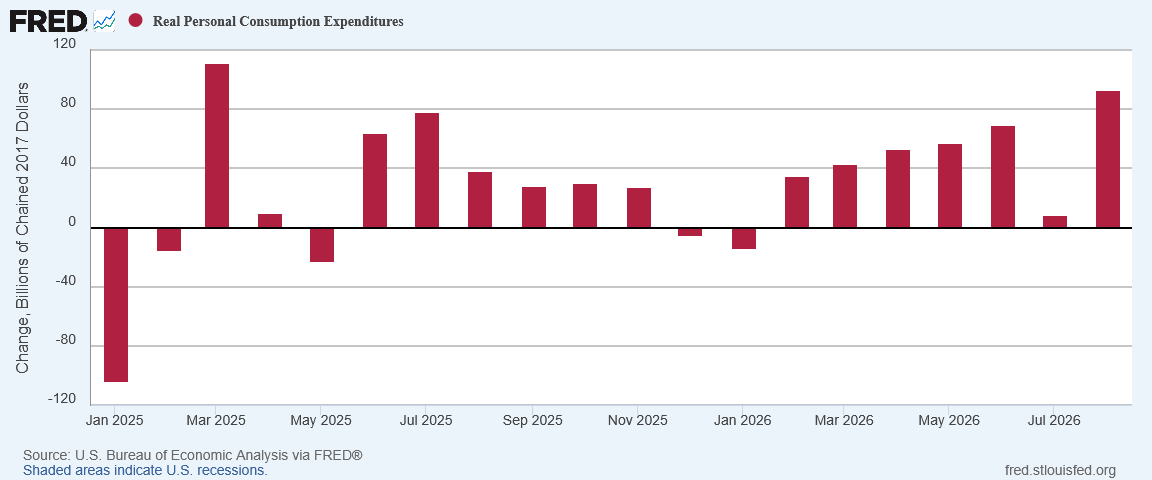
If prices were unstable, this steady increase in real consumption would have resulted in rising consumer price inflation across the board. We aren’t seeing that, and haven’t seen that.
Even the surge of real personal consumption expenditures while real personal incomes dropped on the month has not been sufficient to generate broad-based inflation.
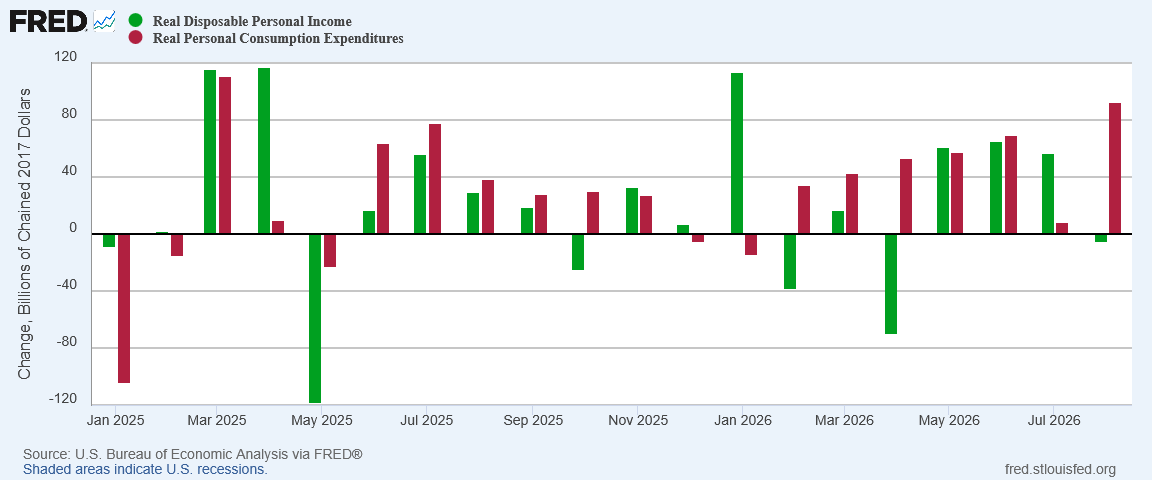
People are spending. People are buying things. People are not pushing up prices.
That is “price stability.”
Some Inflation, Just Not A Lot Of Inflation
While the headline month on month PCEPI inflation numbers show a marked increase in consumer price inflation, they do not show a big increase in consumer price inflation.
We have some inflation, and we are seeing some inflation increase, primarily energy price inflation. We do not have a lot of inflation, and even energy price inflation has been rising less rapidly than right after the beginning of Operation Epic Fury.
Despite the pearl clutching of CNN and other corporate media outlets, core PCEPI inflation has been hovering between 3% and 3.2% year on year since the start of the year. Even though 3% is above 2%, that core inflation remains within that range means people can reliably gauge prices for desired goods and services a week or a month from now—effectively removing the incentive and the pressure to buy now for fear of having to pay more next week or next month. 3% is higher than 2%, but it is no less predictable than 2%.
When price increases are not a material factor in purchasing decisions, by definition prices are stable. By that definition, we have had price stability for quite some time. By that definition, the Federal Reserve has no real reason to be raising the federal funds rate at all.
Corporate media almost concedes this last point. Remember, Reuters acknowledges that August’s low PCEPI inflation print removes a lot of pressure on the Fed to hike the federal funds rate at the end of next month. Price stability equates directly to a lack of pressure on the Fed to raise interest rates; if there is no pressure on the Fed to raise interest rates, prices must be stable.
Ultimately, the August Personal Income and Outlays report is a demonstration of price stability. The report gave us some inflation. The report did not give us a lot of inflation. The difference is the degree to which prices are stable.