Inflation Is Not Only Bad, Turns Out It's Been Even Worse
Is It Hyperinflation When Even The Fudge Factor Can't Save The Day?
Let's start with the obvious bad news: over the past twelve months aggregate consumer prices have risen by 7.5%. That is the highest level of inflation since February 1982.
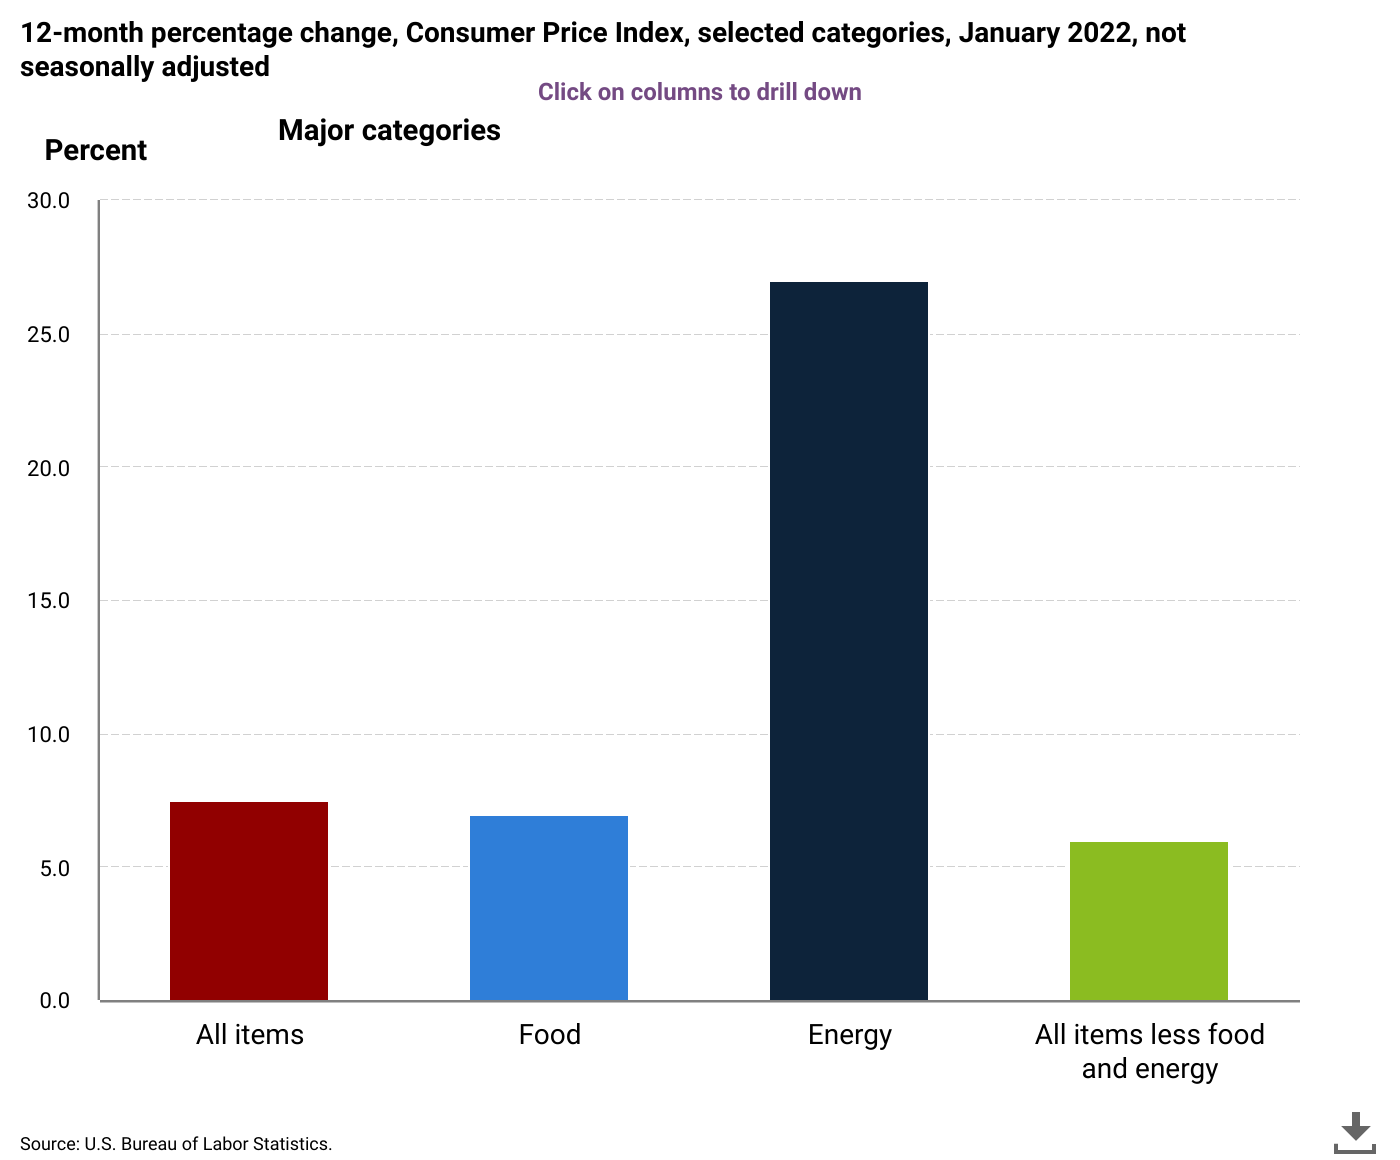
The all items index rose 7.5 percent for the 12 months ending January, the largest 12-month increase since the period ending February 1982. The all items less food and energy index rose 6.0 percent, the largest 12-month change since the period ending August 1982. The energy index rose 27.0 percent over the last year, and the food index increased 7.0 percent.
The “official” inflation rate is the worst in living memory for more than half of the population (going by census data)—and that is just the top level number.
As I pointed out last month, the real economic damage comes from the price distortions taking place within the CPI “basket” of goods and services.
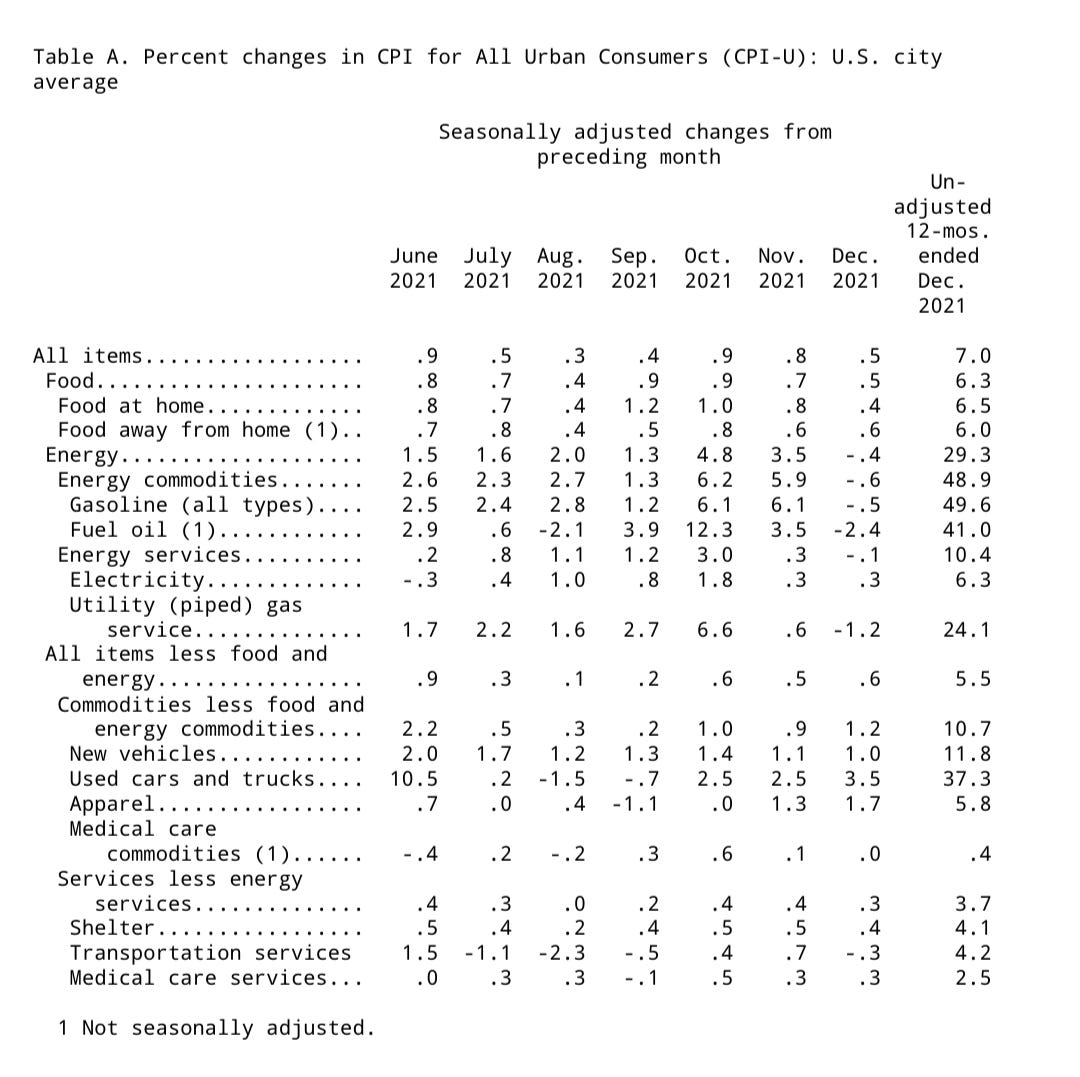
While food prices “only” rose 6.3%, energy prices rose overall by 29.3%—and gasoline rose by 49.6%—during the past year. Shelter prices “only” rose 4.1%, but new vehicles rose 11.8% and used vehicles rose 37.3%.
In January, the 12-month change in food prices was 7%, with energy prices rising 27%. Shelter costs 4.4% more than in January 2021, while new vehicles cost 12.2% more and used vehicles 40.5% more.
Not only are prices rising, but they are even more out of balance with each other than in December. The cost of a house or apartment is higher, but that incremental increase makes the even larger increase in vehicle prices—shelter and cars are among the purchases with the longest timelines—even more difficult to absorb for the average consumer. Higher food costs make the much higher energy costs that much more painful.
This is how inflation harms not just consumers but the economy as a whole. Inflation inhibits consumption not only of individual goods and services, but of the entire range of goods and services that consumers typically purchase. When consumption is constrained, economic damage occurs by definition, and while the “experts” will argue that low levels of inflation are good for am economy, it is my layman's opinion that such theorizing is charitably described as “horse hockey”.
No consumer benefits from paying more and buying less. No vendor benefits from reduced profits due to rising costs. No vendor can profit when no one can afford to buy. When no one benefits, no good can come. This is the inevitable outcome of inflation even at low levels; how much greater the pain when inflation is the highest in 40 years?
Oh, And Inflation Was Worse In December Than We Were Told
Adding insult to injury, what the BLS does not mention was that inflation was worse in December than officially reported. The “seasonal adjustment” for several CPI categories ratcheted inflation up in the current report than for the December report.
This is Table A from December:
This is the current report's Table A:
Last month gasoline prices presumably fell by half a percent; now it seems December gas prices rose by 1.3% (paging Lou Costello, your math skills are needed). Food prices didn't just rise by 0.5%, but 0.9%. New vehicles rose by 1.2% instead of 1%, and the aggregate monthly inflation rise was 0.6% instead of 0.5%.
If you were scratching your head last month sure that prices were higher than what was reported, it wasn't you. Prices were higher in December than officially reported for December.
Whether the shift in November inflation from 0.8% to 0.7% represents a true seasonal correction and not an effort by the BLS to “smooth out” an inflation spike I leave to the reader to decide.
On Seasonal Adjustments
A little discussion about the seasonal adjustment process is in order. Seasonality is a valid statistical phenomenon and it is something that should be addressed in analyzing any time series of numbers.
The Christmas shopping season represents a significant spike in retail sales, for example, but this is largely due to the nature of the holiday season and not to any underlying economic shift. At every level of prosperity Christmas sales tend to be higher than at other times of the year, and determining how much increase is due to that seasonal influence versus how much is due to a changing level of consumer prosperity is the question a seasonal adjustment calculation attempts to address.
Other seasonal variances that are well known are found in both Christmas and summertime employment as well as in gasoline prices. Adjusting the raw data to compensate for known seasonal fluctuations is both statistically valid and analytically appropriate.
But assessing seasonal fluctuations is primarily an historical exercise, with rises and falls being assessed based on historical data. The BLS revises the previous 5 years of data based on the seasonal adjustment process performed each February.
The Consumer Price Index (CPI) produces both unadjusted and seasonally adjusted data. Seasonally adjusted data are computed using seasonal factors derived by the X-13ARIMA-SEATS seasonal adjustment method. These factors are updated each February, and the new factors are used to revise the previous 5 years of seasonally adjusted data. The factors are available at www.bls.gov/cpi/tables/seasonal-adjustment/seasonal-factors-2022.xlsx. For more information on data revision scheduling, please see the Factsheet on Seasonal Adjustment at www.bls.gov/cpi/seasonal-adjustment/questions-and-answers.htm and the Timeline of Seasonal Adjustment Methodological Changes at www.bls.gov/cpi/seasonal-adjustment/timeline-seasonal-adjustment-methodology-changes.htm.
X-13ARIMA-SEATS is a statistical software toolset written in the R programming language that is maintained by the US Census Bureau. The software itself is freely available for download, and can be used by anyone
However, this raises a procedural question: why are the impacts of the seasonal adjustment process not more fully disclosed in the February report? Consider what is said about energy price inflation in this month's report:
The energy index increased 0.9 percent in January. The electricity index rose sharply in January, increasing 4.2 percent. The gasoline index fell 0.8 percent in January after rising rapidly in the autumn of 2021. (Before seasonal adjustment, gasoline prices rose 0.1 percent in January.) The index for natural gas also declined in January, falling 0.5 percent after declining 0.3 percent in December.
The energy index rose 27.0 percent over the past 12 months with all major energy component indexes increasing. The gasoline index rose 40.0 percent over the last year, despite declining in January. The index for natural gas rose 23.9 percent over the last 12 months, and the index for electricity rose 10.7 percent.
The decline in the gasoline index occurs because gasoline prices actually rose in December, although the original December report indicated a decline. While seasonal adjustments are valid conceptually, when they produce material changes in the adjusted historical data, some explanation is necessary if we are to have confidence in the adjusted data.
These seasonal adjustments do not prove the data is improperly manipulated, but the ambiguity about the adjustments and their effects raise legitimate questions about data integrity. Uncertainty is its own taint.
Inflation Is Not Merely Bad, It's Getting Worse At Every Turn
While questions about the detail numbers are essential to establishing the overall data quality for this month's report as well as last month's, in broad strokes with or without seasonal adjustments, one reality that is certain is that inflation is still bad and still getting worse.
Things are getting more expensive, and wages are not rising to match. As the bar chart at the top shows, food and energy costs are rising rapidly even relative to other goods and services. People are paying a whole lot more and buying a whole lot less.
Moreover, if history is any guide, St Louis Fed President James Bullard's call for a full percentage point rate hike during the first half this year, while notionally hawkish, is not nearly hawkish enough.
Federal Reserve Bank of St. Louis President James Bullard said he supports raising interest rates by a full percentage point by the start of July -- including the first half-point hike since 2000 -- in response to the hottest inflation in four decades.
As I have discussed previously, the last time the Federal Reserve faced inflation at this level it raised rates to 20%. Against that backdrop, talk of a single percentage point increase in interest rates is weak sauce.
Yes, an interest rate rise of 10% or more would produce a significant contraction in the economy. To be blunt, that's the point. Ending inflation requires a full disruption of money creation via fractional reserve lending. The cost of money has to be at least as great as the cost of everything else. A consequence of raising the cost of money is business and economic expansion is also disrupted. Fighting inflation means a recession. That is the lesson of Volcker’s war on inflation.
Is the cure worse than the disease? That's a fair question, and one I will not attempt to answer. It's a political question, which means it needs to discussed and debated honestly and openly. If the country is to endure a deliberate recession people deserve to know that up front.
But an honest debate over inflation and how to correct it can never happen when the public is fed massaged numbers that soft pedal how bad inflation really is.


"Is the cure worse than the disease?"
To the FedGov, at this point, I expect it is. Paying 10% interest on $30T in debt would cost $3T per year. The FedGov only took in $3.8T in taxes last year. Then there are all the massively over-leveraged corporations out there. 10% interest rates wouldn't produce a "recession". They would produce a depression that would make the one 90 years ago look like a minor blip.