


After the July CPI and PPI disinflationary prints earlier this month, there not much which is surprising about the July Personal Incomes and Outlays report from the Bureau of Economic Analysis. The disinflationary trends noted previously were sustained in the Personal Consumption Expenditures Price Index (PCEPI) data.
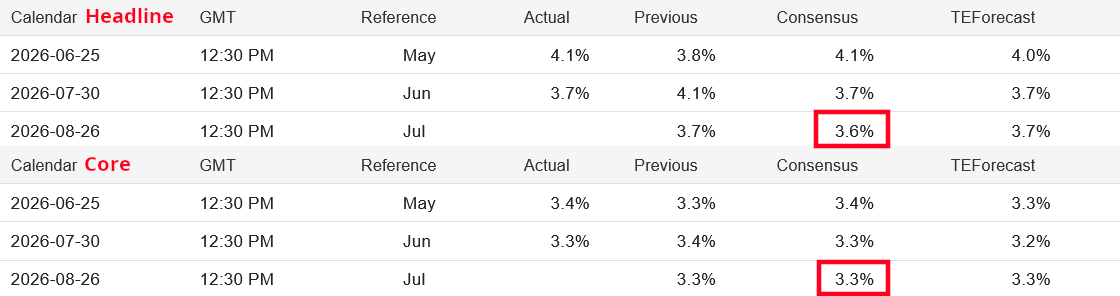
From the preceding month, the PCE price index for July increased 0.2 percent. Excluding food and energy, the PCE price index also increased 0.2 percent.
From the same month one year ago, the PCE price index for July increased 3.7 percent. Excluding food and energy, the PCE price index increased 3.3 percent from one year ago.
Wall Street was not at all surprised by these numbers, as they were right in line with what had been projected.
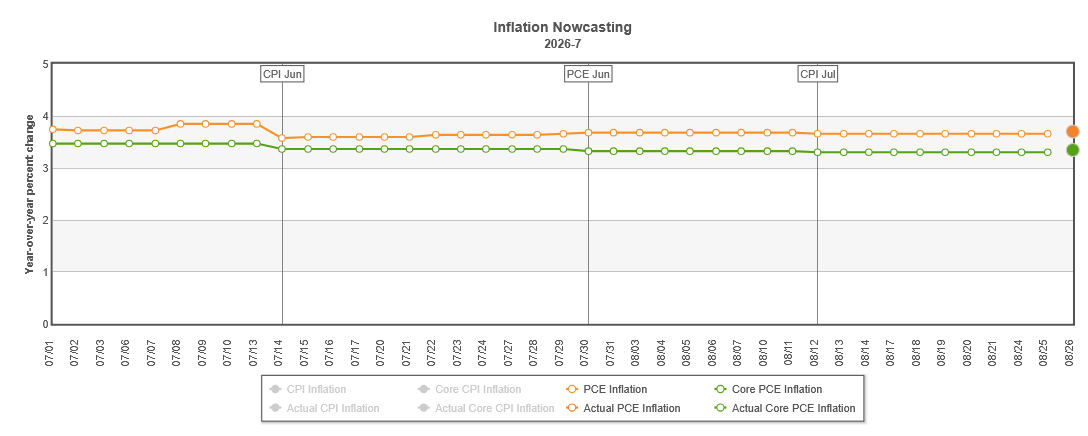
The PCEPI print was also right in line with the Cleveland Fed’s inflation nowcast.
In spite of an ongoing war with Iran, in spite of continued constrained oil production in the Persian Gulf, in spite of Iran’s illegal closure of the Strait of Hormuz, once again we are not seeing a lot of new inflationary pressures in the US economy. Three reasons why we should be seeing considerable inflation, and instead the trend of recent months has been disinflation.
Where is the inflation? Where is it hiding, and why aren’t we seeing more of it?
Is this a sign of the US economy’s underlying resilience and robustness, or is this a sign of lurking deflation and a looming recession instead?
Year On Year Inflation Held Constant
The one remarkable aspect of the year on year headline inflation metric from the PCEPI was that it remained constant: consumer price inflation in the PCEPI was 3.7% year on year in June, and it is 3.7% year on year in July.
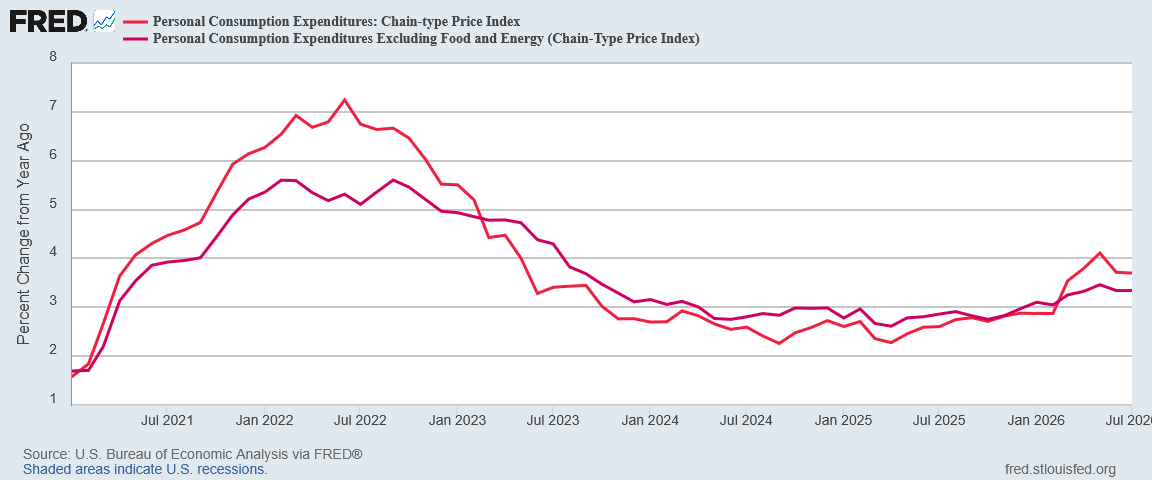
Month on month, inflation did move somewhat higher, with core inflation outpacing the headline figure.
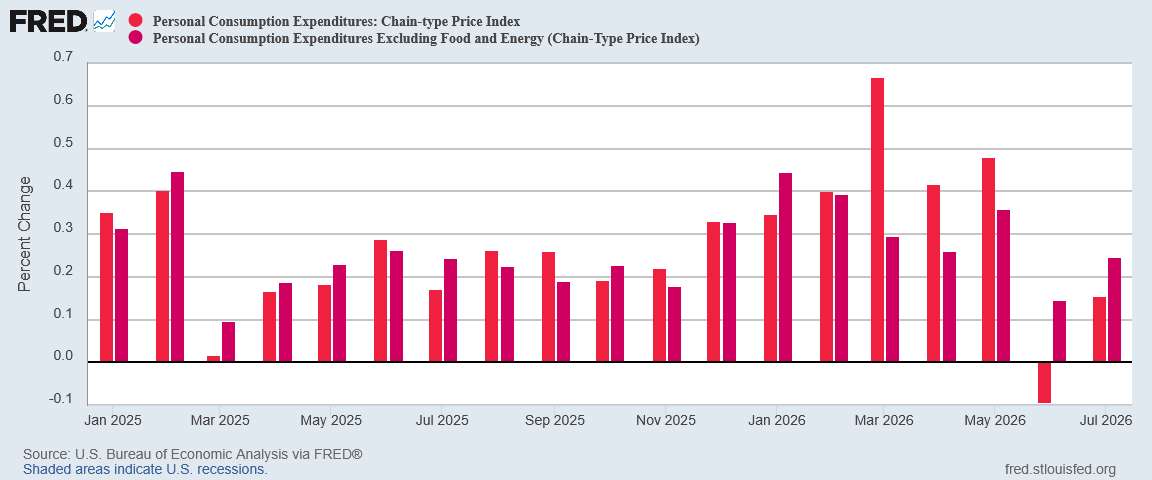
While month on month inflation did move higher, at 0.25% core inflation’s rise was the second smallest month on month change all year. At 0.15%, headline inflation turned in the smallest increase all year, and the second smallest increase since January 2025 (note that June’s headline PCEPI print month on month was negative).
We only have to consider the pace of inflation’s rise month on month in 2021 and 2022 for perspective.
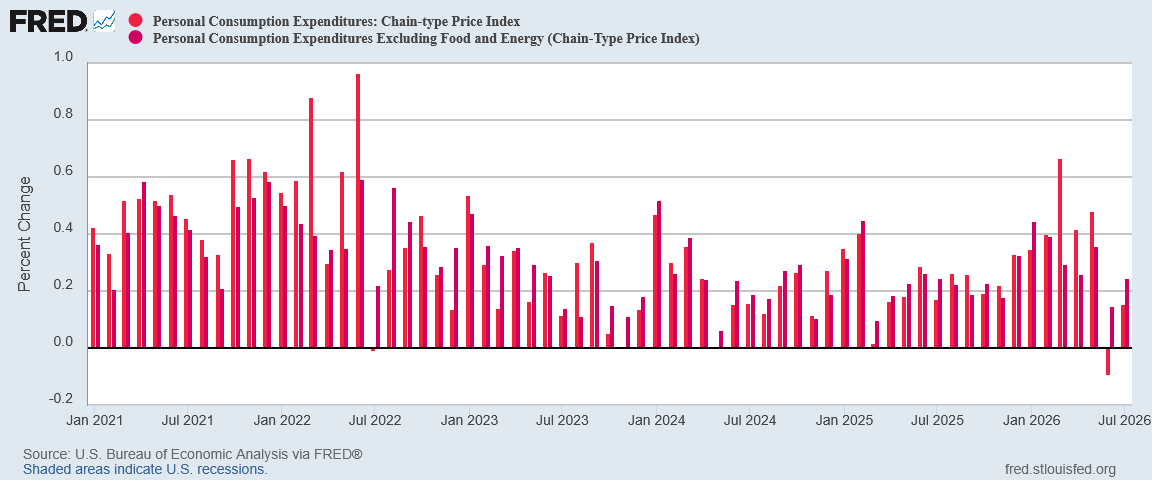
July’s increase was just not all that large compared to recent history.
Corporate media might gripe that inflation is not trending back towards the Fed’s Holy Grail of 2% year on year, but the reality of the inflation data is that consumer price inflation is not trending up either.
Energy Price Deflation?
As was the case in the CPI, the energy price inflation data in the PCEPI raises the eyebrows for July: for the second month in a row, there was energy price deflation.
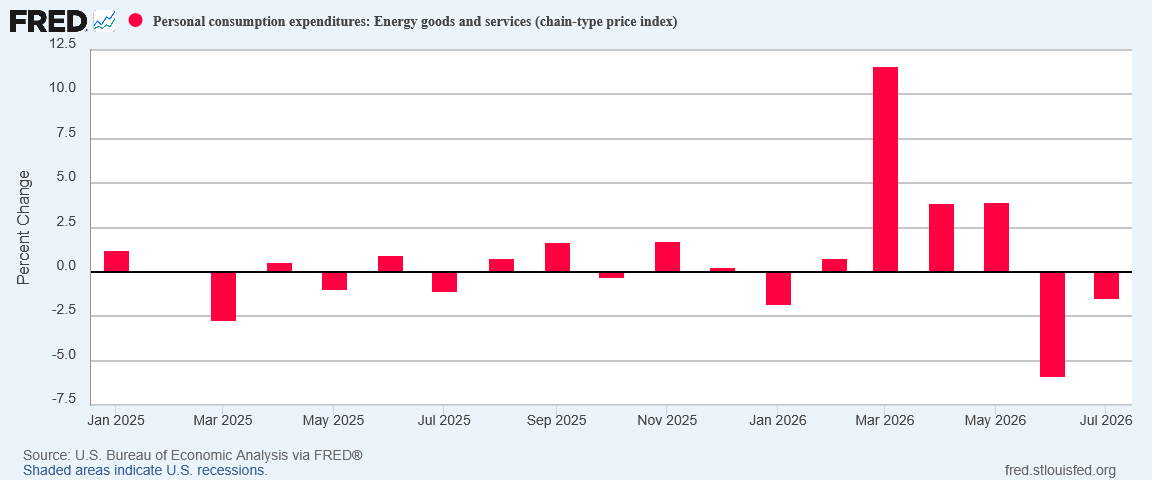
For the second month in a row, we have to question the data, because the market data absolutely show energy prices rising throughout July.
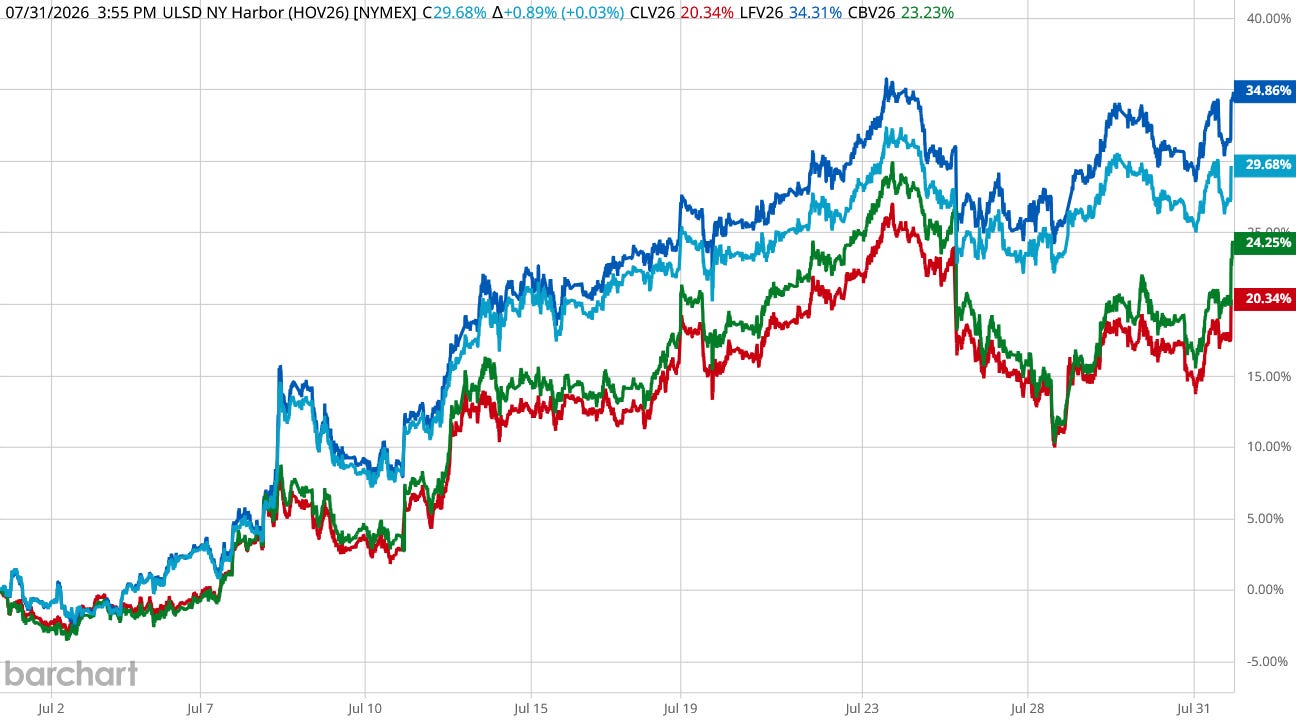
Oil futures rose significantly in the month of July, by as much as 20% for West Texas Intermediate and 25% for Brent Crude.
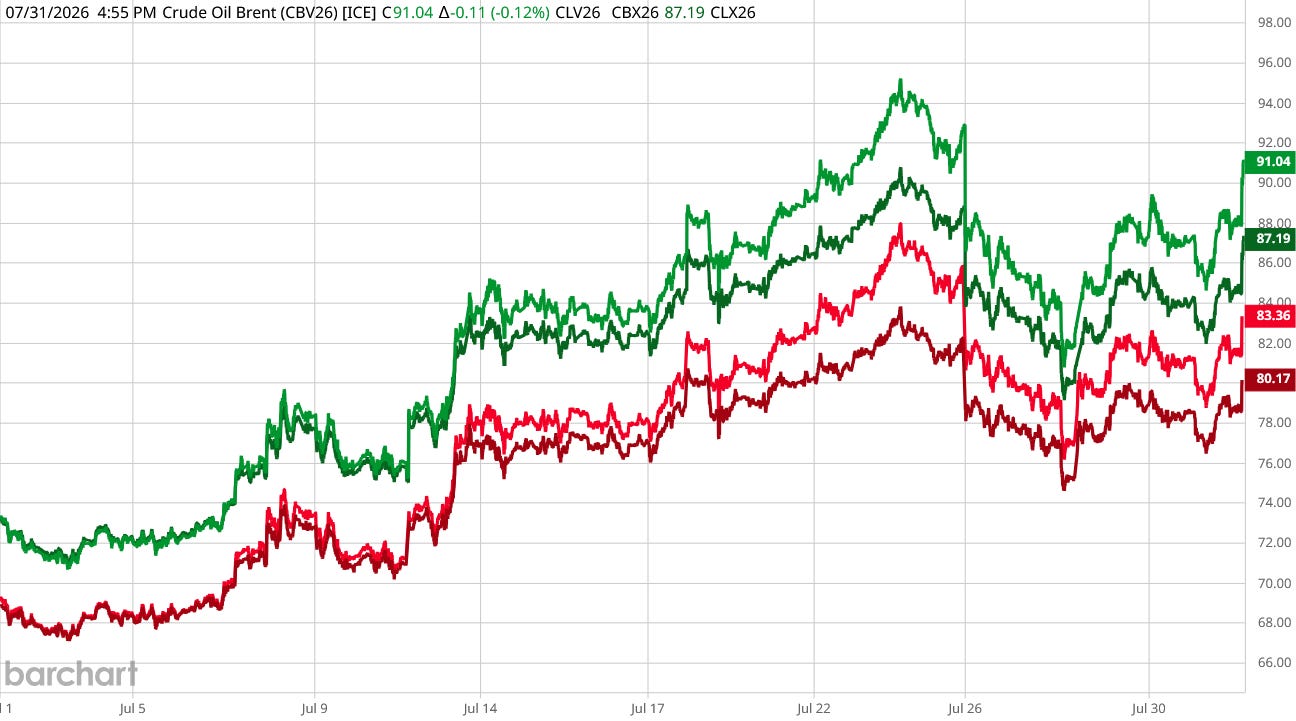
Diesel futures rose nearly 30% here in the United States, and nearly 35% in Europe.
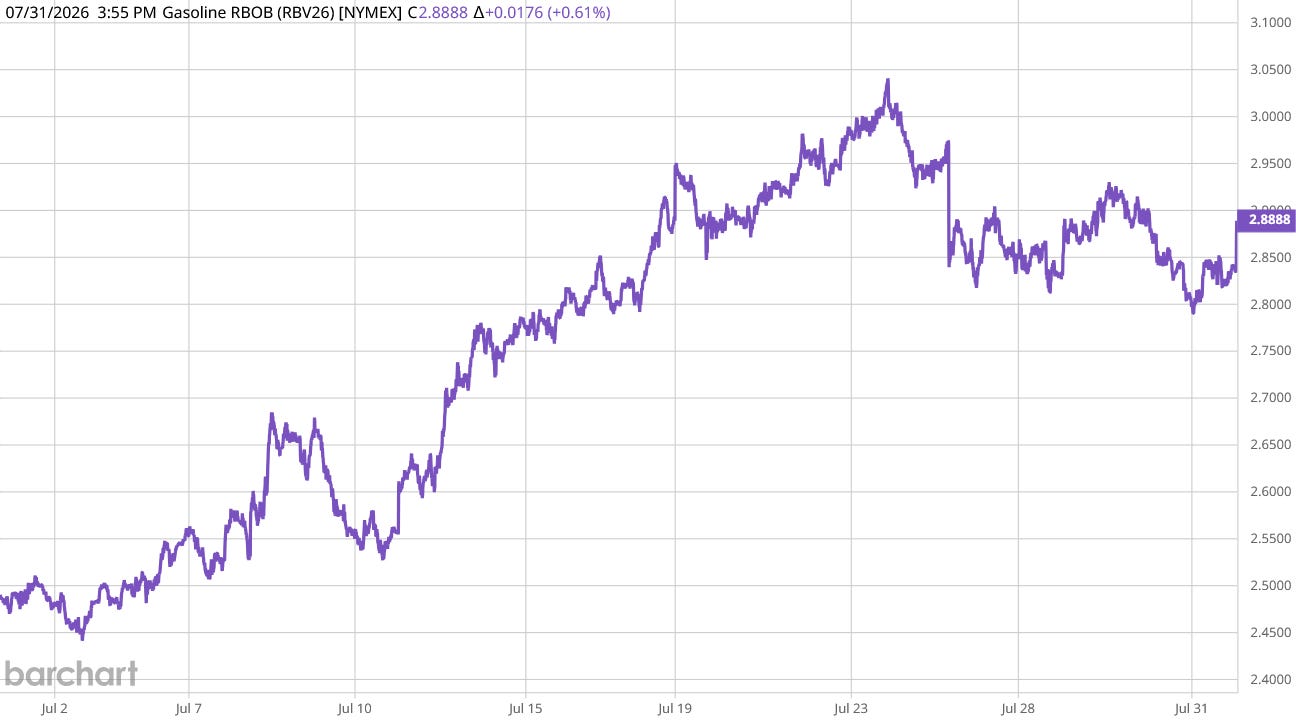
Even RBOB reformulated gasoline futures rose significantly in July.
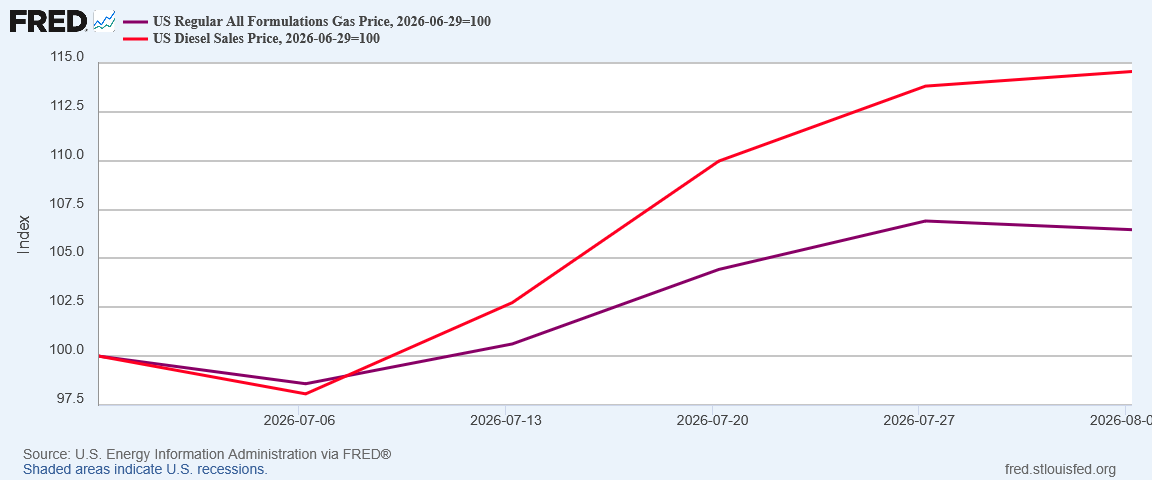
Pump prices for diesel were up 15% in July, with pump prices for gasoline up 7%, according to the Energy Information Administration.
At every turn, we see signs of rising energy prices, yet somehow the BEA computed energy price deflation for July? That seems unlikely, yet the BEA—just like the BLS—managed to compute exactly that.
Food Price Deflation
Food prices came down in July, according to the PCEPI, a welcome shift from June food price inflation.
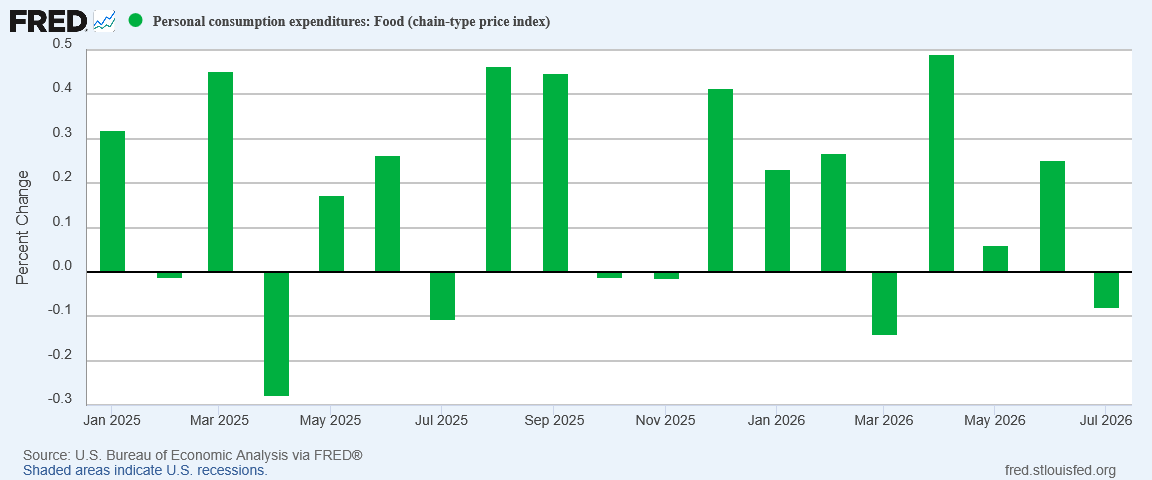
Food prices are typically more volatile than most consumer price data, which is, as readers will recall, why the BEA and the BLS break out food and energy data separately. Even so, food prices have dropped month on month seven times since January 2025.
If we step back to the year on year inflation metric, we see that food price inflation has been largely holding steady for the past year.
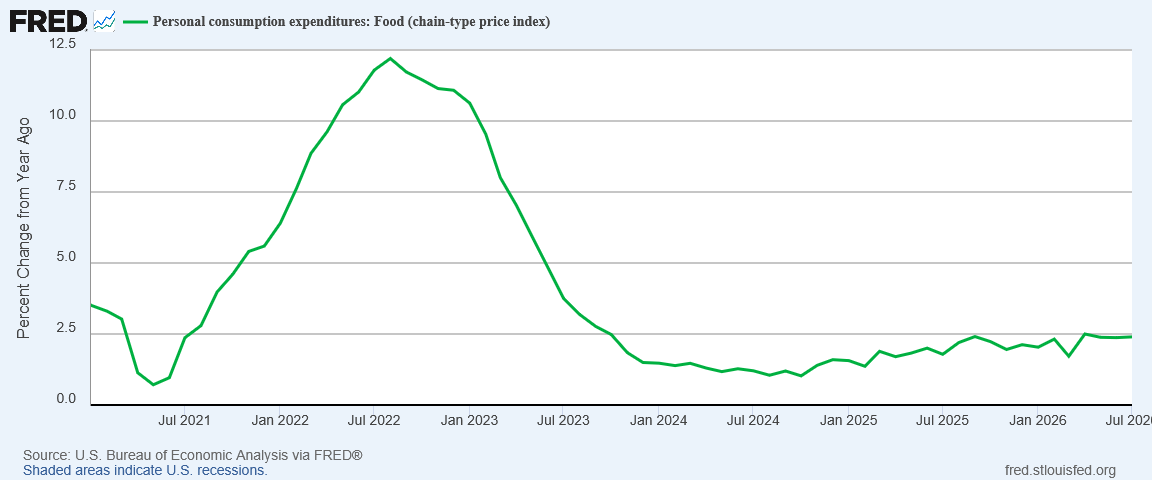
An important note of caution is appropriate: the PCEPI food index is a broad national index. If we look at some food items such as ground beef, we see that prices have risen at a faster pace than overall food inflation.
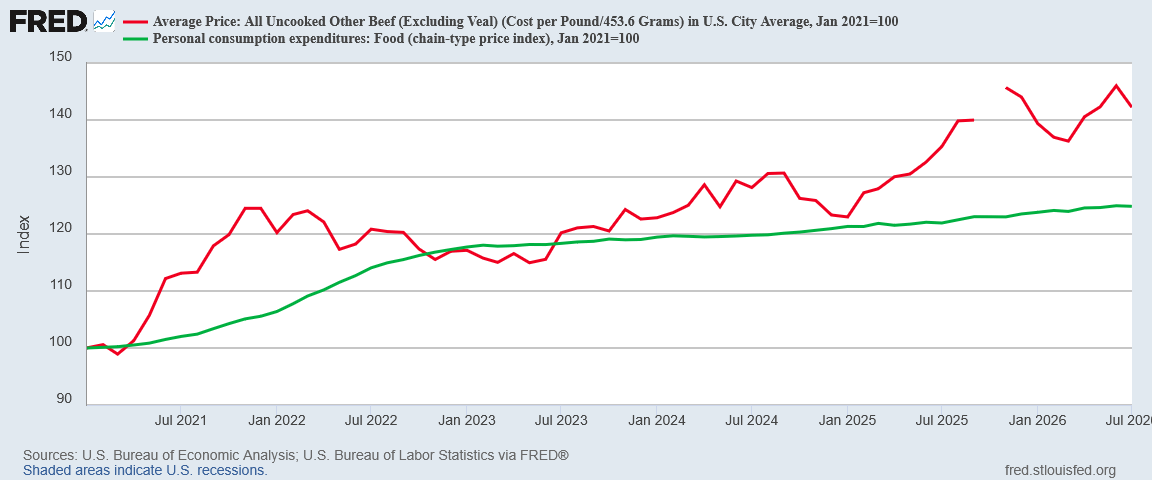
Prices vary region to region in the United States. When it comes to inflation data, the constant caveat will always be “your mileage will vary”.
Aside from the obvious variances, however, across the broad array of food items in the index and across the whole of the country, year on year there has not been much change within food price inflation.
Goods And Services Mixed
Goods and service prices gave mixed results for July month on month, with durable goods price inflation rising, nondurable goods price inflation falling, and service price inflation rising for the second month in a row.
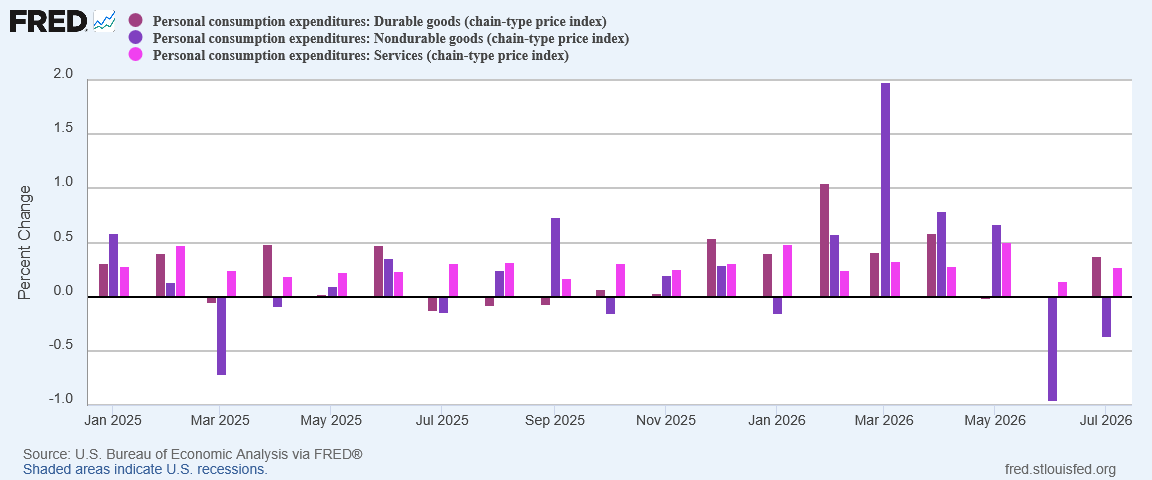
If we zoom out to view these subindices year on year, we still get mixed price signals.
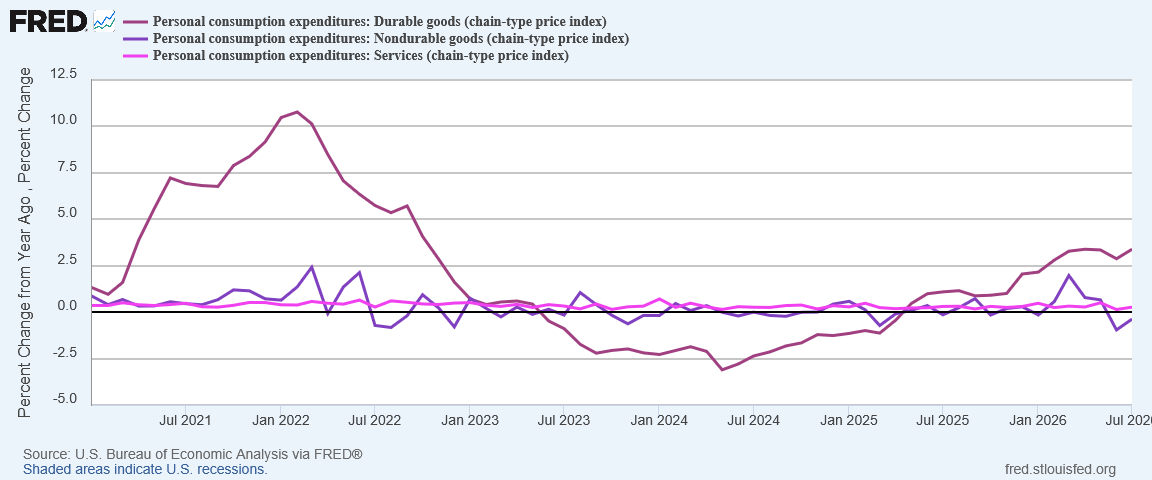
Durable goods price inflation has been trending up year on year, but it is the only area in the PCEPI where that is the case.
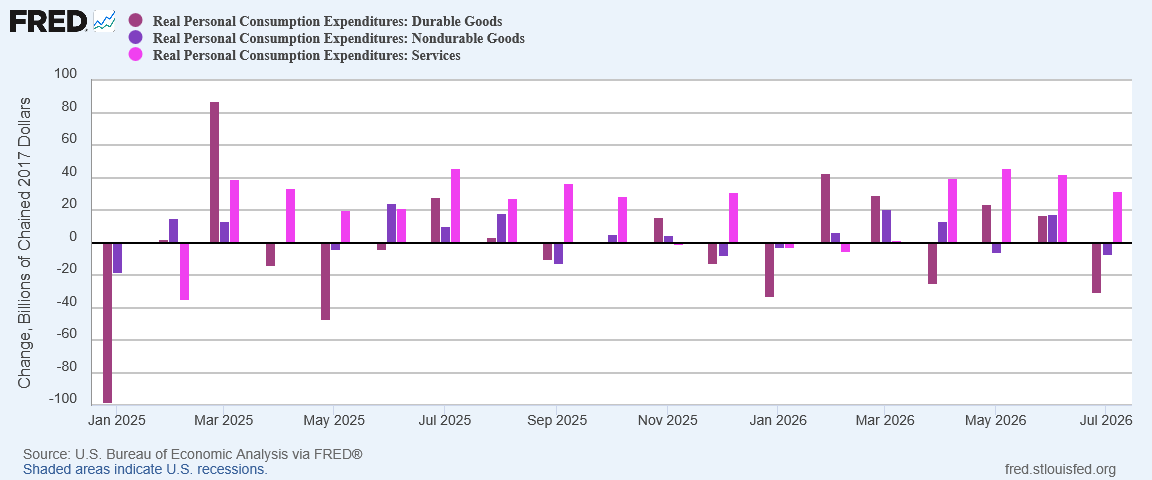
When we look at real consumption month on month in these sectors, we again do not see much in the way of inflationary pressure. Real personal consumption for durable goods declined significantly in July, with consumption for non-durable goods declining somewhat less so.
In another sign that inflationary pressures are not rising in the economy, for the first time since the start of the year real disposable income rose month on month faster than real personal consumption expenditures.
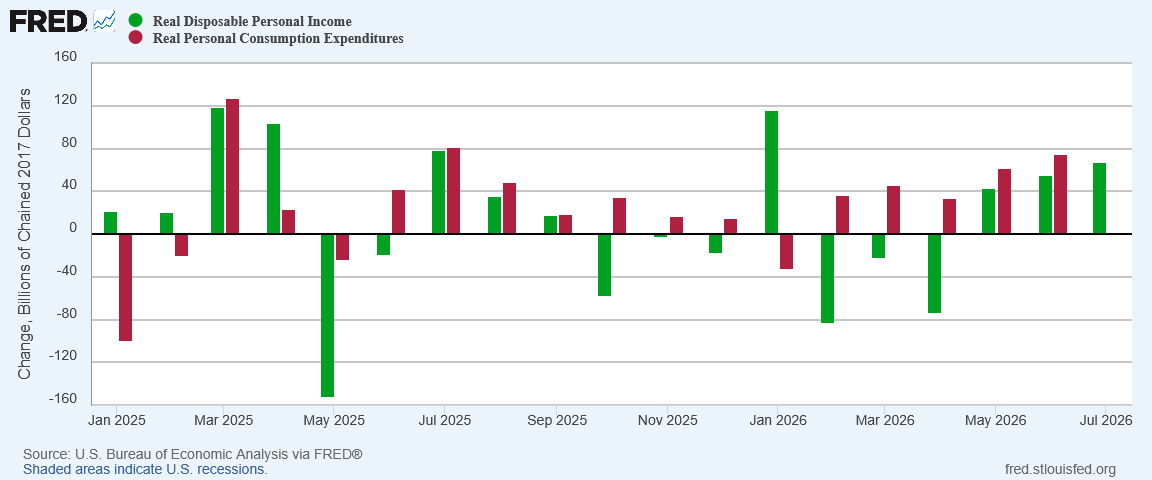
July turned out to be a savings month.
CNN took that savings figure and decided consumers were pulling back on spending because of inflation.
Consumer spending, when adjusted for inflation, was flat from the month prior, a sharp slowdown from a 0.4% gain in June, according to the report.
The Personal Consumption Expenditures price index – the gauge used by the Federal Reserve for its 2% target inflation rate – rose 0.2% from June, keeping the annual rate at 3.7%, the report showed.
Yet July was not the first time that goods spending dropped, and service spending rose month on month.
Certainly consumers are spending less in some categories, but they are spending more in others. What was different in July was that real personal disposable income rose significantly, but real personal consumption expenditures were largely unchanged for the month.
Where Are The Effects Of War?
The biggest question mark in the PCEPI data for July remains the data we are not seeing.
War with Iran is continuing, and while actual hostilities are, for the moment, de-escalating, the US is still keeping a substantial military presence in the Middle East. Oil production among Persian Gulf states has yet to return to pre-war levels, with only the United Arab Emirates producing more oil now than before the war.
We see the impacts of the war in futures markets, and in pump prices for both gas and diesel—but we do not see those impacts translating through to the PCEPI, just as we are not seeing those impacts translating through to the CPI either.
As a general rule, war is an inflationary proposition. War means governments at a minimum increase their purchases of whatever goods and services within the economy that governments need to prosecute a war effort. Increased government spending will, in short order, push consumer price inflation up.
The nature of war is to increase inflation, yet the nature of the war with Iran is that it is not pushing consumer price inflation.
The war with Iran has reduced total oil production in the Persian Gulf, which means even with the US providing convoy escorts to restore normal shipping volumes in the Strait of Hormuz global oil supply is still reduced, and the price of oil did rise throughout July. The price of diesel and gasoline rose even more. Pump prices rose as well.
Yet energy price inflation not only did not rise, it actually fell.
If the normal inflationary effects of war are not showing up in the official data, we must start to ask what could be offsetting those inevitable inflationary effects?
What is pulling prices down to keep war from pushing prices up? What energy prices are falling that rising diesel, gasoline, and crude oil prices are not translating into energy price inflation?
That is the risk the lack of significant inflation increase in the current data poses. We have clear evidences of rising energy prices, both among commodities and among retail prices at the pump. Somehow, those are being buffered enough that the overall energy subindex is still printing deflation.
In the oilpocalypse scenario for the economy, those buffers get exhausted, at which point constrained oil supply pushes a second wave of oil price shock across the world’s economies, resulting in synchronized stagflation.
If the conflict in the Persian Gulf simply dwindles, and some semblance of normal returns to the region, those buffers, rather than becoming exhausted, have the potential metastasize into a synchronized deflation for the world’s economies.
The July Personal Income and Outlays report failed to show the increase in consumer price inflation common sense and the usual patterns of war tell us should be happening. That’s a warning sign, although there is no way to tell at the moment whether that’s a warning of imminent stagflation or imminent deflation.
Welcome to interesting times!
It is always so impressive that you can see these warning signs before everyone else, Magnificent Man. I highly value your insights and wisdom!
Best case scenario is that everything holds together until the midterm elections. Voters will feel that hey, things aren’t so bad under Trump, so let’s not vote for the socialist extremists. If the Democrats do win a majority in the House and the Senate, and then we fall into stagflation, voters will blame the lousy economy on the Left, and Republicans will benefit in 2028.
Assuming, that is, we have a relatively normal economy in 2028, and have not fallen into Great Depression 2!