To say that the Philadelphia Fed took the BLS to the woodshed over its appallingly inaccurate Employment Situation reports for the second quarter of the year would be something of an understatement.
By eliminating over 1 million created jobs from the BLS reports with just a few sentences, the Philadelphia Fed put the BLS in quite the embarrassing position.
In those same few sentences, the Philadelphia Fed undid the robust job growth narrative that has been part and parcel of government pronouncements on the economy ever since the second quarter.
Unsurprisingly, politicians such as Florida’s Senator Rick Scott were quick to virtue signal over the BLS error.
Senator Scott is likely to be disappointed in the answer, however, for an understanding of how the Employment Situation summary reports for the second quarter missed the signals the Philadelphia Fed saw is considerably more mundane and bureaucratic than it is salacious and scandalous. The data has always undercut the job growth narrative, if only the BLS paused to look at it.
To understand how the BLS missed the jobs mark by such a wide margin, we first have to understand the structure of the Employment Situation Summary.
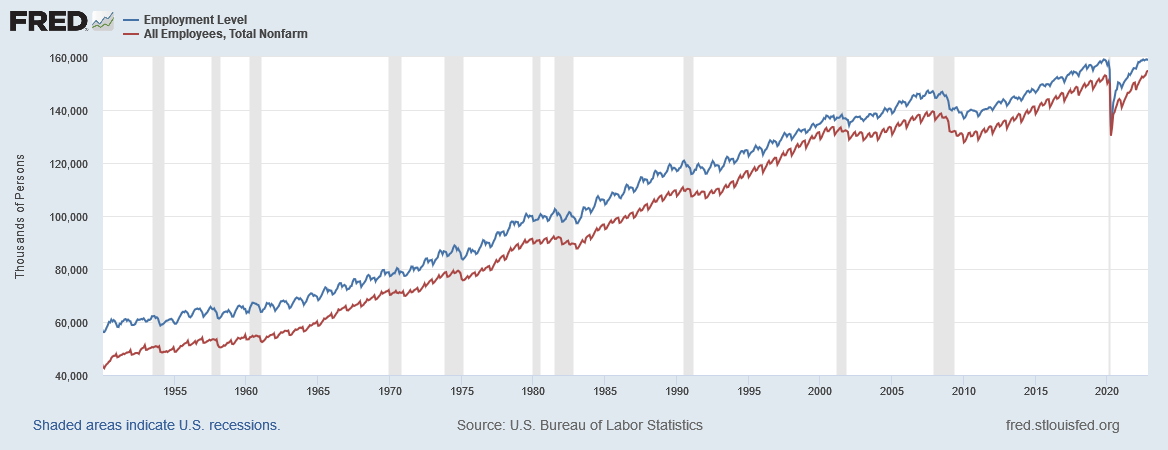
Each month’s Employment Situation Summary is a presentation of two surveys on employment: The Household Survey, which looks at individual workers and their demographic trends regarding labor, and the Establishment Survey, which examines labor from the employer perspective.
The Establishment Survey comes from the Current Employment Statistics Survey.
The Bureau of Labor Statistics (BLS) collects data each month on employment, hours, and earnings from a sample of nonfarm establishments through the Current Employment Statistics (CES) program. The CES survey includes about 131,000 businesses and government agencies, which cover approximately 670,000 individual worksites drawn from a sampling frame of Unemployment Insurance (UI) tax accounts covering roughly 10.7 million establishments. The active CES sample includes approximately one-third of all nonfarm payroll employees in the 50 states and the District of Columbia. From these data, a large number of employment, hours, and earnings series in considerable industry and geographic detail are prepared and published each month. Historical statistics for the nation are available on the CES National data homepage. Historical statistics for states and metropolitan areas are available on the CES State and Metro Area data homepage.
As might be expected of survey data, the final results reported each month are estimates derived from the sample set comprising each survey’s responses for that month.
The Current Employment Statistics (CES) sample is a stratified, simple random sample of worksites, clustered by Unemployment Insurance (UI) account number. The UI account number is a major identifier on the Bureau of Labor Statistics (BLS) Longitudinal Database (LDB) of employer records, which serves as both the sampling frame and the benchmark source for the CES employment estimates. The sample strata, or subpopulations, are defined by state, industry, and employment size, yielding a state-based design. The sampling rates for each stratum are determined through a method known as optimum allocation, which distributes a fixed number of sample units across a set of strata to minimize the overall variance, or sampling error, on the primary estimate of interest. The total nonfarm employment level is the primary estimate of interest, and the CES sample design gives top priority to measuring it as precisely as possible, or minimizing the statistical error around the statewide total nonfarm employment estimates.
While the CES survey is supposed to be constructed so as to minimize the magnitude of survey error, there is always going to be error. The BLS is able to reduce the cumulative impacts of sampling error through its process of benchmarking, where the data from the survey is adjusted to align it with data collected from unemployment insurance programs—the very nature of which can provide a complete census on employment.
For the CES survey, annual benchmarks are constructed in order to realign the sample-based employment totals for March of each year with the Unemployment Insurance (UI) based population counts for March. These population counts are much less timely than sample-based estimates and are used to provide an annual point-in-time census for employment. For national series, only the March sample-based estimates are replaced with UI counts. For state and metropolitan area series, all available months of UI data are used to replace sample-based estimates. State and area series are based on smaller samples and are therefore more vulnerable to both sampling and nonsampling errors than national estimates.
Population counts are derived from the administrative file of employees covered by UI. All employers covered by UI laws are required to report employment and wage information to the appropriate state Unemployment Insurance agency four times per year. About 97 percent of private and total nonfarm employment within the scope of the establishment survey is covered by UI. The UI data are obtained and edited by each state's Labor Market Information (LMI) agency, and are tabulated and published through the BLS Quarterly Census of Employment and Wages (QCEW) program. A benchmark for the remaining 3 percent is constructed from alternate sources, primarily records from the Railroad Retirement Board (RRB) and County Business Patterns (CBP). This 3 percent is collectively referred to as noncovered employment and is explained further in the calculating noncovered employment section of this document. The full benchmark developed for March replaces the March sample-based estimate for each basic cell. The monthly sample-based estimates for the year preceding and the year following the benchmark are also then subject to revision. Each annual benchmark revision affects 21 months of data for not seasonally adjusted series and 5 years of data for seasonally adjusted series.
In other words, the BLS “corrects” the Establishment Survey data that has been reported in each month’s Employment Situation report each year after the March unemployment insurance data are collected and tallied.
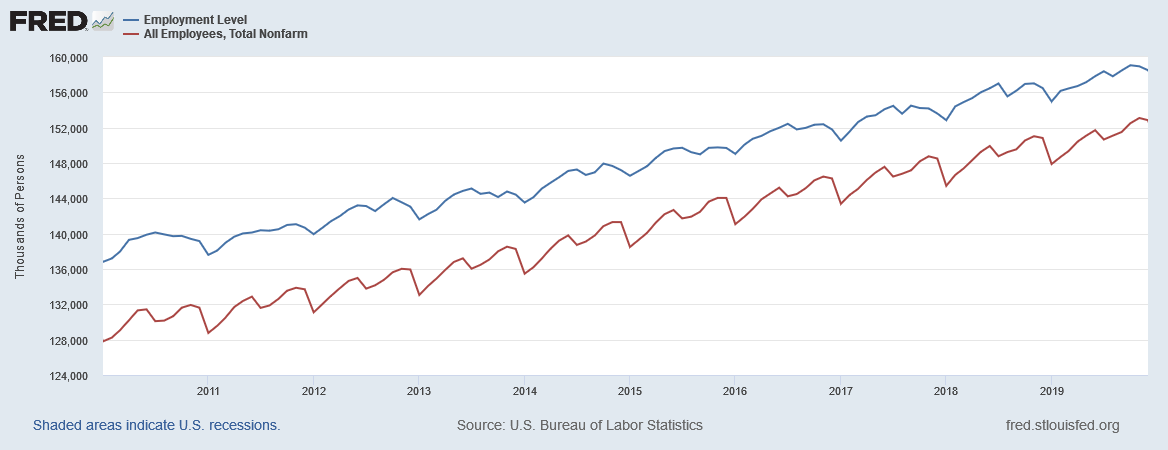
What does not get said is that the structure and administration of the surveys manage to systematically overstate employment throughout the year, only to be corrected once per year. Thus when we look at total employment over time, the surveys show a “ripple” effect in the unadjusted data.
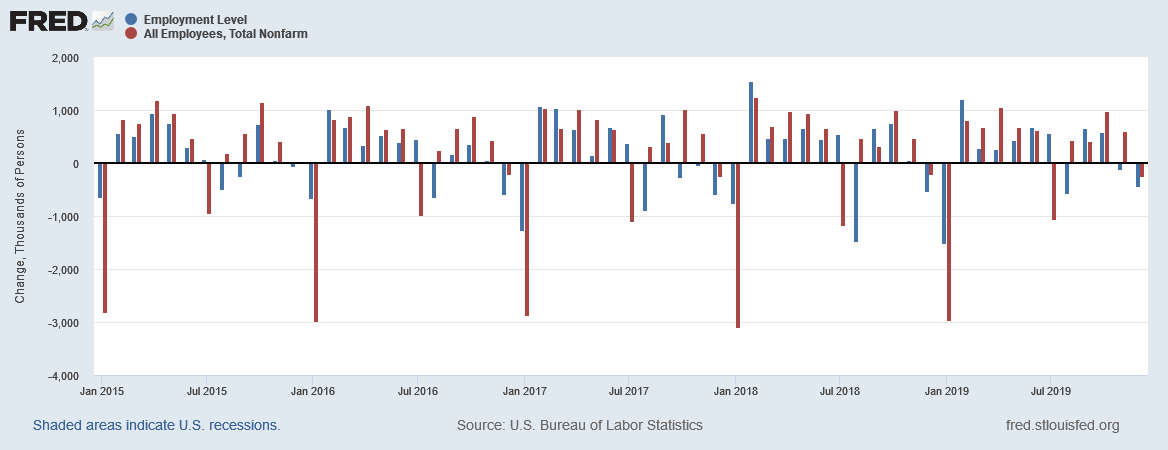
If we focus on the decade before the 2020 Pandemic lockdowns and ensuing labor disruption, we see the rippling following an annual pattern consistent with the corrective action of the annual benchmarks.
Two things immediately stand out at this point: 1) there is a reduction in total employment each January due to the benchmarking, and 2) the Establishment Survey largely follows the Household Survey, with a consistent difference between the two surveys.
Total employment per the Establishment Survey is structurally smaller than per the Household Survey for the simple reason that not every worker covered by the Household Survey appears in the Establishment Survey—e.g., they are self-employed and thus do not participate in an unemployment insurance program.
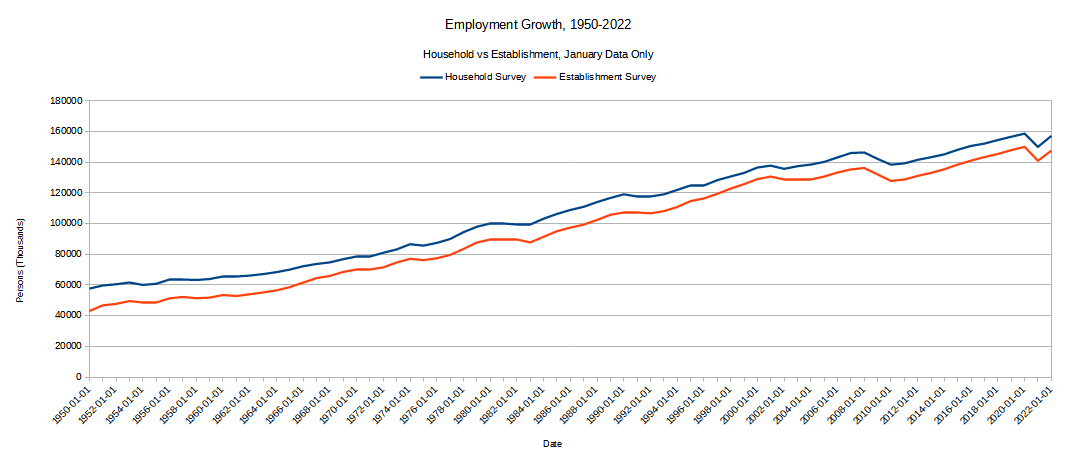
With the benchmarking adjustments each year, the Establishment Survey maintains a fairly consistent relationship with the Household Survey, as we can see if we chart the data using only the January minimums from each survey.
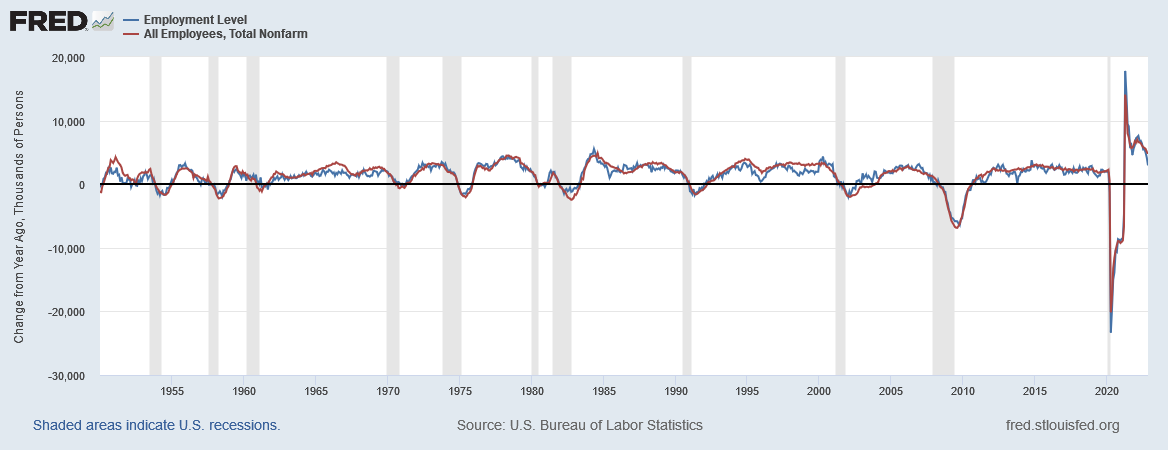
Despite the structural errors in the Establishment Survey, the benchmarking process historically removes much of that error, as we can see from the consistent alignment of year on year changes in employment between the two surveys.
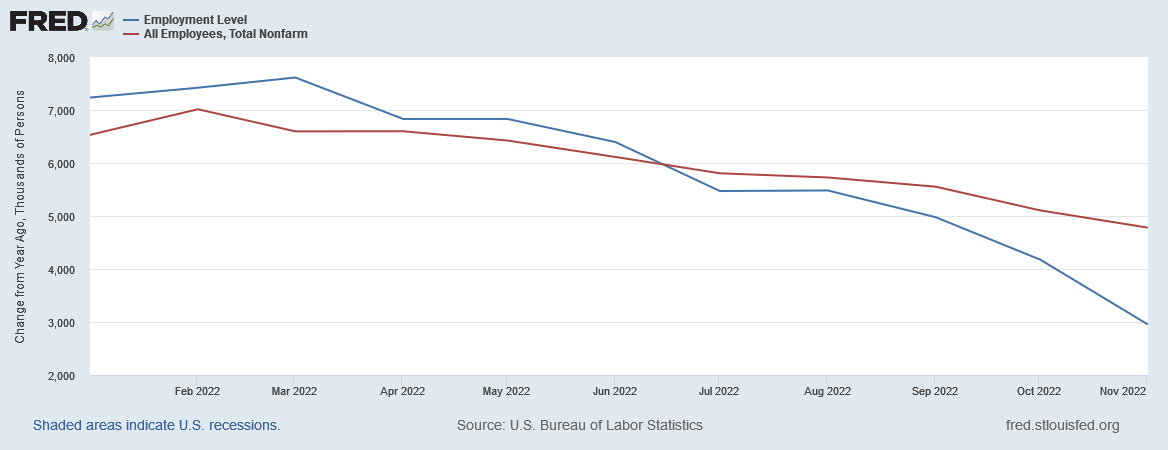
What is historically true, however, is not true for the current year, as we can see when we look at the year on year changes for both surveys for just 2022.
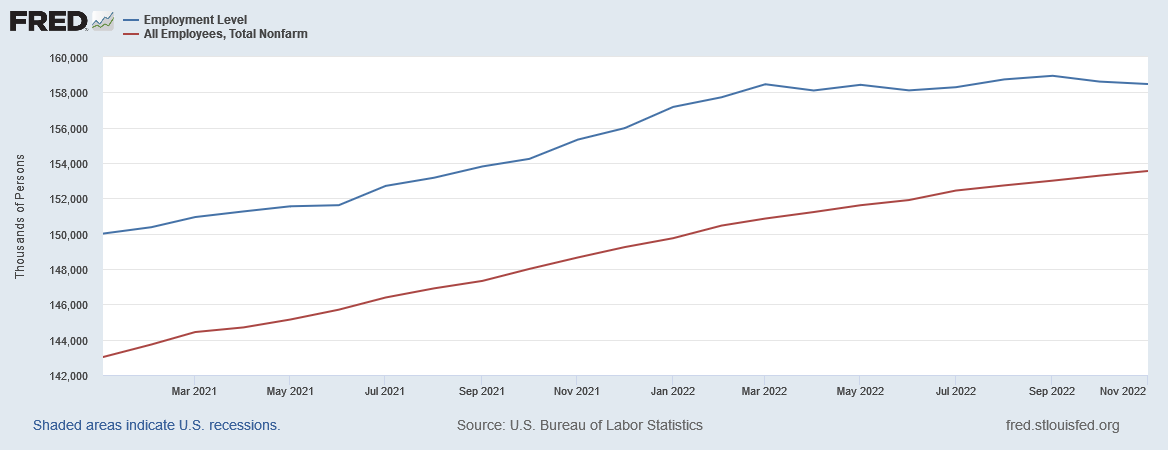
Starting in March, the Household Survey data showed a marked decline in year on year employment change which the Establishment Survey data does not. In fact, what the Household Survey shows in the seasonally adjusted data is total employment reaching a plateau in March and remaining more or less flat since then.
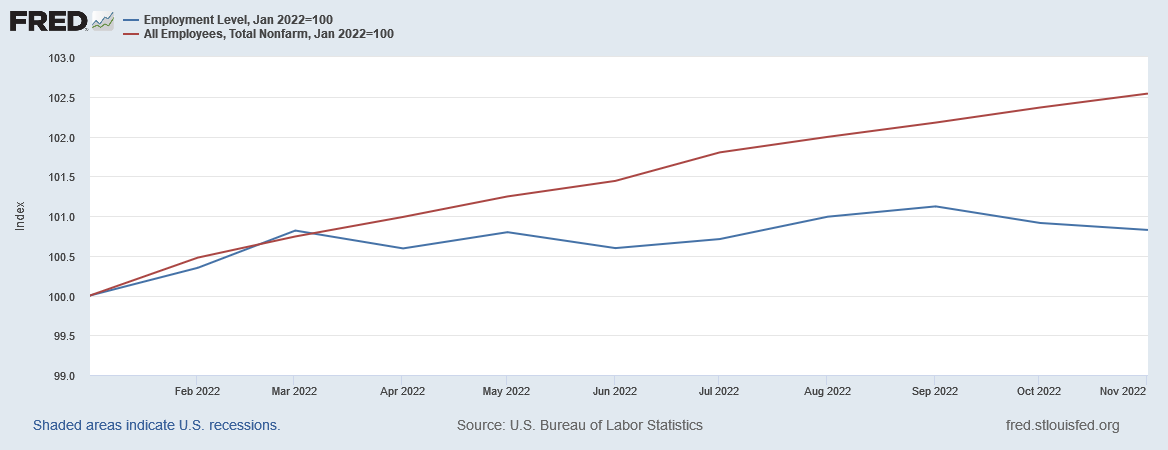
This plateau is even more apparent when we baseline both surveys to January of this year and only look at the magnitude of their respective changes.
The Establishment Survey shows continued employment growth, while the Household Survey shows literally almost no employment growth since March, with the November data showing the same baseline index value as March of 100.8. In terms of actual number of employed persons, the March value from the Household Survey was 158,458,000, while the November value is 158,470,000—indicating that job growth in the US since March is a paltry 12,000 jobs.
The June Household employment number is 158,111,000, indicating that employment in the US actually fell 347,000 during the second quarter, which would mean even the Philadelphia Fed’s benchmarks are still substantially inaccurate and still overstate actual employment.
The Household Survey is thus showing a near total pause in job growth in the US beginning in March, which the Establishment Survey has yet to detect—although much of that pause presumably will be realized when the BLS corrects the Establishment Survey after the March 2023 annual benchmarks are released. The Philadelphia Fed’s early benchmarks, which seeks to calculate interim corrections ahead of the March benchmarks, appear to confirm this will be the case.
With the differential in magnitudes between the Household and Establishment Surveys being roughly 1.7% (102.5 - 100.8 on the baseline chart), through November alone the next BLS benchmark is likely to reduce the Establishment Survey figures by some 2.7 million jobs at least—the number of jobs the Establishment Survey shows created between March and November (153,548,000 - 150,856,000).
We should note that the Household Survey also gets benchmarked and corrected each year, but the January drop is significantly smaller, indicating the structural error in the Household Survey is similarly smaller than in the Establishment Survey, as the five years prior to 2020 shows.
The Philadelphia Fed’s early benchmarks confirm that there has been virtually no job growth in the US since March, and the BLS 2023 benchmarking will almost certainly confirm that.
Exactly why the Establishment Survey fails to capture this jobs plateau at the present time requires greater analysis than can be encompassed within just this article. What is apparent is that the Establishment Survey has failed to capture the jobs plateau, and thus is now consistently overstating employment in the US.
Yet what is damning to the BLS is not that the Establishment Survey is failing to capture this plateau, which is an historic first looking at the Household Survey data going back to 1950, but that the Employment Situation reports largely fail to acknowledge this plateau and the magnitude of the pending correction during next March’s benchmarking.
The BLS already knows the structural tendency of the Establishment Survey to overstate employment, hence the annual January reductions. It therefore must realize that a substantial correction to total employment is going to happen next March when the new benchmarks are developed, yet each month’s jobs report continues to claim job growth the BLS knows cannot possibly exist and will disappear after next March.
Surveys are imperfect measurement techniques for any phenomenon. While they can often be more timely than a comprehensive census measurement, they will not be as accurate as a census, let alone more accurate. Therefore we should not be surprised or dismayed by the failure of the Establishment Survey to capture the jobs plateau shown in the Household Survey. We should, however, be a good deal more than dismayed that the BLS failed to acknowledge the documented structual imperfections of the Establishment Survey in the face of such an obvious deviation from the norm in the Household Survey.
Amazingly—and appallingly—the BLS Employment Situation summary reports are broken each month because the BLS manages to fail to look closely at all of its own data when preparing the reports. Moreover, because the BLS does not look closely at all of its own data, neither the White House nor the Federal Reserve look closely at all of the BLS data, hence the repeated claims by both of strong job growth in this country.
Which makes the BLS Employment Situation Summary a stark object lesson in the importance of scrutinizing all the data when evaluating anything.


