Another month, another report built around the phrase “little change” which obscures job loss and increased joblessness.
Another month, another dose of Lou Costello Labor Math.
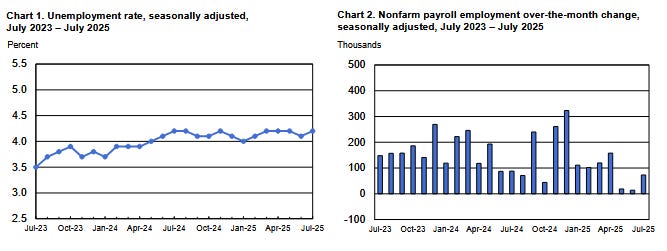
Total nonfarm payroll employment changed little in July (+73,000) and has shown little change since April, the U.S. Bureau of Labor Statistics (BLS) reported today. The unemployment rate, at 4.2 percent, also changed little in July. Employment continued to trend up in health care and in social assistance. Federal government continued to lose jobs.
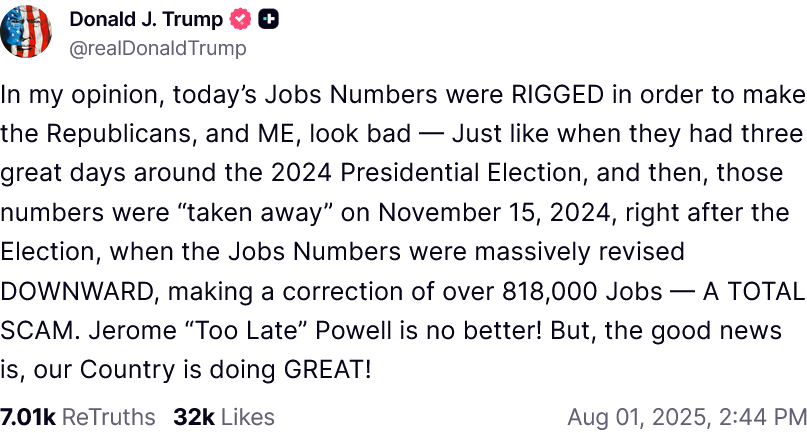
If President Trump is right, Dr. McEntarfer and the entire Bureau of Labor Statistics have done irreparable harm to themselves and their work. Speaking as an analyst who uses BLS data frequently, to say this is a big deal is an understatement.
I have no inside information that allows me to conclude whether Donald Trump is right or wrong in this allegation. However, the BLS’ own numbers indicate that “something” is indeed wrong with the jobs numbers, and not just the outsized “revisions” that have become commonplace.
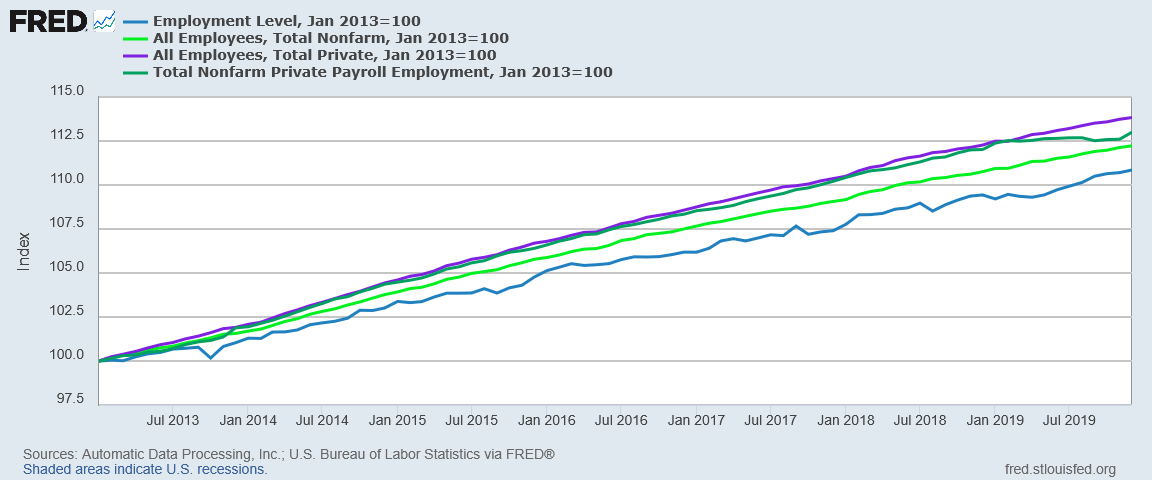
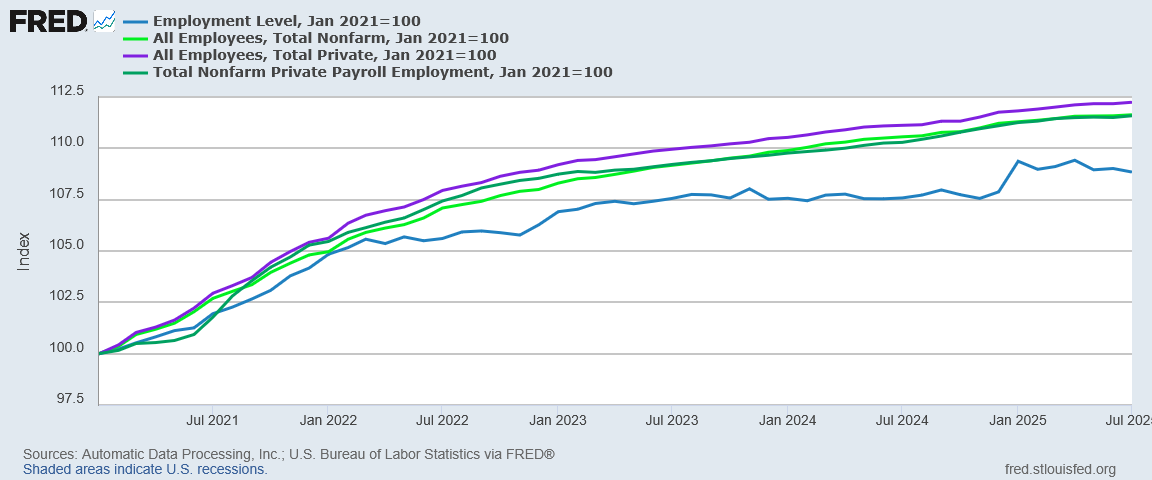
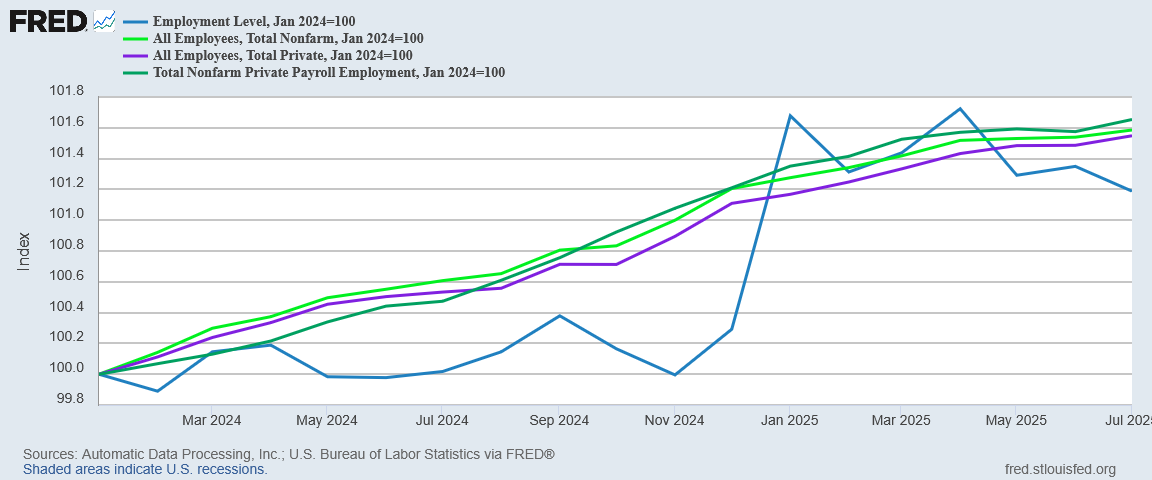
We do well to remember that the BLS employment data reporting provides a multidimensional look at what is fundamentally the same data—America’s population of working men and women. The Employment Level from the Household Survey and the All Employees metric from the Establishment Survey should broadly reflect the same trends.
While the Employment Level rose more slowly than the Establishment Survey metrics, its variance from the Establishment Survey metrics was fairly consistent.
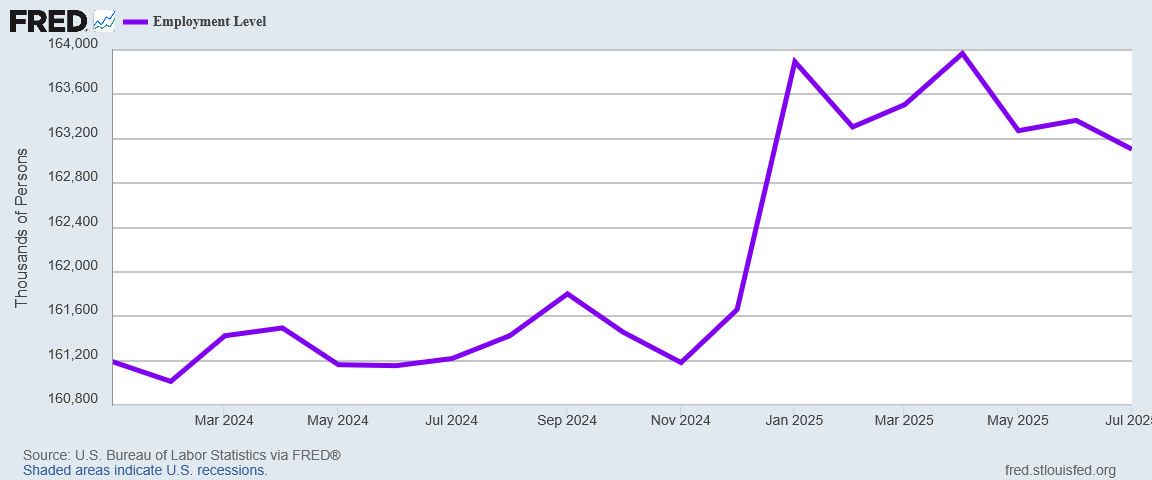
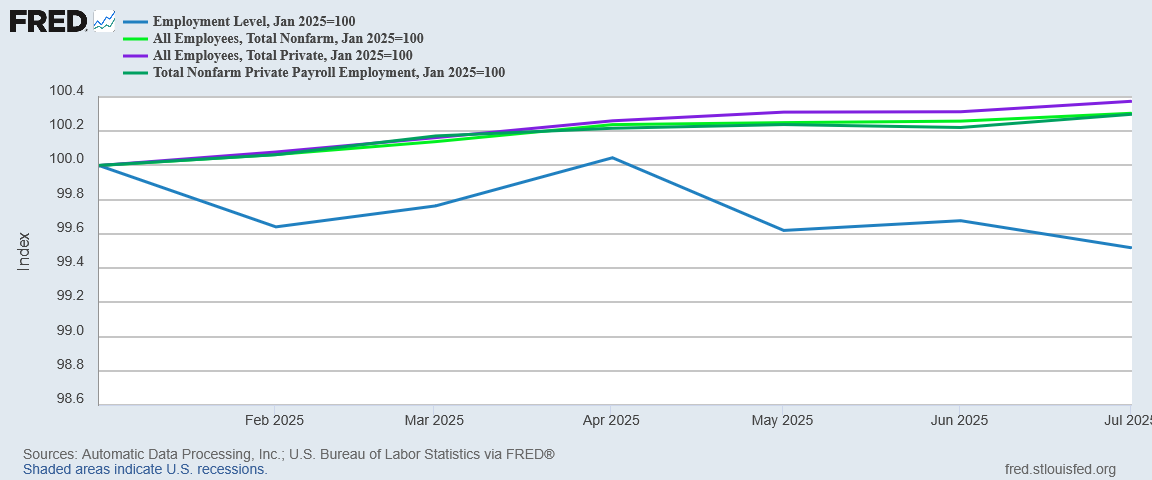
The Employment Level flat-lined in 2022 and again between 2023 and 2024, while the Establishment Survey metrics did not. Indexed against January 2021 data, the Employment Level flat-lined again in 2025.
Remember, these are all measures of what should fundamentally be the same data. One metric showing no gain while the others show gain should not be possible. Yet that is what we have in the data.
That’s a problem. But it gets worse.
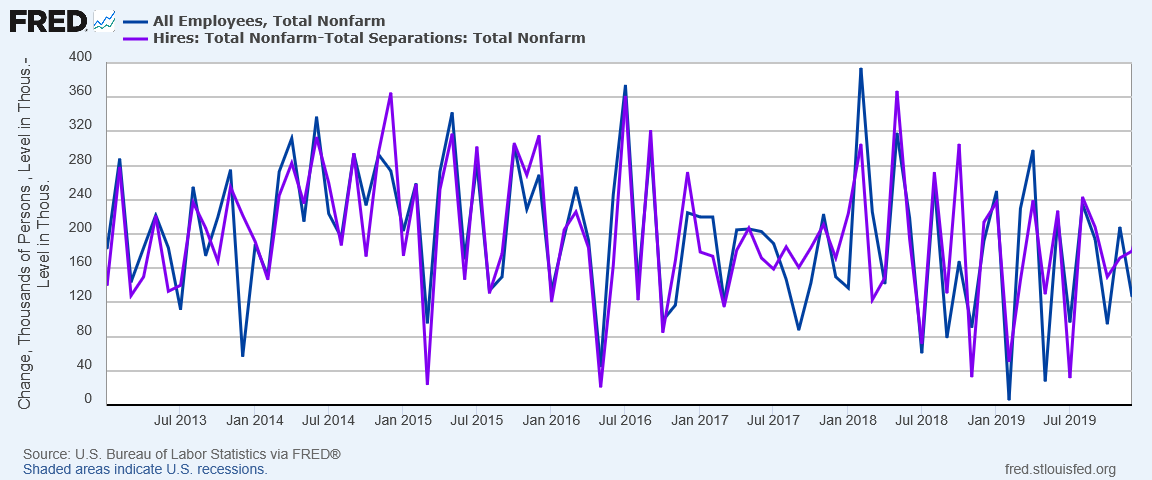
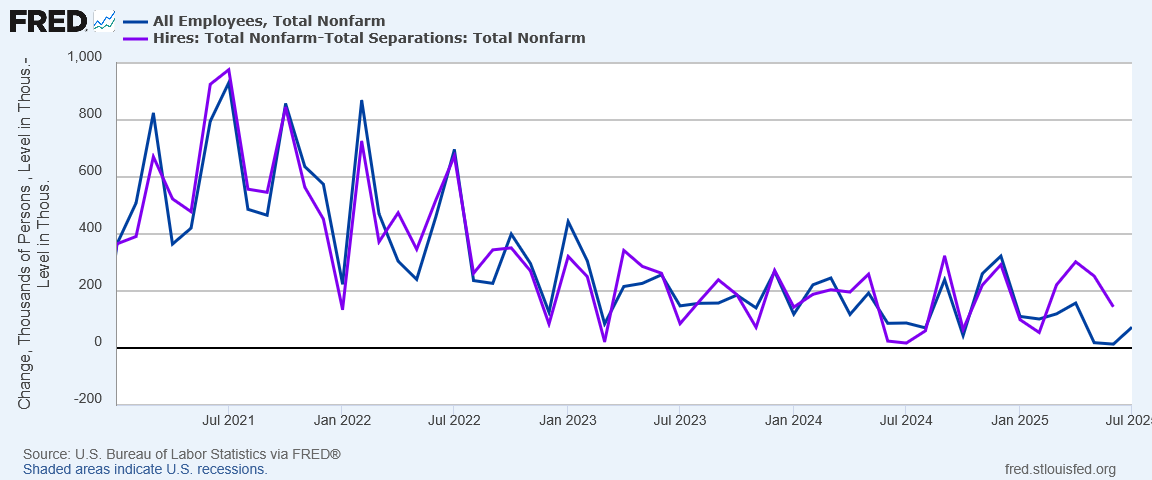
The JOLTS metrics are another perspective on the same employment information. We should expect that the net hiring captured by the JOLTS reports should align fairly closely with the change in the All Employees metric from the Establishment Survey. Pre-COVID, that is what happened.
While simple measurement error means we should not expect net hiring from the JOLTS report to match the change in the All Employees metric exactly, since March the JOLTS net hiring figure has been considerably larger than the change in All Employees—from roughly 80,000 jobs to over 200,00 jobs larger.
That much variance between these two metrics does not happen, nor should it. One of these two metrics is flat-out wrong.
Such is the quality of data McEntarfer has been putting out the past few months.
Dr. Erika McEntarfer earned her firing, and then some.
Update 1 (1800CDT 1 August 2025)
I am clearly not the only one who believes that change is needed at the Bureau of Labor Statistics.
The second and third are the indexed versions of the Employers’ Survey headcount of working employees, the ADP National Employment Report, and the Household Survey from report.
I saw a post from Geiger Capital that stated 1.8 million foreigners have lost jobs in the US over the last 4 months. Meanwhile, 1.5 million native-born Americans landed new jobs over the same period. That's an interesting conversion rate. If true, the low job numbers may be distorted. Native born Americans had a terrible time getting jobs under Biden. If they're truly getting jobs over foreigners, that's a good thing. Curious if you've had a chance to look at that.
The data is very clear. Each month you post your BLS analysis I am always befuddled - why can Peter see this but the bureaucrats can’t? Just what the heck? End the BLS!
I have long ago stopped expecting much good from government, but this incompetence is just pathetic. Peter, maybe you could come to national prominence by launching a campaign showing how worthless this agency is, and Trump could hear about it and slash it via DOGE. You’d be doing a national service!


I saw a post from Geiger Capital that stated 1.8 million foreigners have lost jobs in the US over the last 4 months. Meanwhile, 1.5 million native-born Americans landed new jobs over the same period. That's an interesting conversion rate. If true, the low job numbers may be distorted. Native born Americans had a terrible time getting jobs under Biden. If they're truly getting jobs over foreigners, that's a good thing. Curious if you've had a chance to look at that.
https://x.com/Geiger_Capital/status/1951266734171726291
The data is very clear. Each month you post your BLS analysis I am always befuddled - why can Peter see this but the bureaucrats can’t? Just what the heck? End the BLS!
I have long ago stopped expecting much good from government, but this incompetence is just pathetic. Peter, maybe you could come to national prominence by launching a campaign showing how worthless this agency is, and Trump could hear about it and slash it via DOGE. You’d be doing a national service!