187,000 Jobs In August? Not Exactly
Lou Costello Labor Math Reigns Supreme At The BLS
If you believe the corporate media and the Bureau of Labor Statistics’ August Employment Situation Summary, the US economy once again defied expectations, continuing to grow and add jobs despite the Fed’s determined efforts to push interest rates high enough to kill off job creation in the US.
Total nonfarm payroll employment increased by 187,000 in August, and the unemployment rate rose to 3.8 percent, the U.S. Bureau of Labor Statistics reported today. Employment continued to trend up in health care, leisure and hospitality, social assistance, and construction. Employment in transportation and warehousing declined.
Corporate media, dutifully taking the BLS numbers at face value, cheerily reported this as good news.
U.S. job growth continued at a moderate pace in August while the unemployment rate unexpectedly jumped, a sign that the labor market is finally cooling in the face of rising interest rates and chronic inflation.
Employers added 187,000 jobs in August, the Labor Department said in its monthly payroll report released Friday, topping the 170,000 jobs forecast by Refinitiv economists.
Bloomberg even went so far as to celebrate the “return” of “normal labor markets”.
A passing glance at the August jobs report released today by the US Labor Department would suggest an economy headed in the wrong direction. After all, the unemployment rate shot up to 3.8% from 3.5% in July, marking the biggest increase since the onset of the Covid-19 pandemic in April 2020. A more measured look, though, reveals something completely different.
That jump in the unemployment rate was not a reflection of companies firing workers in anticipation of a slowdown, but rather because of very large 700,000 increase in the number of people looking for a job. This caused the labor force participation rate to jump to 62.8%, the highest since before the pandemic.
However, if one really takes a “more measured look” at the data, it reveals once again that the BLS’ cockeyed “seasonal adjustments” (aka “Lou Costello Labor Math”, in honor of Abbott and Costello’s classic vaudevillian routine where “7 times 13 is 28”) obscure some very decidedly negative labor trends.
The seasonally adjusted data might be moderately good. The unadjusted data is anything but good.
As readers will recall from last month, the BLS Employment Situation Summary has degenerated into a dumpster fire of illogic and outlandish fudge factors.
Let’s just cut to the chase here. The July Employment Situation Summary put out by the Bureau of Labor Statistics is an illogical irrational dumpster fire of a statistical report. This is especially true of the Establishment Survey portion of the report.
Total nonfarm payroll employment rose by 187,000 in July, and the unemployment rate changed little at 3.5 percent, the U.S. Bureau of Labor Statistics reported today. Job gains occurred in health care, social assistance, financial activities, and wholesale trade.
We can safely disregard the fact that the nonfarm payroll employment rose by less than the 200,000 that some “experts” had projected for July.
We can also disregard the corporate media gaslighting that the number is less than the 209,000 jobs ostensibly created in June. We can do this because at the bottom of the Employment Situation Summary is the usual “oops!” admission that the June figures were overstated by some 25,000 jobs.
We can, however, answer the lingering question from last month regarding how much the BLS overstated its jobs numbers for July: 30,000 jobs (emphasis mine).
The change in total nonfarm payroll employment for June was revised down by 80,000, from +185,000 to +105,000, and the change for July was revised down by 30,000, from +187,000 to +157,000. With these revisions, employment in June and July combined is 110,000 lower than previously reported. (Monthly revisions result from additional reports received from businesses and government agencies since the last published estimates and from the recalculation of seasonal factors.)
Yes, the BLS’ “oops” factor eliminates over half of the jobs number for August right off the top.
Cumulatively, the BLS has now overstated job creation in the US by at least 355,000 jobs just year to date.
Every single month from January through July has been revised substantially downward,
To illustrate just how badly the BLS numbers are off we need only chart the revisions from the last few months, courtesy of the archival data at the ALFRED system.
May started out announcing 339,000 jobs, and ended with 281,000. June dropped by more than half, from 209,000 to 105,000 jobs. July has only had one revision thus far, but that revision already lops 30,000 jobs off the total.
The raw data adjustments do not look any better. In fact, they look even worse, which really makes one wonder just what they are putting in the “seasonal adjustments” (“yes, waitress, I’d like my statistics seasonally adjusted with a dash of LSD, please”).
Just on the revisions history alone, we may safely surmise the BLS jobs data sets are tained and unreliable.
Working within the BLS data set, however, yields the usual examples of numbers which do not add up.
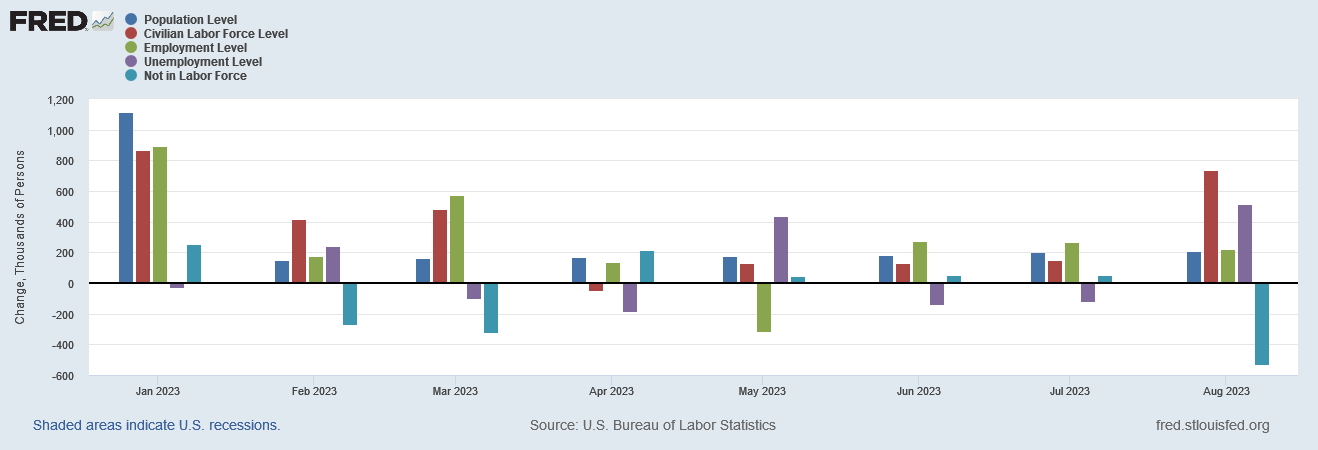
For example, when we look at the Household Survey data, we presumably get an explanation for the uptick in unemployment the BLS reports: supposedly a seasonally adjusted 736,000 people entered the labor force, of which 514,000 hadn’t found a job at the time of the survey. The challenge is that this break down of labor force entrants means that 222,000 people entered the labor force and began working.
222,000 people found work, according to the Household Survey, but 187,000 jobs were created. By my non-vaudevillian mathematics there’s a small discrepancy of 35,000 people/jobs between the two numbers.
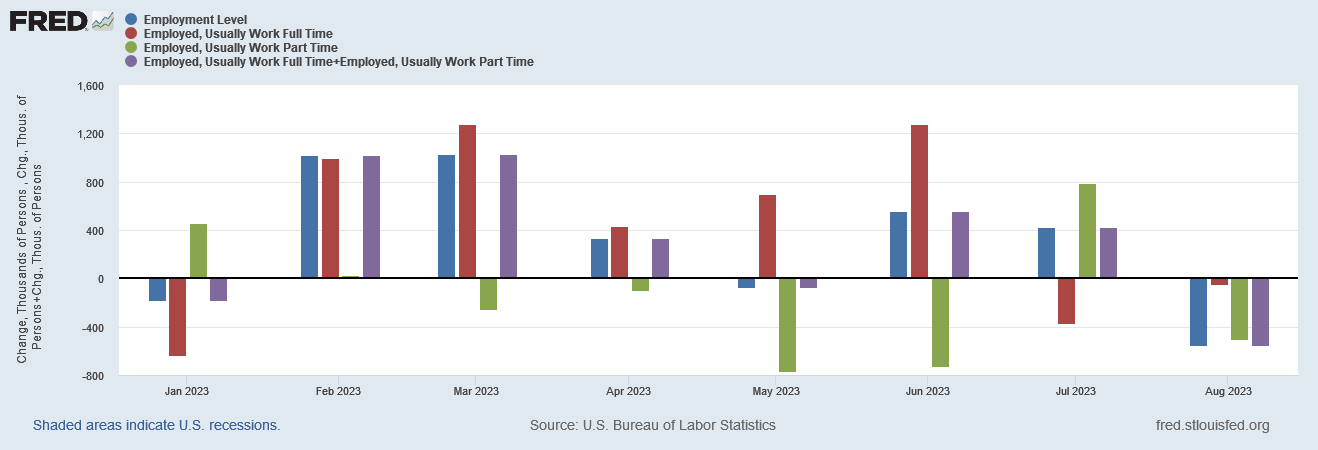
Nor can we reconcile the numbers by considering the number of persons who opted for self-employment. When we look at the change in seasonally adjusted number of full time workers and part time workers, we don’t come anywhere close to 222,000. We don’t even show job gains at all.
This should not happen, because if we compare the change using the unadjusted data, the numbers reconcile nicely.
With the unadjusted data, when we net the change in full time employed people with the change in part-time employed people, we get the change in the number of employed people. We get this every month, exactly as we should.
However, while the raw data reconciles every month, if we sum the seasonally adjusted full time and part time employed, and net that total against the total employed, we get a result other than zero.
If the breakdown reconciles with the unadjusted data, it should reconcile with the seasonally adjusted data. That it does not means there is a significant flaw in the seasonal adjustment process.
Gotta love that Lou Costello Labor Math (can I get a “heyyyyyy, Abbott!”?)!
In addition to this obvious flaw in the seasonal adjustment process, the BLS “seasonal adjustments” time and again produce extreme variations to the unadjusted data. If we look at the “All Employees” data from the Establishment Survey, both the Total Nonfarm and the Total Private, along with the ADP employment totals (which in theory should come close to the Establishment Survey), the unadjusted and adjusted data present dramatically different trends both in the current month and extending back over the past several months at least.
The seasonally adjusted data shows a consistent trend of job growth across all three data sets.
The unadjusted data shows months of job loss as well as job gains.
Seasonal adjustments are meant to smooth out cyclical patterns in the data. However the BLS is computing its seasonal variances, it’s ending up with substantially different patterns, and doing so throughout the Employment Situation Summary data aggregates.
Moreover, there is a preference both within the BLS and the corporate media to largely ignore the unadjusted data. This is an unsound presentation of the information; seasonal variations may explain much of the dramatic swings we see in the unadjusted data, yet at the same time if the data collection methods are sound, the job gains and losses in the current month are the job gains and losses that actually happened during the current month. Those should get far more attention than they do. The quest for a singular jobs number has led to the seaonally adjusted data being presented rather irresponsibly, both by the BLS (which should know better) and by the corporate media.
Additionally, there is a disquieting trend in the Establishment Survey data that has gone completely unremarked by the corporate media: since June of this year, private employment as reported by the Establishment Survey (and from July according to the ADP data) has largely plateaued, even as overall non-farm employment has declined.
We can see the plateau when we index the data to January of 2021:
We see the plateau when we index the data to January of 2022:
We see the plateau when we index the data to January of this year:
When a similar plateau was observed in the Household Data last year, eventually the Philadelphia Fed concluded that during the second quarter of last year net job growth across the entire country for the entire quarter was merely 10,000.
Will we see a similar conclusion being drawn about the third quarter of 2023? The data certainly leaves us that possibility.
Contrary to the corporate media presentation of the jobs data, we are in fact looking at a jobs situation described by that data which shows multiple negative trends, trends which suggest that the employment situation in this country is far from good, and labor markets remain as toxic and dysfunctional as ever (or the BLS data is simply that tainted, although I’m not sure that’s a distinction with much of a difference).
The one the we can say with certainty is that 187,000 jobs were not created during the month of August. The seasonally adjusted data is simply too corrupted for that to be the case. Additionally, the probability of a significant adjustment yet again suggests that number will get ratcheted down significantly over the next two months.
The only somewhat reliable information we can glean from the Employment Situation Summary lies in the unadjusted data. So long as data points that should reconcile do reconcile, we can at the very least examine the data for any trends that might be of significance.
The seasonally adjusted data within the Employment Situation Summary is nothing but garbage, and should be ignored. There’s simply nothing else to be done with it.


Another words, it sucks, and worse than that, they're trying to snow us it is recovering nicely.