


When the Bureau of Labor Statistics belatedly issued its September Consumer Price Index report, one reality was clear: the US economy was simply “stuck”.
Now the BLS has belatedly issued its September Producer Price Index report, and it confirms that the US economy is indeed “stuck”.
The Producer Price Index for final demand increased 0.3 percent in September, seasonally adjusted, the U.S. Bureau of Labor Statistics reported today. Final demand prices declined 0.1 percent in August and rose 0.8 percent in July. (See table A.) On an unadjusted basis, the index for final demand moved up 2.7 percent for the 12 months ended in September.
At first glance, one might think there was a burst of factory gate inflation in September. Certainly energy prices rose month on month, and those pushed the headline index higher.
Yet while energy prices helped raise the headline number month on month, year on year headline producer price inflation remained almost exactly where it was in August, at 2.7%. Just as the September Consumer Price Index data showed the US economy to be largely “stuck”, the September Producer Price Index confirms that is indeed the case.
Headline Prices Steady, Core Prices Down
If we looked just at the month on month data, we would think factory gate inflation heated up in September.
Certainly the headline producer price index data showed a month on month spike.
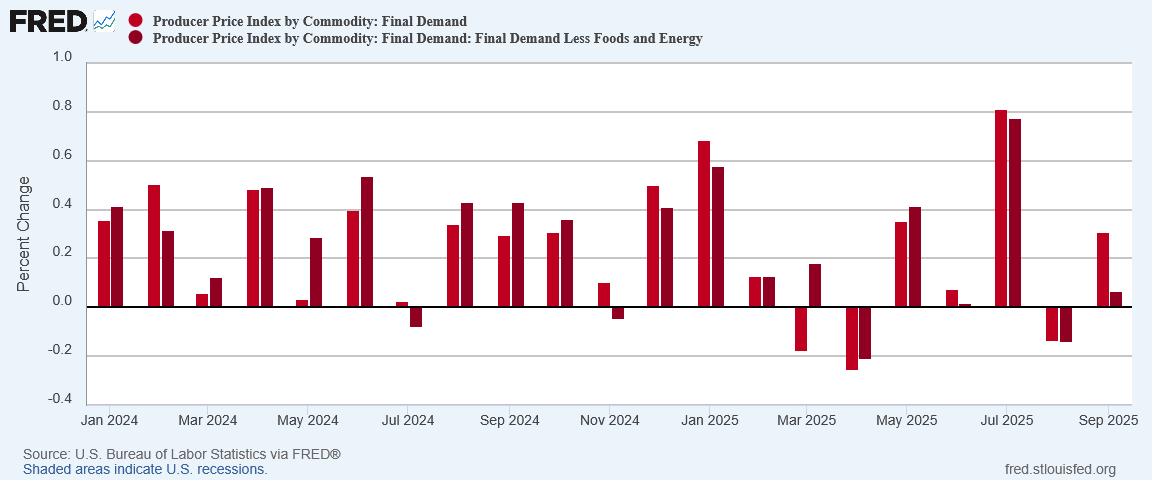
Yet that same headline data barely moved year on year, even as the core metric fell.
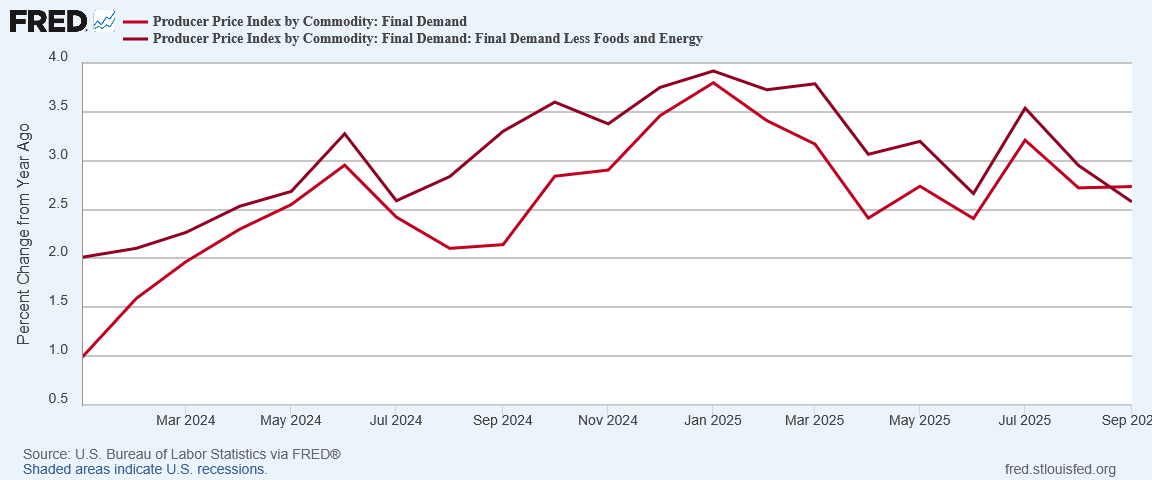
For the first time since February 2023, year on year headline PPI was higher than core PPI.
Yet even while energy surged month on month, it was only just enough to move the year on year inflation rate into positive territory for the first time all year.


The same dynamic was in play for food prices as well, with a significant uptick month on month having only minor impact year on year.


The year on year data especially gives the Trump Administration a much-needed dose of credibility in the “affordability” debate, as it absolutely shows prices moving in a much more desirable direction since January than during the Biden Reign of Error.
When the moderate inflation year on year for food and energy are factored out, core producer price inflation year on year continued the disinflation trend it has had all summer, and had broadly maintained throughout the year.
Good Prices Moving Sideways
In a rarity for economic data, drilling down into the core PPI numbers shows the same moderation when shifting between time frames.
In September, PPI for Final Demand Goods surged month on month to just under 1%.
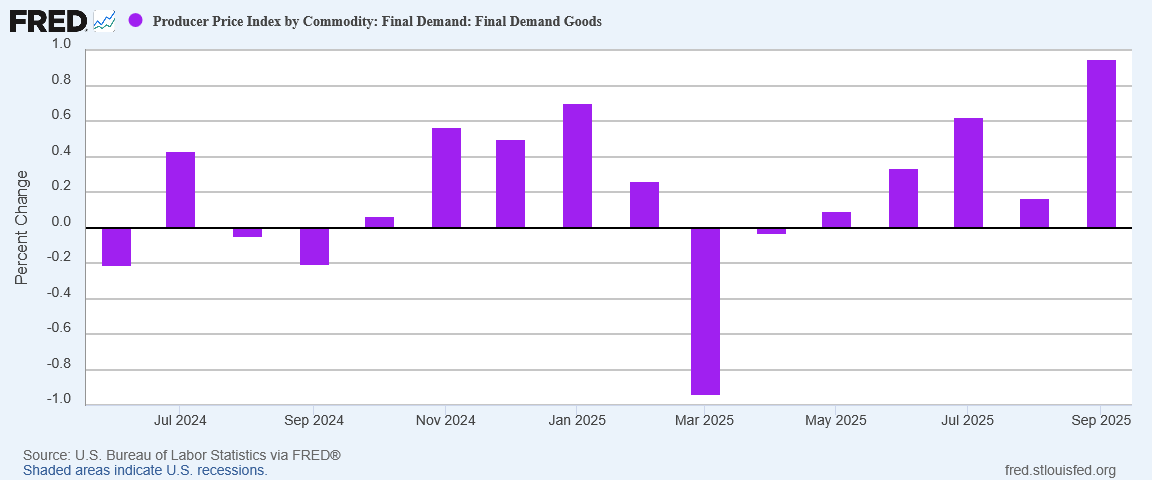
Year on year, PPI for Final Demand Goods shifted about the same, rising for the fifth month in a row, but showing a far more moderate trend then had been the case even in the aftermath of the 2022 hyperinflation cycle.
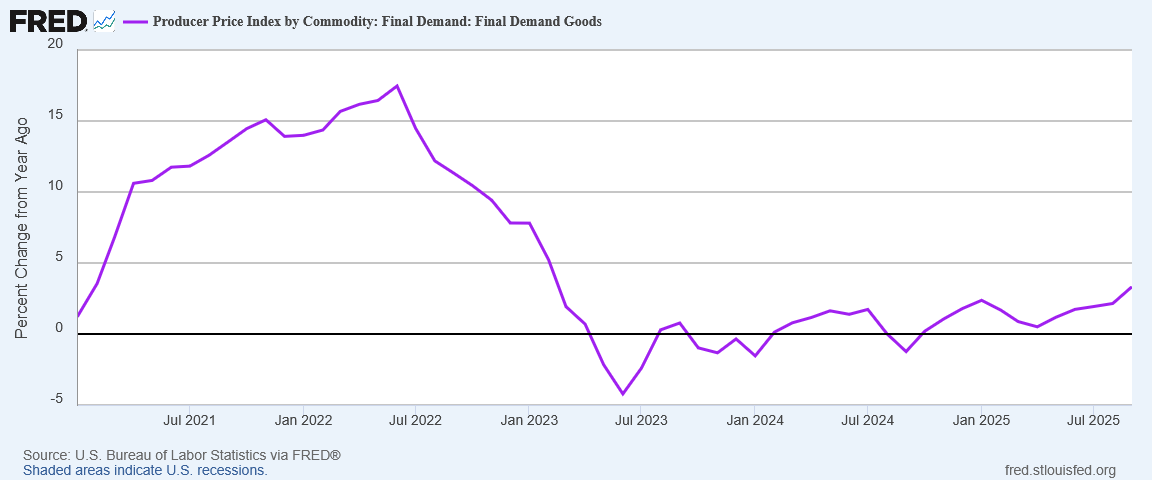
The year on year data is perhaps the strongest signal yet of President Trump’s Liberation Day tariffs contributing to inflation, yet the signal again remains far more muted than the “expert” narrative has insisted be the case.
Even when we examine the PPI for Intermediate Demand, in stepping back from the month on month data to the year on year scale, the shifts become far more moderate.


Goods prices moved up broadly in September, but the rises remain modest and well short of the surges of 2022. If September factory gate inflation for goods is the consequence of the Liberation Day tariffs, it is a far cry from the damaging price rises predicted by a fear-mongering corporate media.
Service Prices Trending Down
Where the longer-term disinflation trend particularly took hold was in service prices.
After surging significantly in July and then reversing into deflation in August, service prices posted a slight increase month on month for September.
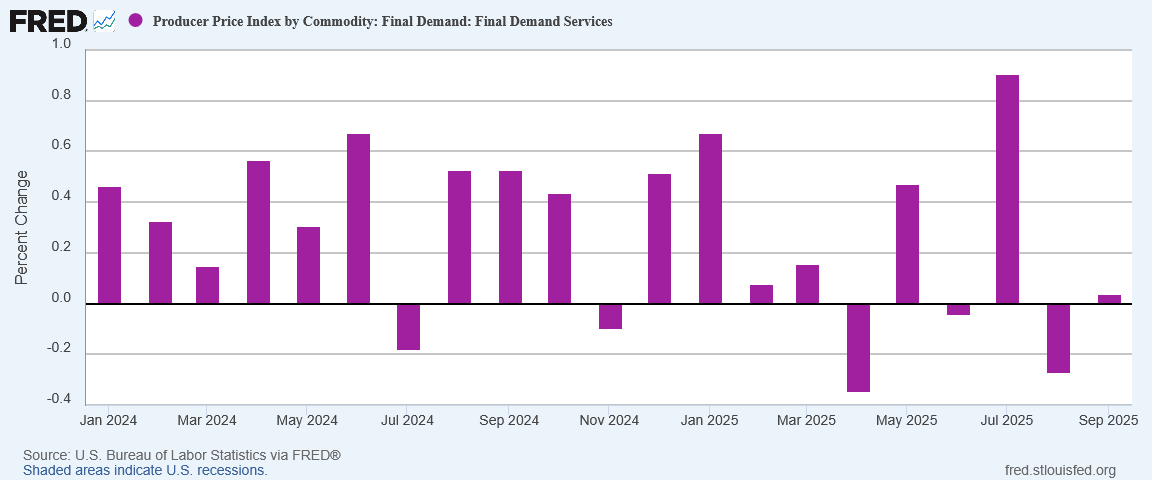
That increase was not enough to appreciably alter the disinflationary trajectory year on year.
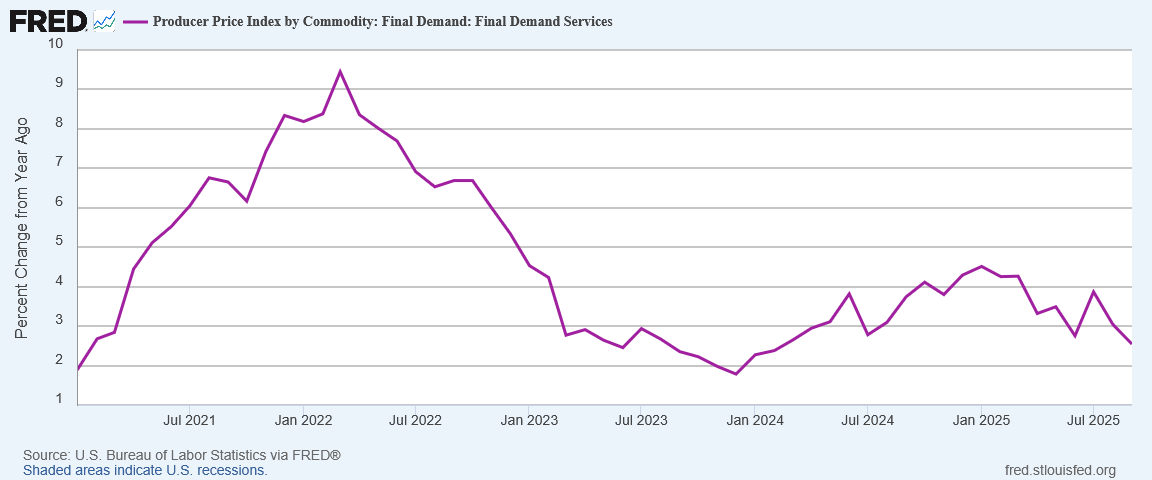
Factory gate inflation had been rising year on year for services throughout 2024, but for 2025 the overall trend has been the opposite.
Again, the year on year data bodes well for the Trump Administration on the affordability front, as it shows service price inflation continuing to head in the right direction.
Market Prices Confirm Sideways Movements
When we look at the underlying market prices, particularly for energy and commodities, we see that, through significant fluctuations up and down, prices for the month of September indeed moved mostly sideways, with prices at the end of the month little changed from the beginning.
That certainly was the case for oil prices, which posted only a moderate decline by the end of the month.
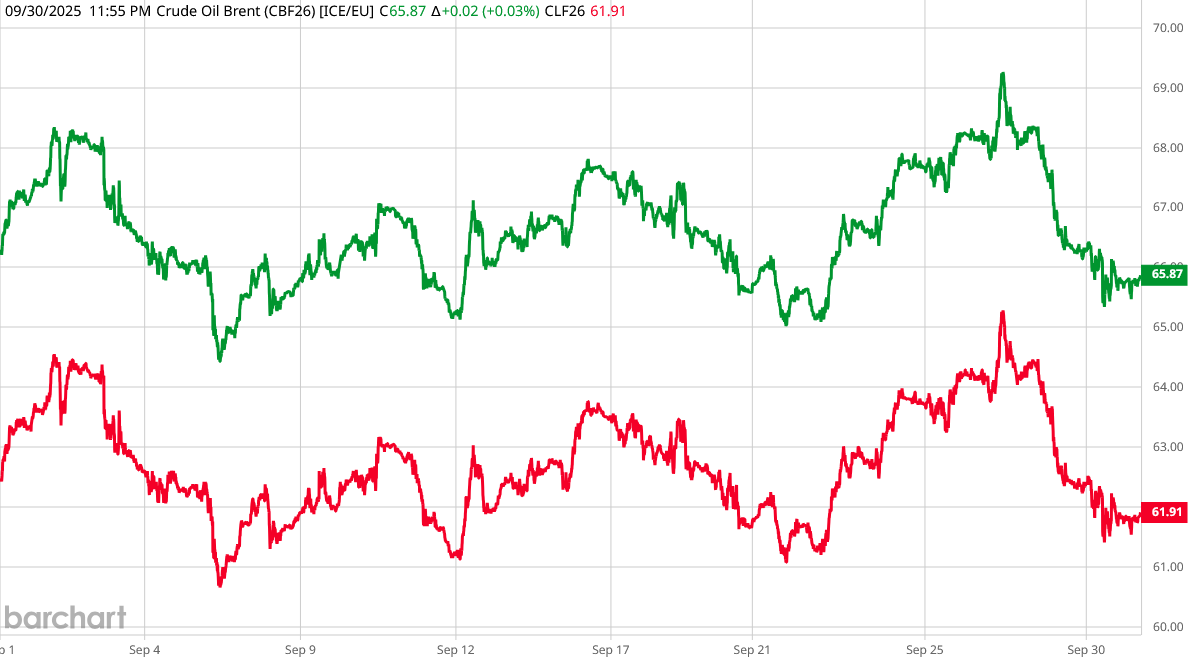
Nor were commodity prices more broadly much different, with various market indices diverging at month’s end to show either modest increases or modest declines.
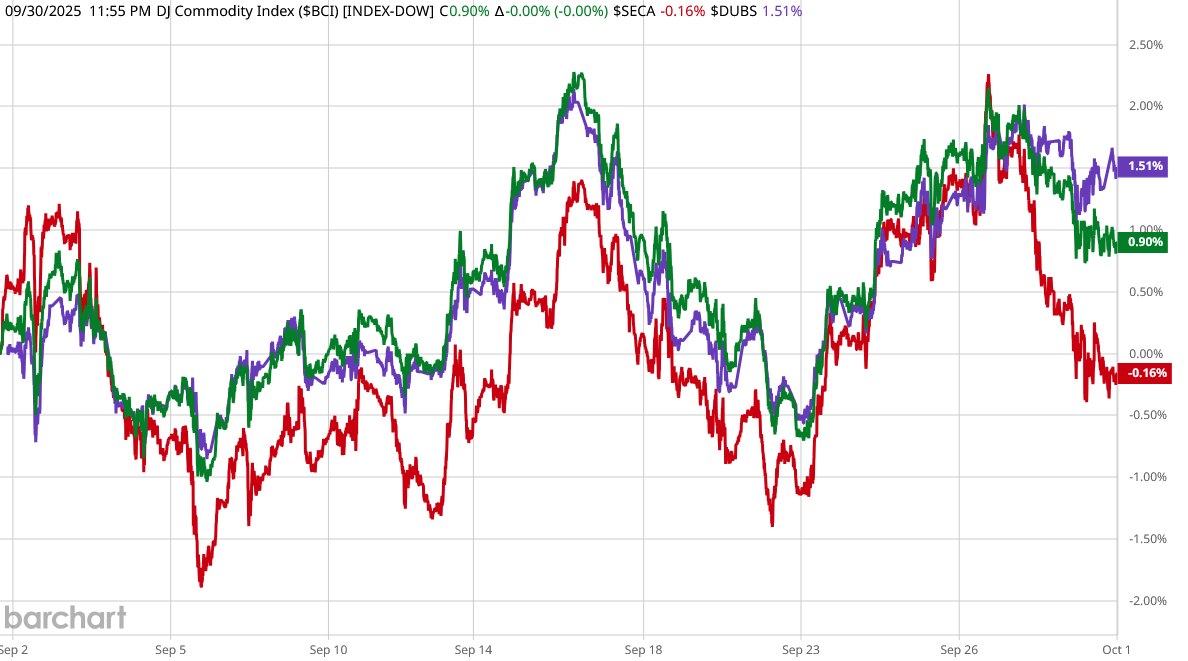
Certainly prices had moved significantly higher and lower during the month, but neither increase nor decrease proved to be a sustainable trend.
When prices are neither moving up nor down overall, “stuck” becomes the descriptor to use.
The Economy Is Still “Stuck”
Just as with the CPI data, September’s Producer Price Index does not support any of the broad narratives that have been pushed for the economy.
While core price inflation declined year on year, with goods prices showing only moderate inflation, September’s PPI data broadly reflects the BLS’ favorite term “little changed”. Broadly speaking, producer prices in September are just not that much different from where they were in August.
That lack of significant change does not give the Fed much reason to withhold another reduction to the federal funds rate next month.
While parts of the data work well for the Trump Administration with regards to affordability, prices overall have hardly improved to the degree Trump’s “Golden Age” rhetoric would suggest. President Trump’s preference for describing the US economy in terms of a “Golden Age” remains very much more aspirational than actual.
The upward shifts in goods prices do lend credence to claims that the Liberation Day tariffs are contributing towards inflation—but that contribution is minimal at best, and hardly of a magnitude to justify corporate media’s constant pearl-clutching over tariffs.
With no narrative being well served by the Producer Price Index data, we are left with “stuck” being the only good adjective to use for the economy overall. Inflation is not getting worse, but neither is it getting any better. The economy may not have deteriorated in September, based on the PPI data, but neither can it be said to have improved.
Is this lack of clear direction an indication that the US is either in or heading into a stagflationary episode, or even a deflationary one? That possibility was certainly presented by the Consumer Price Index data, and it is hardly refuted by the Producer Price Index.
That possibility is perhaps the strongest argument yet for a larger rate cut next month. If the economy is in stagflationary doldrums, a large rate cut could provide some much needed momentum. Momentum is the one attribute that is not apparent in the US economy, and it is the one attribute that is essential if the jobs recession is ever to be brought to an end.
For now, however, the Producer Price Index tells broadly the same tale as the Consumer Price Index, a tale where the US economy is neither in boom nor bust, but is simply “stuck.”
You always produce the most level-headed, accurate analysis, Peter. Thank you, again.
You have said that our economy needs higher wages and more manufacturing jobs, along with better actions from the Fed. Both of these may now be too late to appreciably help Trump in the midterms. Peter, can you think of anything new that Trump could try in order to improve the economy during the next year?