

Muddled CPI Data Vindicates No One
The Economy Isn’t Booming or Busting — It’s Just Stuck

The September Consumer Price Index Summary drives home exactly one conclusion: all the narratives in Washington DC are broken.
Consumer price inflation rose, but rose less than expected. The government can still publish data even during a “shutdown”. Tariffs still are not causing rampant inflation. Inflation concerns still do not justify the Fed slow-walking interest rate cuts.
The unpleasant truth, cutting through all narratives, is that inflation is still rising in this country.
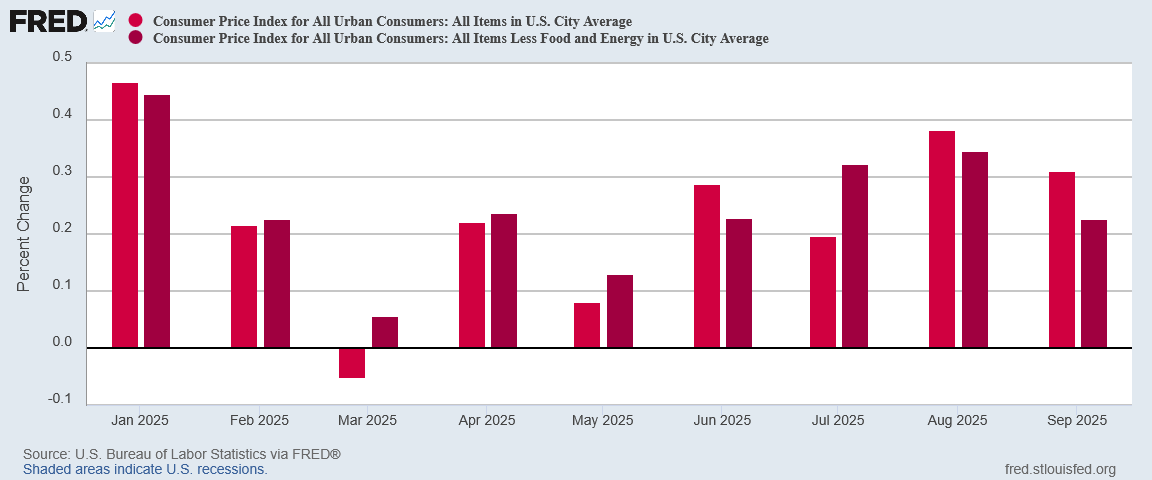
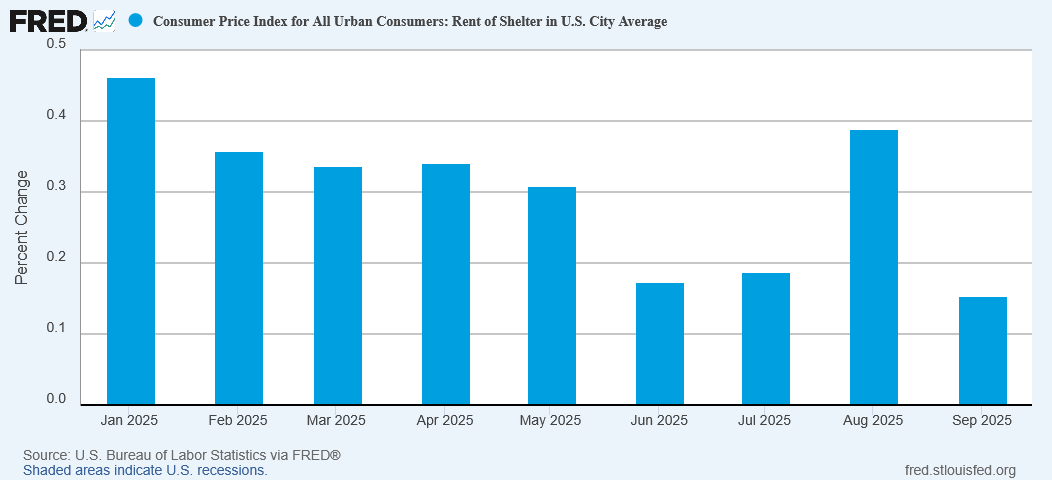
The Consumer Price Index for All Urban Consumers (CPI-U) increased 0.3 percent on a seasonally adjusted basis in September, after rising 0.4 percent in August, the U.S. Bureau of Labor Statistics reported today. Over the last 12 months, the all items index increased 3.0 percent before seasonal adjustment. Note that September CPI data collection was completed before the lapse in appropriations.
The awkward truth, however—again cutting through all the narratives—is that core inflation cooled in September.
The index for all items less food and energy rose 0.2 percent in September, after rising 0.3 percent in each of the 2 preceding months. Indexes that increased over the month include shelter, airline fares, recreation, household furnishings and operations, and apparel. The indexes for motor vehicle insurance, used cars and trucks, and communication were among the few major indexes that decreased in September.
Despite the reflexive victory lap by the White House and the cynical dismissal of the numbers by corporate media, the Consumer Price Index data presents a far more problematic and muddled economic picture—proving once again that the US economy, while not collapsing, is far from thriving.
Whichever way the media wants to spin these numbers, they are sure to be wrong.
What’s the state of the US economy? Based on this data it’s neither boom nor bust. It’s just stuck.
All Narratives Fail
The White House naturally could not resist using the CPI release to push yet again its “Golden Age” narrative.
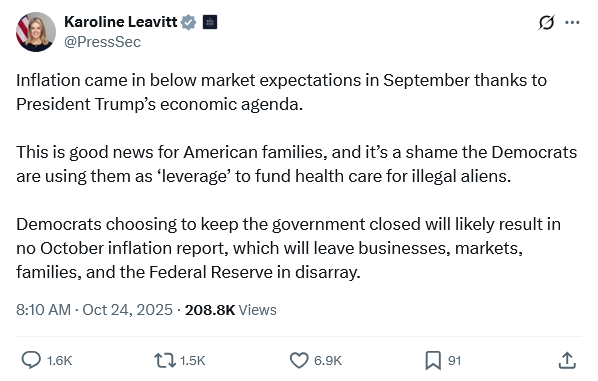
Today’s new Consumer Price Index reveals inflation smashed market expectations once again in September — with prices holding steady and wages beating inflation as President Donald J. Trump ushers America into a new Golden Age.
White House Press Secretary Karoline Leavitt took the expected victory lap on X, while also taking yet another swipe at Democrats over the shutdown.
It is true that year on year inflation came in below Wall Street estimates.
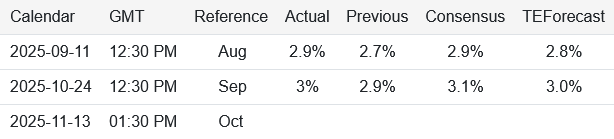
The consensus forecast for September had been for 3.1% year on year inflation, although Trading Economics itself was right on the money with its forecast.
Is coming in a tenth of a percentage point below the consensus projection “smashing” the estimates? Not really, although for Donald Trump hyperbole is only to be expected.
However, what is unstated is that, at 3.02% year on year, headline consumer price inflation is marginally higher than in January when Donald Trump took office, although core inflation is down significantly.
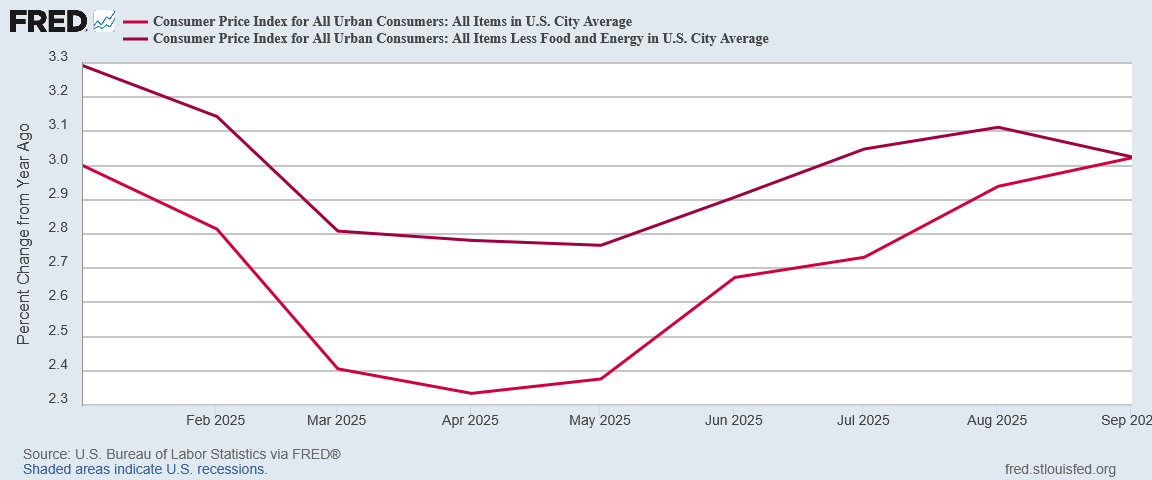
At the same time, both headline and core inflation eased month on month from August.
While the actual numbers contradict the White House narrative on inflation, they also do little to support the more cynical corporate media views.
CBS News, for example, wished to focus on the fact that inflation is still rising, even as it had to walk back its own headline in the lede paragraph.
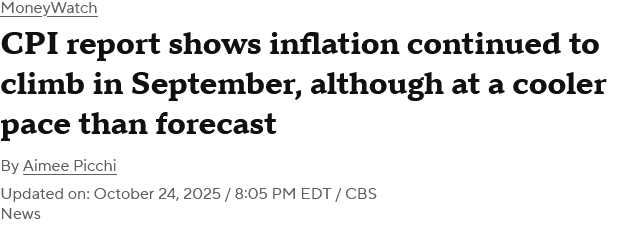
The Consumer Price Index climbed at an annual rate of 3% in September, coming in below economists’ forecasts as the impact of President Trump’s tariffs remain muted.
Further on, CBS News also noted that the Trump Administration made especial effort to release the September CPI data despite the government “shutdown”, so as not to disrupt the annual Social Security Cost-Of-Living-Adjustment (COLA) calculations.
While most federal economic data releases have been suspended during the government shutdown, the Department of Labor is making an exception for the September CPI data. That’s because the inflation rate is needed to determine the Social Security Administration’s annual cost-of-living adjustment for beneficiaries, which is also scheduled to be announced on Friday.
The subtext here is that a government “shutdown” means only what the government wants to shut down actually gets shut down. What the government wants to remain operational remains operational.
How that will play with the American public, with the shutdown as of yesterday at Day 26 and counting, remains to be seen.
Reuters was forced to concede that the CPI data once again does not show the outsized inflationary effects predicted for the Liberation Day tariffs.
The import tariff passthrough has been gradual as businesses worked through inventory accumulated prior to President Donald Trump’s broad duties and also absorbed some of the taxes.
Reuters attempted to dismiss this away by claiming that businesses were defraying the tariff costs by drawing down inventories. However, in addition to the Reuters’ explanation flying in the face of common business practice (businesses price their goods according to replacement cost rather than historical cost), US Census data shows no reduction in either retail or wholesale inventory levels relative to the beginning of the Trump Presidency.
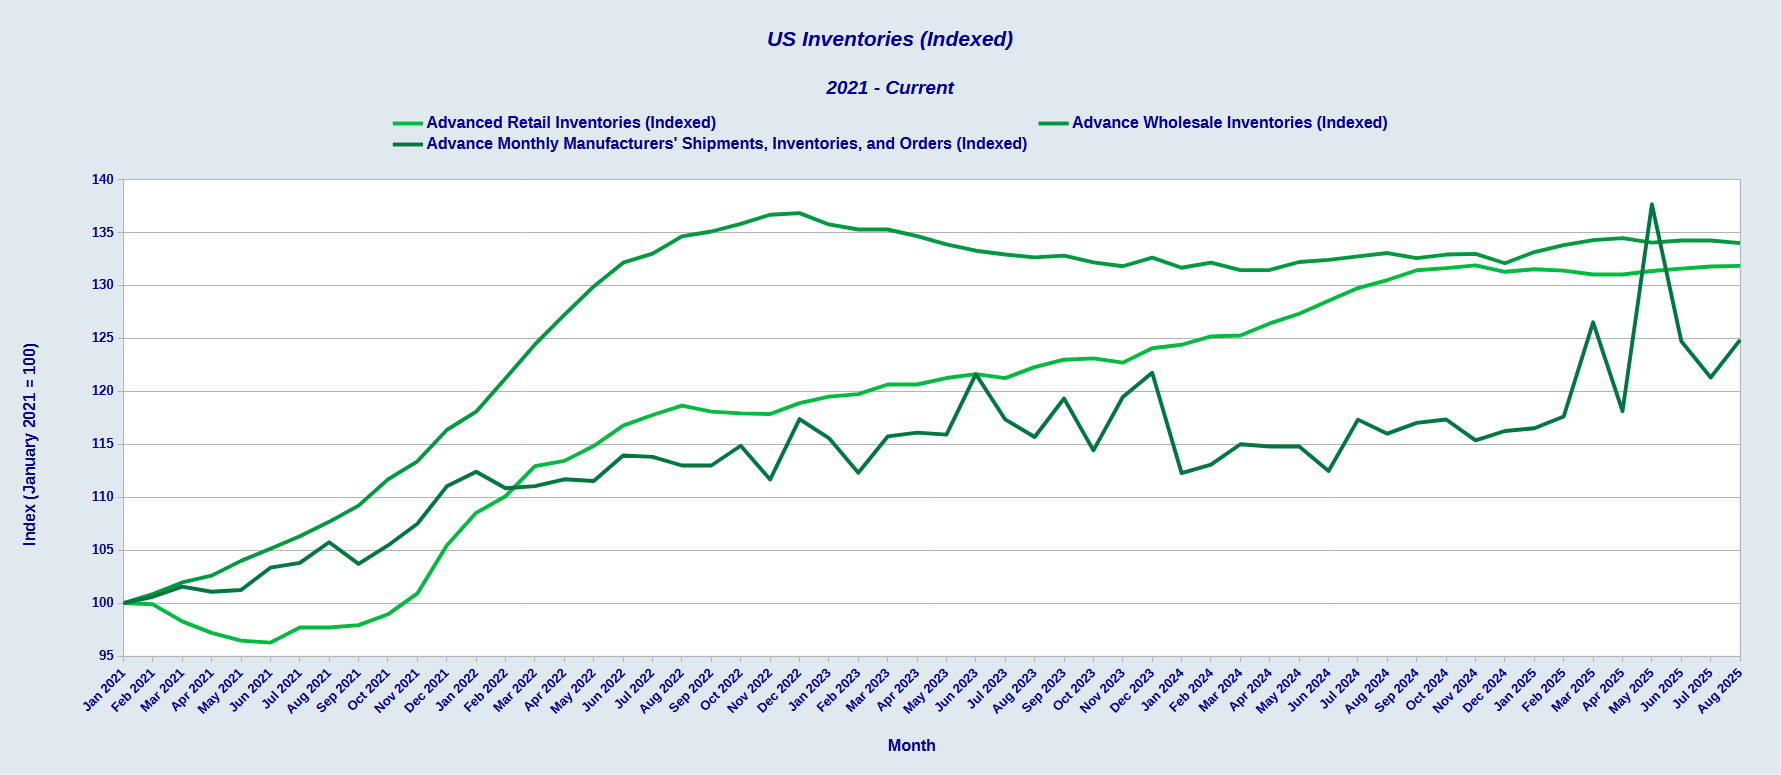
Only the Manufacturers’ Shipments, Inventories, and Orders (M3) Survey shows any major drop in inventory levels, and that is coming after a major inventory build immediately following the announcement of the Liberation Day tariffs.
So far, the effect of the tariffs on inventory levels appears to be negligible.
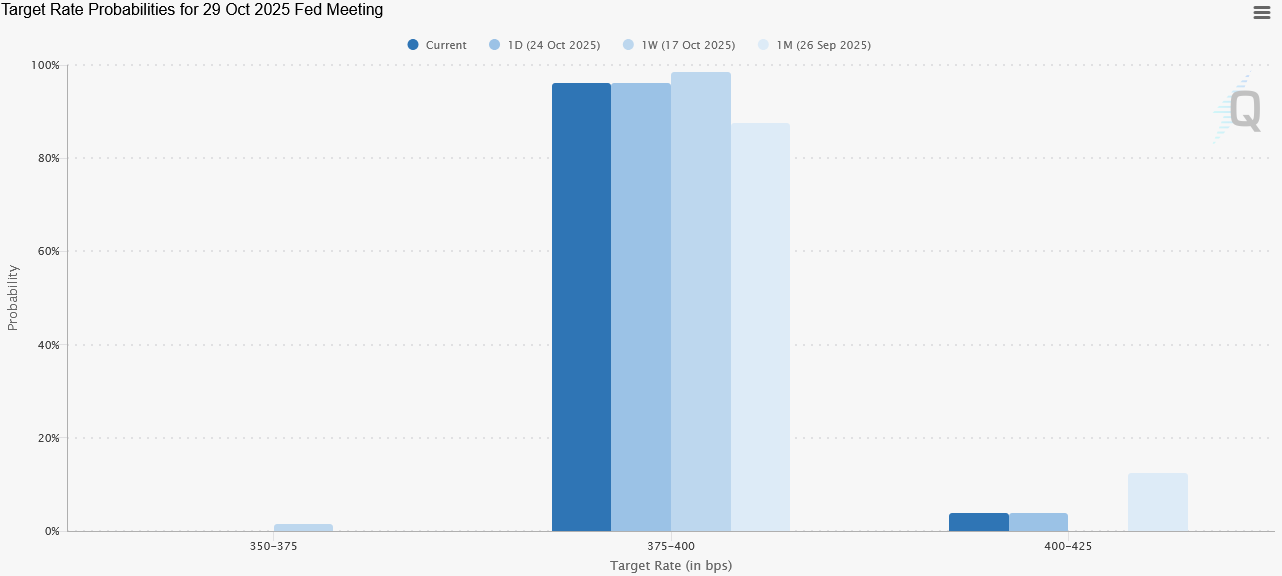
The lack of significant tariff impact on consumer prices also knocks out any support for Federal Reserve Chairman Jay Powell’s rationale for dragging his feet on trimming the federal funds rate. As a result, Wall Street is pricing in another 25bps reduction when the Federal Open Market Committee concludes its October meeting on Wednesday.
There is not a single narrative on the economy or on inflation that is not substantively contradicted by the September inflation data.
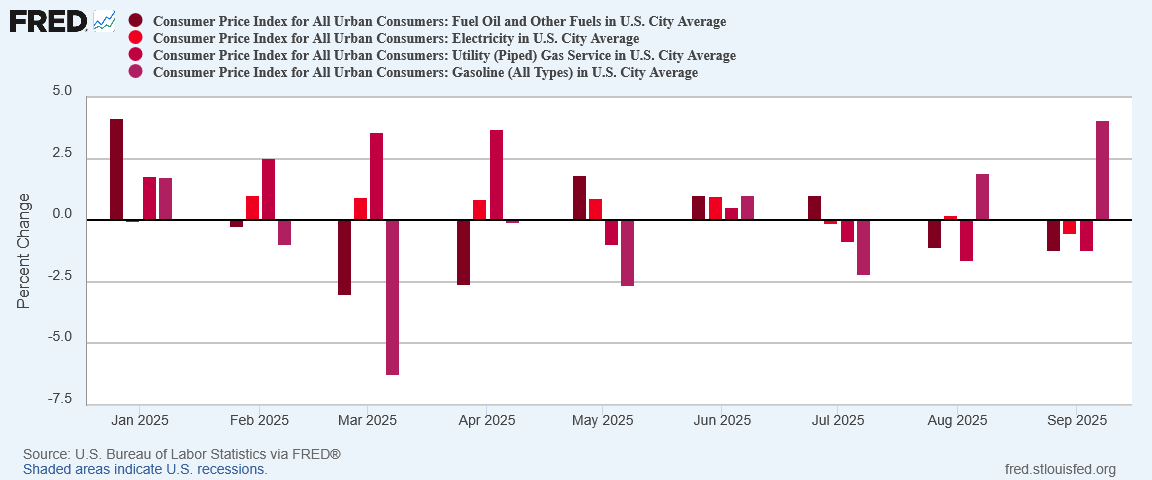
Energy Still Driving Prices Higher
In another knock to the Trump Administration’s “Golden Age” narrative, energy once again was a major driver of headline inflation.
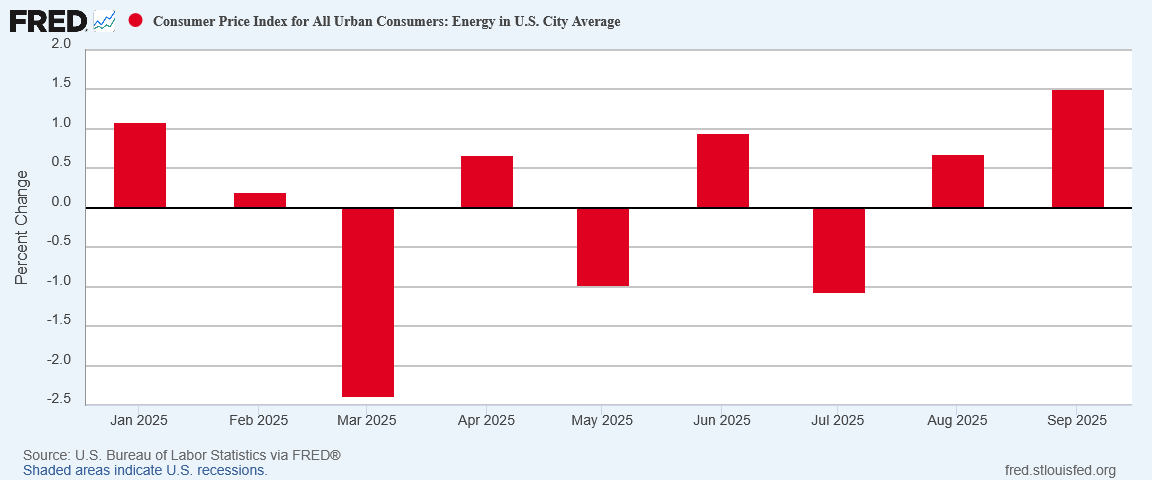
Further, while President Trump has touted lower gasoline prices, and confidently predicted prices at the pump would move lower still, in September gasoline prices were an outsized contributor to energy price inflation.
While gasoline prices are down from recent highs, according to Energy Information Administration data, they are still higher than when Donald Trump took office in January.
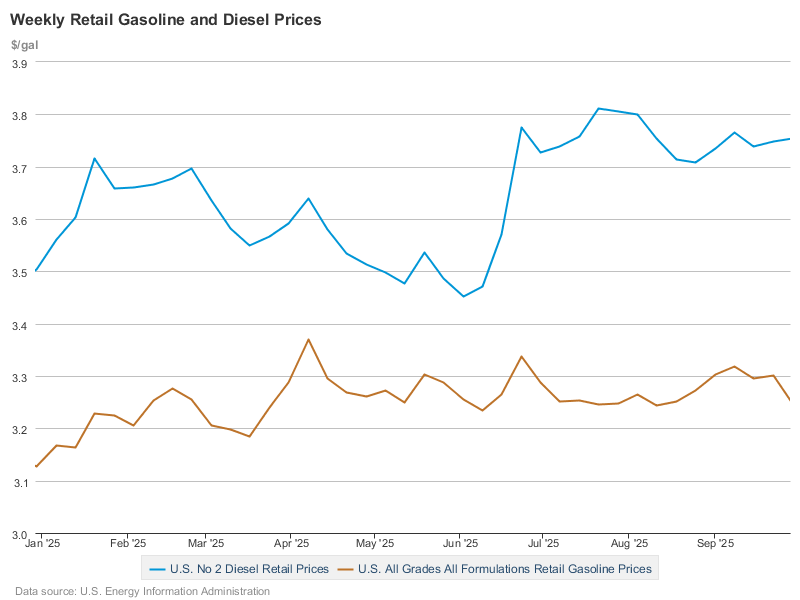
Intriguingly, broad market energy prices mainly moved horizontally in September, making the gas price surge in the CPI even more of an outlier.
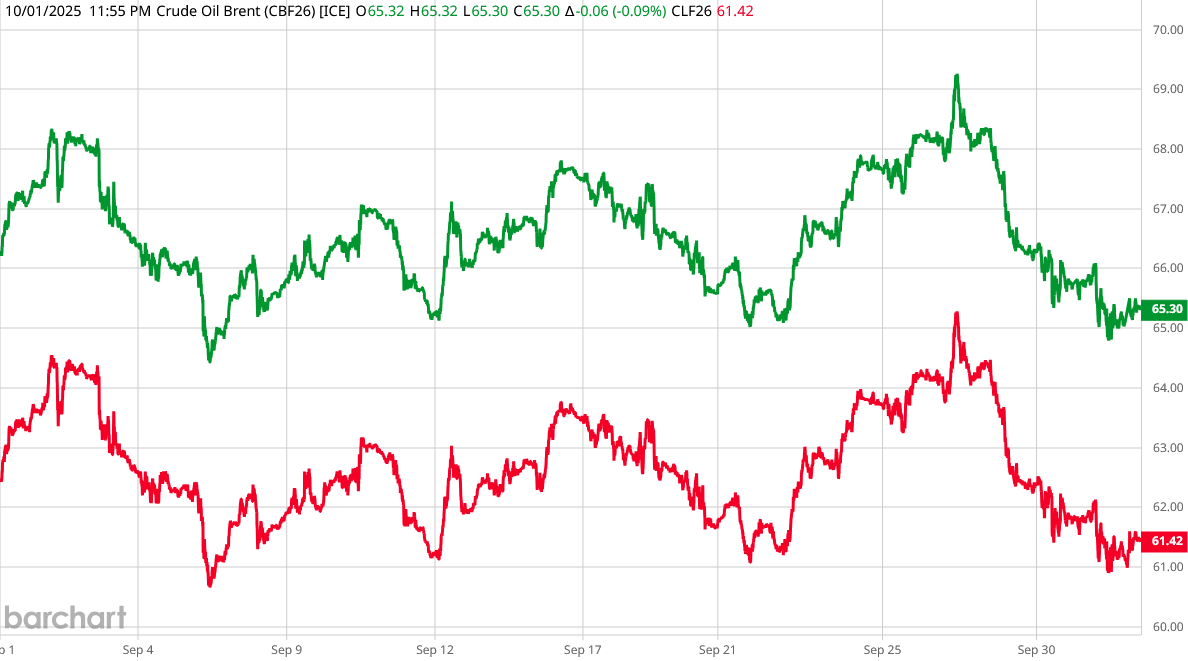
While market price data does not indicate much in the way of energy price inflation for October and beyond, there is no escaping the impact energy prices have had on inflation over the summer.
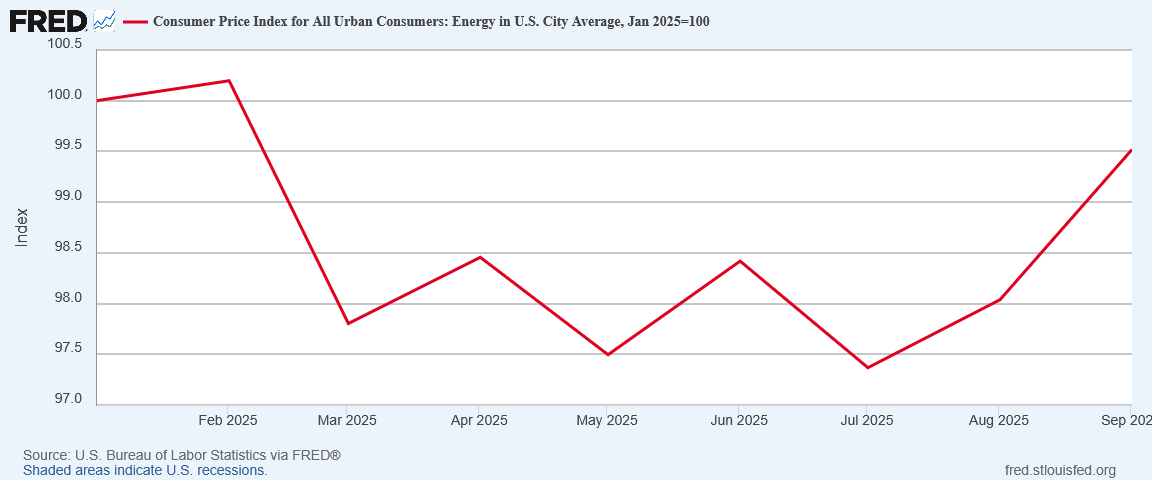
Despite being lower than at the start of Trump’s Presidency, the recent climb in energy prices has pushed headline inflation higher in recent months, so that energy prices are on average with 0.5pp of where they were in January.
If the energy price inflation trend continues, overall consumer price inflation could be about to move significantly higher.
Food Prices Still Climbing
With government food assistance via WIC and SNAP thrown into the hazard due to funding cutoffs from the government “shutdown”, rising food prices is hardly welcome economic news, yet that is what we are facing.
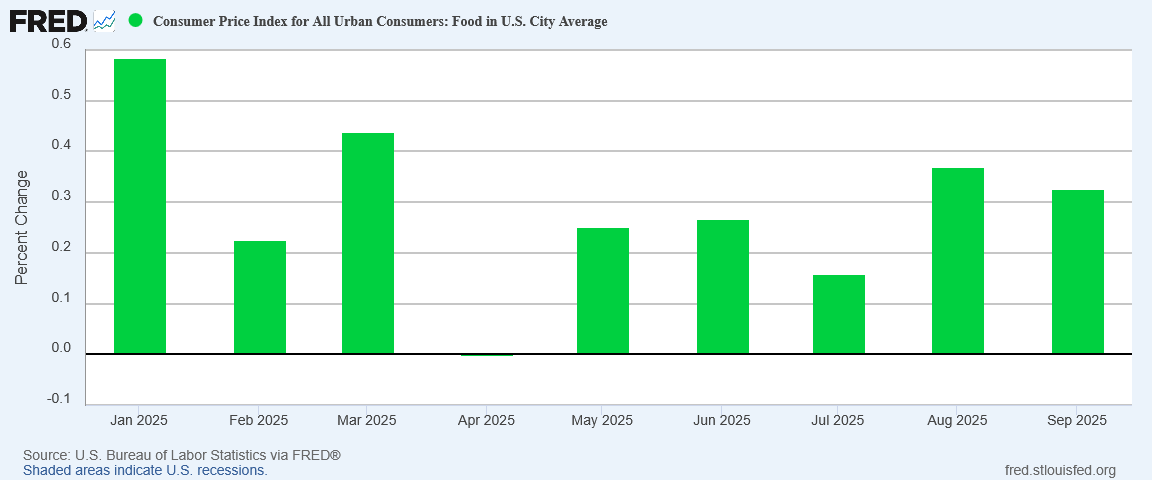
Food price inflation eased slightly in September, but it remains noticeably higher than in April and May, right after the Liberation Day tariffs were announced.
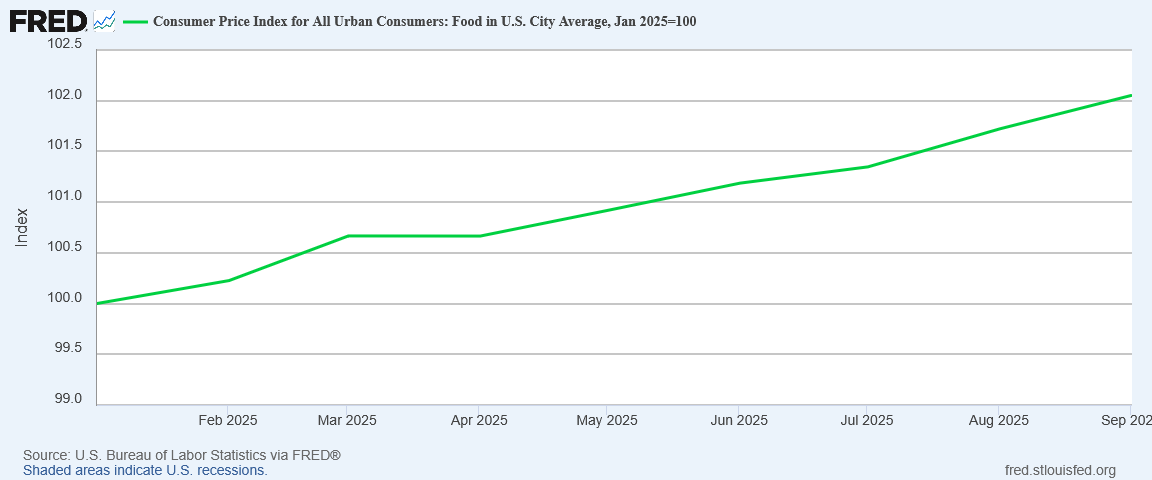
Food prices have been climbing steadily since the start of 2025, in a direct contradiction to President Trump’s “Golden Age” narratives.
However, we must again refrain from assuming tariffs are to blame, as the granular food product data shows different categories contributing to food price inflation in different months.
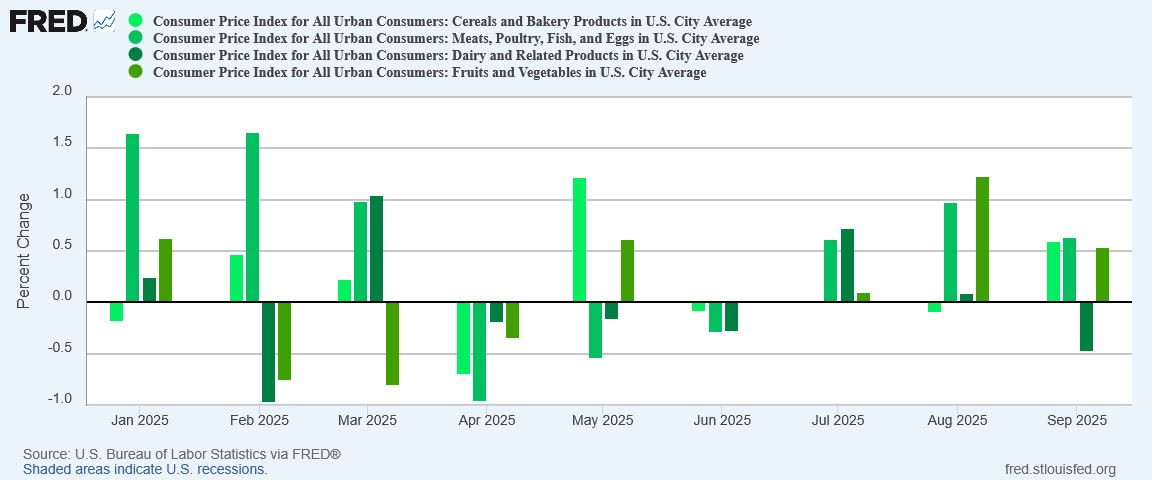
There has been no one consistent driver of food price inflation all year, and every food category has seen some price deflation within the year, even after the Liberation Day tariffs were announced in April.
Still, with each category experiencing months of significant month on month inflation, the cumulative effect has been to push the overall food index consistently higher. The end result to the consumer: higher food bills.
This could prove particularly troublesome if the shutdown disrupts funding of WIC and SNAP benefits next month. With 6 million mothers and young children benefiting from the WIC program, and some 42 million Americans receiving food assistance via SNAP—and both programs are set to remain unfunded next month—those who rely on that assistance for some or all of their monthly food budget are facing a potentially severe grocery shock. Persistent food price inflation is only going to magnify the shock.
Thus far, the looming food-aid “cliff” has not persuaded either Democrats or Republicans to take meaningful steps to resolve their budget disputes and end the shutdown.
Goods And Services Stagflation?
Making the inflation data even more muddled is the appearance of price deflation among durable goods in September, along with rising inflation in non-durable goods and easing inflation in services.


Even shelter price inflation eased significantly in September.
The uncertain goods picture reflects the problematic state of manufacturing output in the US, with the Institute for Supply Management Manufacturing PMI having printed contraction yet again, while S&P Global is printing expansion.


The Service PMI data continues to show a much stronger print for both ISM and S&P Global data.


Not only does durable goods price deflation further undermine the corporate media narratives on tariffs, continued price weakness in durable goods while nondurable goods and services are retaining a measure of inflationary strength raises yet again the possibility of a stagflation scenario in the US economy.
With nothing in September to reverse the ongoing jobs recession in the United States, the lack of price inflation in certain sectors points to a bifurcating economy, where goods production languishes and more economic energy is directed into services.
While we do not have a jobs report from the BLS for September, ADP’s National Employment Report indicated the US economy lost jobs. The BLS data for August shows continued rising joblessness, a trend that extends back to April of 2023.
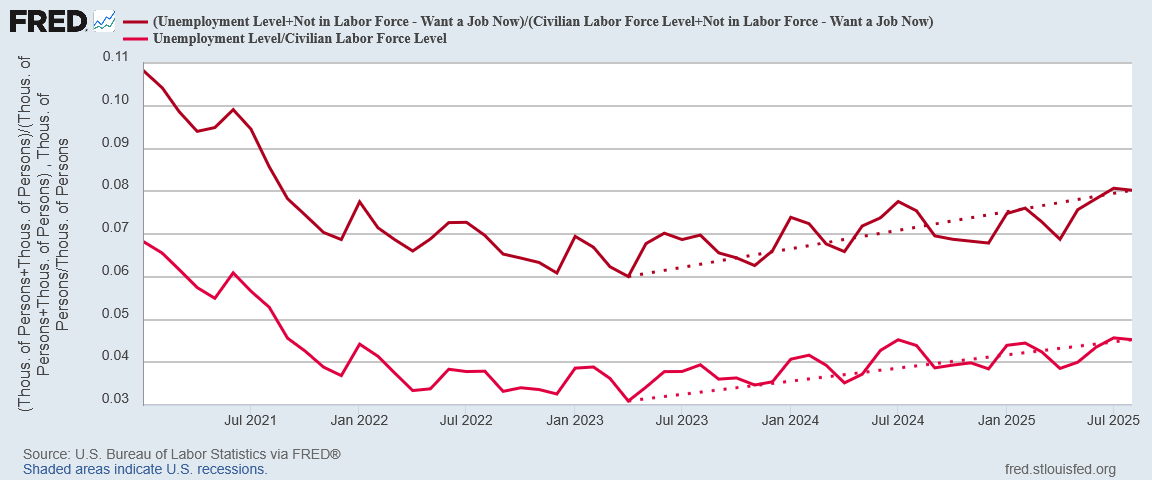
Rising joblessness and rising inflation is the classic stagflation scenario. Anemic goods-producing economic sectors coupled with stronger services sectors could very well be driving the country into that scenario.
That would be the antithesis of a “Golden Age” for virtually all Americans.
Muddled Data Supports No Narrative
The September inflation data has gotten scant attention from the media—corporate and otherwise—and the ongoing soap opera of the government shutdown is only part of the reason why.
The September Consumer Price Index Summary paints a muddled picture of the state of the US economy. Inflation is rising in the United States—energy price inflation in particular—yet core areas such as durable goods are either seeing deflation or disinflation. Food prices are rising overall, but each month different food categories are bearing the worst of it.
Trump’s “Golden Age” narratives get no support from this data.
Corporate media’s anti-Trump narratives get no support from this data. The fearmongering narratives on tariffs in particular are once again repudiated by the data.
Jay Powell’s delusions about the health of the US economy are not supported by this data.
With no easy fit to any of the prevailing narratives, most media types are already looking for other stories besides prices.
Yet inflation remains a concern. Regardless of the reason, headline inflation is rising. Food prices have been rising. Inflation and the US economy were the top concerns in the 2024 election after immigration and it is difficult to see them not being top issues again in the mid-terms if inflation is slipping out of control and job creation is languishing.
The inflation numbers are not extraordinarily “bad”. However, they are, for the most part, not anything “good”.
The inflation numbers show an economy that seems stuck in the doldrums. Not only do they not show the development of a “Golden Age” in the US economy, they show an economy that is not operating nearly at its potential.
The inflation numbers show an economy that is not putting people to work and not bringing prices back within a more realistic proportion of real wages.
The inflation numbers show an economy that is neither booming nor busting, but simply stuck.
The inflation numbers also show that the data is still far more important than the narrative. Narratives do not get formed around “stuck”, even though that’s where we are.
You always do such a great job at this, Peter. And looking on the bright side, I guess the big economic picture could be worse. (I’m still hoping that Trump’s “Golden Age” develops, maybe starting next year.)
But suppose the government shutdown remains in effect for another six weeks or so. People on WIC and SNAP benefits would suffer, and the airline travel industry might plummet if there are few government airline-safety people working. But what else do you see plummeting? Christmas sales, construction, any sector in particular?
And what’s the likelihood that political hack, Powell, will somehow feel a minimal 25 basis points increase is “supported by the overall economic outlook, blah, blah, blah, BS, BS, BS, blather…”