In defending the Federal Open Market Committee’s decision to raise the federal funds rate 25bps despite the past two weeks of banking chaos, Jay Powell reiterated a point made during the initial FOMC press release: the banking system is sound.
With the support of the Treasury, the Federal Reserve Board created the Bank Term Funding Program to ensure that banks that hold safe and liquid assets can, if needed, borrow reserves against those assets at par. This program, along with our long-standing discount window, is effectively meeting the unusual funding needs that some banks have faced and makes clear that ample liquidity in the system is
available. Our banking system is sound and resilient, with strong capital and liquidity. We will continue to closely monitor conditions in the banking system and are prepared to use all of our tools as needed to keep it safe and sound. In addition, we are committed to learning the lessons from this episode and to work to prevent events like this from happening again.
This was a much more emphatic articulation than the FOMC made.
The U.S. banking system is sound and resilient. Recent developments are likely to result in tighter credit conditions for households and businesses and to weigh on economic activity, hiring, and inflation. The extent of these effects is uncertain. The Committee remains highly attentive to inflation risks.
Powell’s insistence that the banking system is sound with plenty of liquidity to protect deposits naturally begs the question “how safe are bank deposits?”
What does the data say?
First, a few definitions are in order.
Under the international Basel III and Basel IV banking standards, banks are measured in terms of their capital adequacy based on the ratio of their Tier 1 and Tier 2 capital to their risk-weighted assets.
Tier 1 capital1 is a bank’s core capital.
Tier 1 capital refers to the core capital held in a bank's reserves and is used to fund business activities for the bank's clients. It includes common stock, as well as disclosed reserves and certain other assets. Along with Tier 2 capital, the size of a bank's Tier 1 capital reserves is used as a measure of the institution's financial strength.
Regulators require banks to hold certain levels of Tier 1 and Tier 2 capital as reserves, in order to ensure that they can absorb large losses without threatening the stability of the institution. Under the Basel III accord, the minimum Tier 1 capital ratio was set at 6% of a bank's risk-weighted assets.
The Tier 1 capital ratio2 is simply the ratio of Tier 1 capital to the bank’s assets weighted for risk levels.
The tier 1 capital ratio is the ratio of a bank’s core tier 1 capital—that is, its equity capital and disclosed reserves—to its total risk-weighted assets. It is a key measure of a bank's financial strength that has been adopted as part of the Basel III Accord on bank regulation.
The tier 1 capital ratio measures a bank’s core equity capital against its total risk-weighted assets—which include all the assets the bank holds that are systematically weighted for credit risk. For example, a bank’s cash on hand and government securities would receive a weighting of 0%, while its mortgage loans would be assigned a 50% weighting.
A bank is in trouble under the Basel III standards if its Tier 1 capital is less than 6% of its risk assets (loans, securities, et cetera).
For the purpose of calculating the Basel III Tier 1 Capital ratio one weights assets by risk, and then divides the Tier 1 capital by that amount.
Coverage ratios3 are the ratios of a company’s assets to its liabilities, and measure a company’s ability to pay its bills and satisfy its debts using its various assets.
The asset coverage ratio is a financial metric that measures how well a company can repay its debts by selling or liquidating its assets. The asset coverage ratio is important because it helps lenders, investors, and analysts measure the financial solvency of a company. Banks and creditors often look for a minimum asset coverage ratio before lending money.
How do US banks stack up with regards to these ratios?
Because US banks, like all modern banks, employ fractional reserve banking, most of a banks reserves are not held as deposits but are instead deployed in various investment strategies—loans, the purchase and resale of debt securities, et cetera.
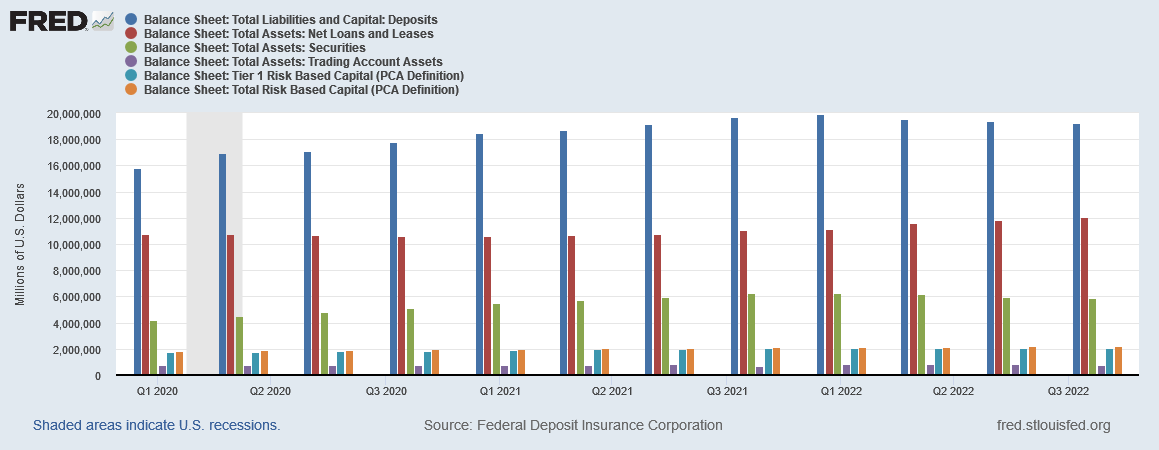
Thus the capital outlook for US banks looks like this:
Note: deposits are a liability to a bank, as they represents funds that on demand must be returned to the depositor, and thus are an obligation of the bank. Your cash is an asset to you and a liability to your bank.
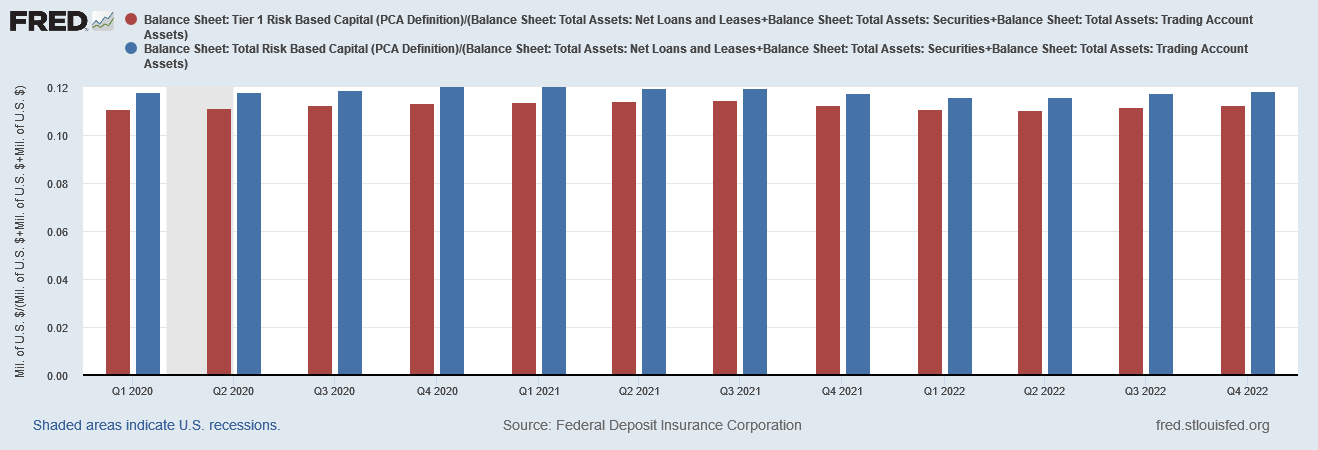
While formal calculation of the Tier 1 capital ratio requires weighting a bank’s assets according to risk, we can still get a thumbnail approximation of that ratio by adding the risk assets shown above and dividing the Tier 1 capital by that amount.
With a ratio of 11.2% to 11.8%, the US banking system is well capitalized under Basel III standards (again, this is not the exact ratio as I am not performing risk weighting for the various assets in question).
If the banking system is well capitalized, how did Silicon Valley Bank fail?
For that answer we turn to coverage ratios, which allow us to measure liquidity. Having a superabundance of capital is meaningless if a bank does not have access to the cash needed to satisfy depositors’ demand for their money. Separate from Tier 1 capital, then, is the need to be able to liquidate assets to raise the necessary cash to meet depositor demands.
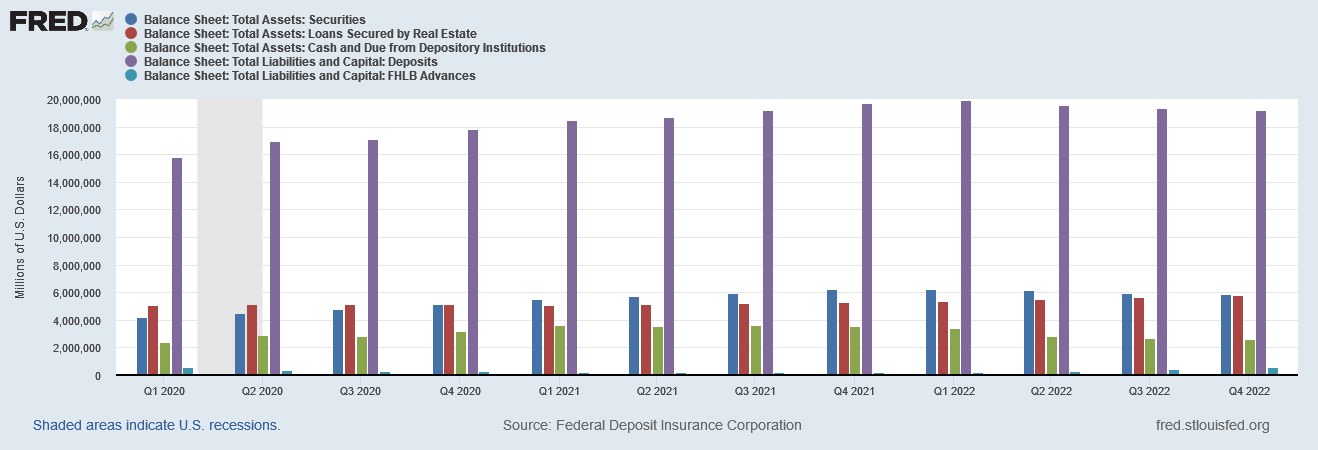
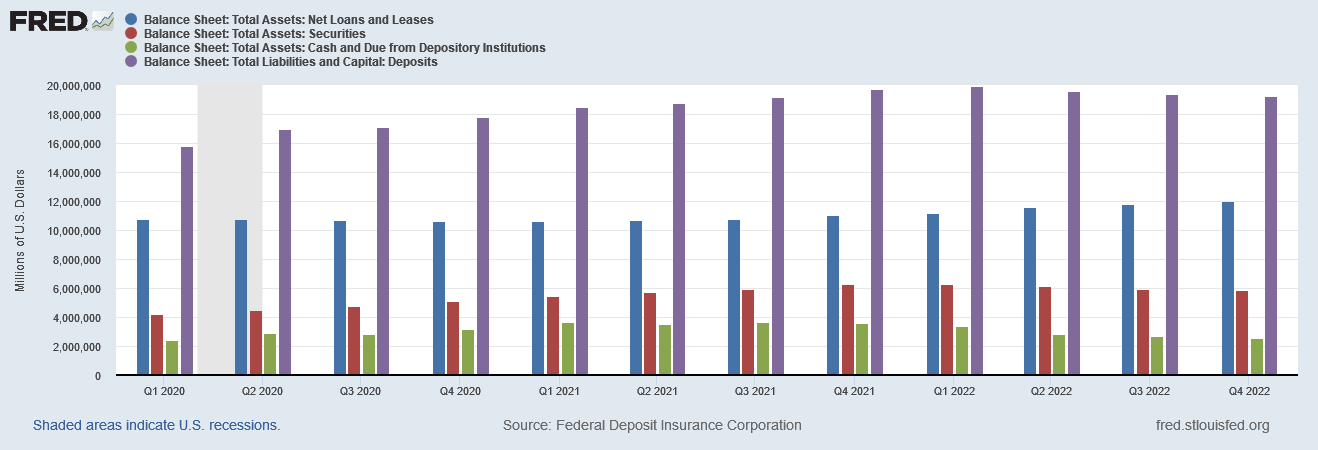
The deposits outlook for the US banking system looks like this:
This….is a little less comforting.
Here we are comparing assets which may be readily resold and converted to cash. Thus we’re looking at collateralized loans or securities. Because it stands out in the FDIC source material, we also include the amount of FHLB advances, as these are loans from Federal Home Loan Banks to member banks specifically to cover deposit demands which cannot be timely met with cash or by liquidating securities.
What stands out here?
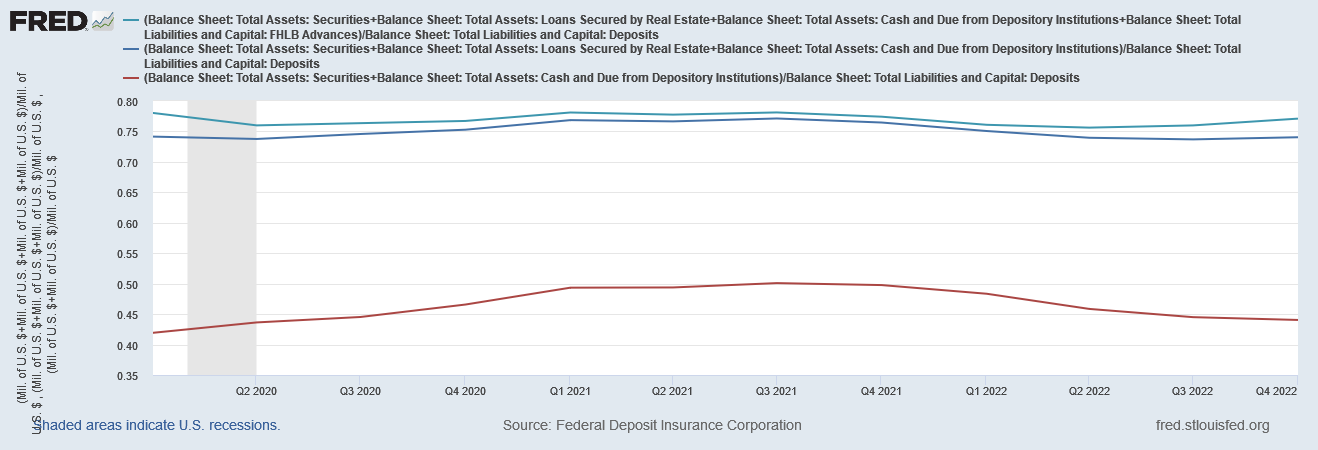
Even a brief glanced shows there are far more deposits than there are cash, outstanding loans to customers, securities, and FHLB loans to the bank to fully cover all deposits. If we look at these items in terms of coverage ratios, the inadequacy begins to take shape.
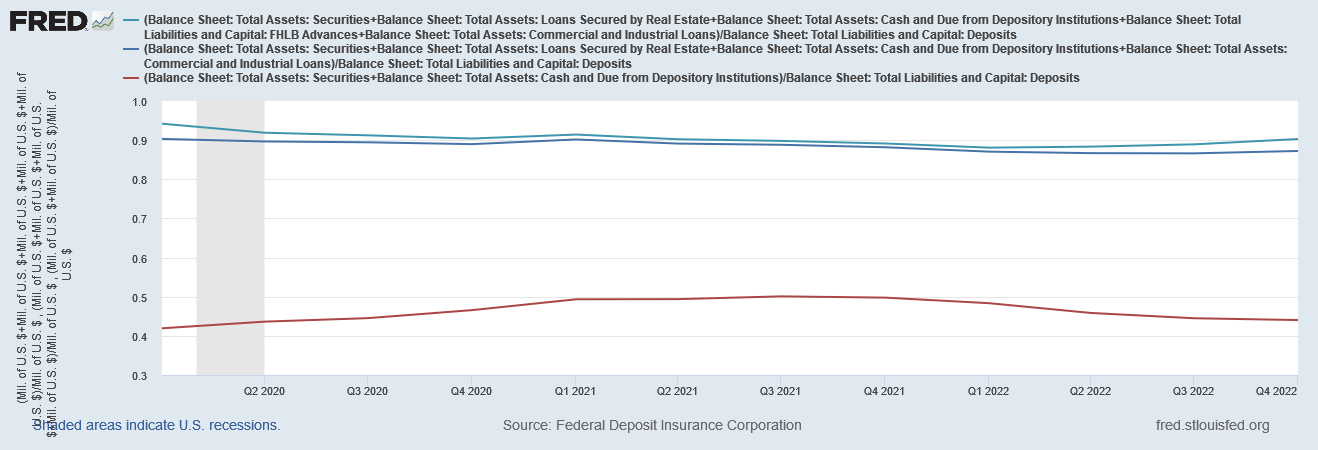
Taking all loans, securities, cash, and FHLB advances into account, banks have in easily liquidated assets (or FHLB advances) only about 77% of total deposits.
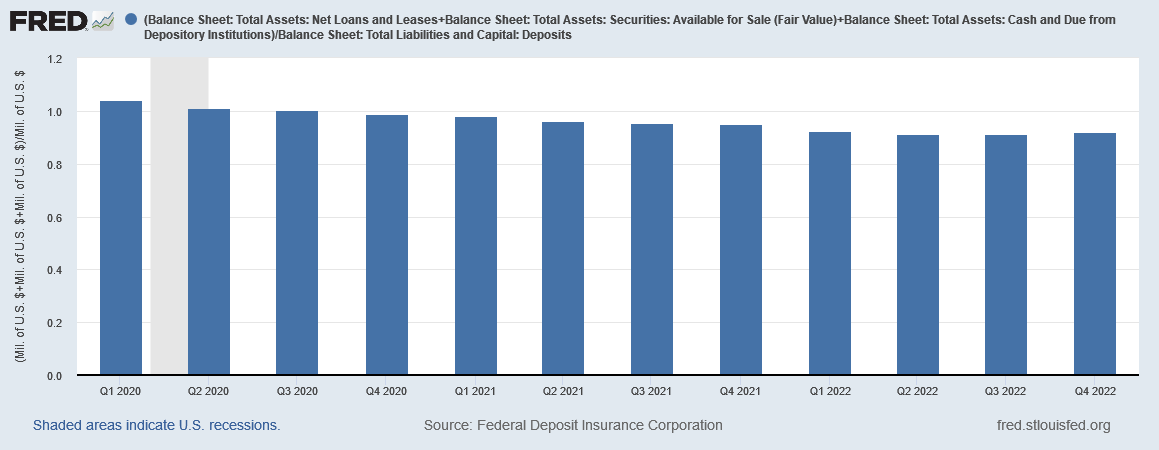
The outlook is much improved if we include commercial loans as well.
With or without FHLB advances we immediately have a much improved ratio, where the overall ratio is north of 90%.
In the event of a total run on deposits, banks can cover roughly 90% of depositor demands.
This tracks with Erica Jiang’s research4 from earlier this month showing banks sitting on some $2 Trillion of unrealized losses on their debt securities and loans.
Marked-to-market bank assets have declined by an average of 10% across all the banks, with the bottom 5th percentile experiencing a decline of 20%.
However, 90% is still not 100%. In the event of a total run on the US banking system (a singularly improbable likelihood, as depositors would have to put their money “somewhere”), the US banking system would struggle to secure sufficient cash to cover depositor demands. On a strictly definitional basis, there is already a liquidity concern here.
Is the banking system therefore already in liquidity crisis? No.
The above ratios focus on the most easily liquidated assets of a bank—various real estate loans and debt securities. It does not consider every loan banks have on their books. That is a substantially different outlook.
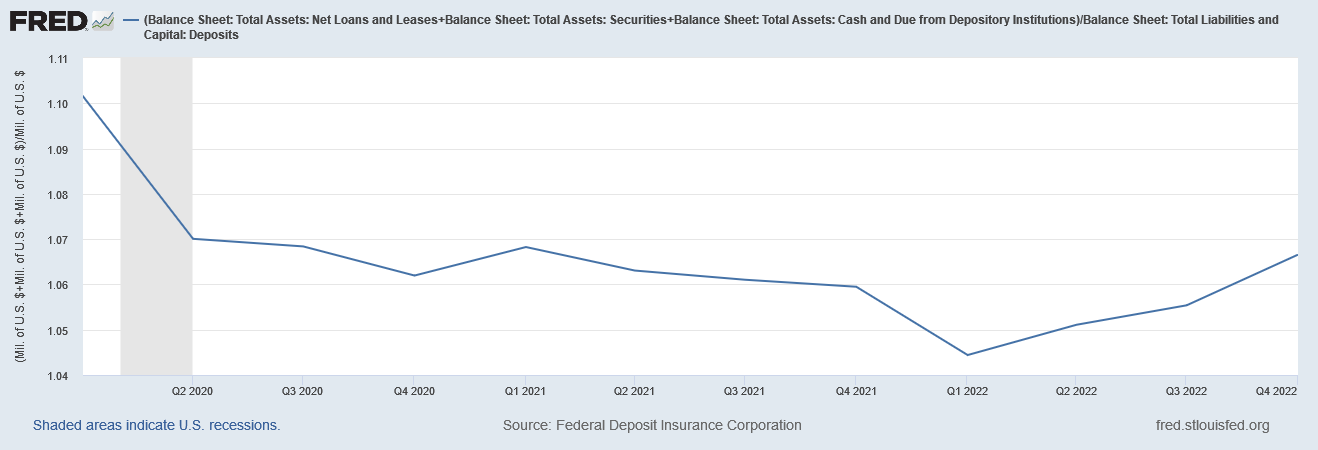
If we look at the total loans banks have on the books, the coverage ratio improves dramatically.
If the entire banking system were faced with a bank run, and all loans had to be liquidated, at 106% of deposits there are more than enough assets to cover deposits.
However, the difference between total loans and the loans identified above is the relative ease with which they can be resold into a secondary market. Consumer loans and credit card debt, to the extent they are unsecured by any collateral, are going to have a lower fair market value than loans against property or debt securities, and may take longer to liquidate than real estate loans or securities portfolios.
Indeed, the reality of fair market value is where the crux of the liquidity concern comes in.
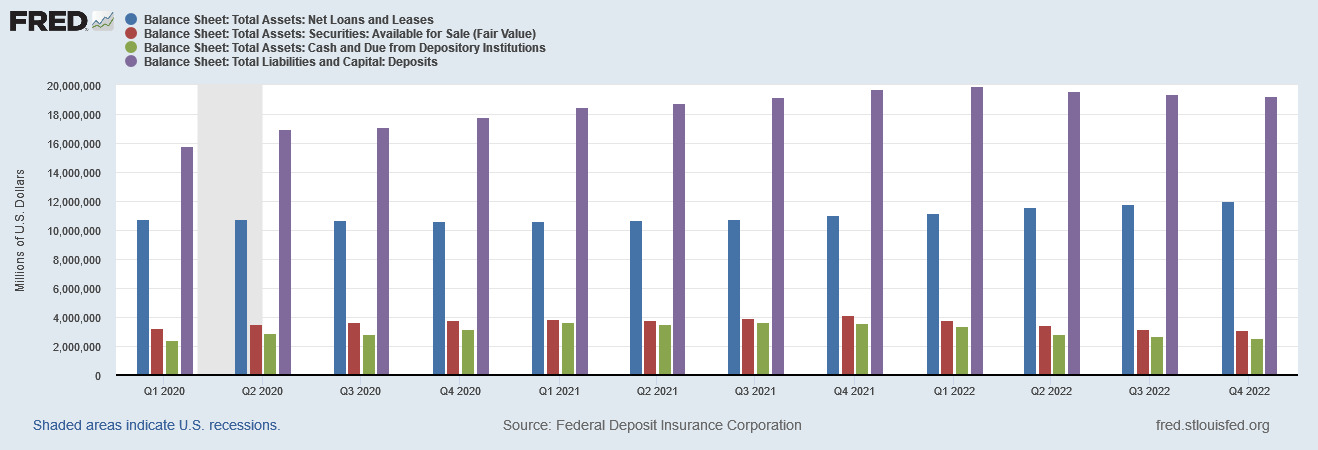
If we exclude securities held-to-maturity from our analysis, the outlook for banks darkens again.
Without the HTM securities, the banking system no longer has enough assets to cover depositor demands, and the coverage ratio slips back under 100%.
This becomes relevant because, from an accounting perspective, HTM securities do not accrue unrealized gains and losses, while available-for-sale securities are routinely marked to market and carried at fair market value. HTM securities are carried at amortized cost.
If the securities are truly held to maturity and allowed to roll off the books, no losses need be recorded, as the asset will produce the income and capital streams which are expected. However, should the HTM securities need to be liquidated, they will be liquidated at fair market value, not their amortized cost as shown on the balance sheet.
This is where the FDIC notes that banks have $620 Billion in unrealized losses on US Treasuries. This is where Erica Jiang has identified $2 Trillion in unrealized losses across all bank asset classes—a good many loans would also incur losses were they to be sold in a secondary market. And this is the huge question hanging over the banking industry today—how quickly do banks need to liquidate assets to satisfy depositor demands?
If all bank assets in the US banking system were liquidated in an orderly fashion, with sales handled prudentially to preserve asset value, the banking system has more than enough assets to cover deposits. In that scenario, your deposits are safe.
Unfortunately, if there is a fire sale and assets are sold for whatever can be immediately obtained, which will be less than what would otherwise be obtained, then there might not be enough assets to cover deposits. In a fire sale your deposits might very well be toast.
Grant, M. “Tier 1 Capital: Definition, Components, Ratio, and How It’s Used”, Investopedia. 13 Mar. 2023, https://www.investopedia.com/terms/t/tier1capital.asp.
Hayes, A. “Tier 1 Capital Ratio: Definition and Formula for Calculation”, Investopedia. 20 Nov. 2020, https://www.investopedia.com/terms/t/tier-1-capital-ratio.asp.
Kenton, W. “Asset Coverage Ratio: Definition, Calculation, and Example”, Investopedia. 29 Mar. 2022, https://www.investopedia.com/terms/a/assetcoverage.asp.
Jiang, E., et al. “Monetary Tightening and U.S. Bank Fragility in 2023: Mark-to-Market Losses and Uninsured Depositor Runs?” SSRN, 2023, https://papers.ssrn.com/sol3/papers.cfm?abstract_id=4387676.


"Tier 1 capital ratio was set at 6% of a bank's risk-weighted assets."
And interestingly enough, the Treasuries that now constitute a substantial portion of certain banks' underwater assets have a risk weighting of 0, meaning they aren't counted in the Tier 1 capital ratio at all.
"Your cash is an asset to you and a liability to your bank."
Waxing pedantic here: Although I have substantial bank deposits, I don't consider bank deposits to be cash. The cash in my pocket and in my 'mattress' isn't a liability to my bank. Yes, I'm an old fart who actually still carries cash on my person at all times and has some additional physical cash stockpiled.
Another excellent column, Mr. Kust! You’ve answered the questions simmering on the back burner of my brain. You have a real talent for explaining things to those of us who are not financial professionals- thank you!