


The key points to remember about the June Consumer Price Index Summary can be summed up in a single word: Deflation.
Most prices fell last month. Those sectors not in outright deflation month on month showed significant disinflation.

The Consumer Price Index for All Urban Consumers (CPI-U) decreased 0.4 percent on a seasonally adjusted basis in June after rising 0.5 percent in May, the U.S. Bureau of Labor Statistics reported today. This decline in the all items index was the largest 1-month decrease since April 2020 when it fell 0.8 percent. Over the last 12 months, the all items index increased 3.5 percent before seasonal adjustment.
Headline inflation, core inflation, energy, and both durable and non-durable goods all printed deflation month on month in June. Last month was the month when literally all the prices fell.
Wall Street Was Expecting Good News, But Not This Good
The drop in prices across the board was unexpected. Wall Street had projected 3.8% year on year headline inflation, and the Trading Economics Forecast had been 3.9%.

The CPI Summary printed headline inflation at 3.5% year on year.
Core inflation was anticipated to be 2.9% year on year, the same yearly inflation rate as in May.

The CPI Summary printed core inflation at 2.6% year on year.
Even the Cleveland Fed’s inflation nowcast had projected higher numbers than what was reported yesterday by the BLS.
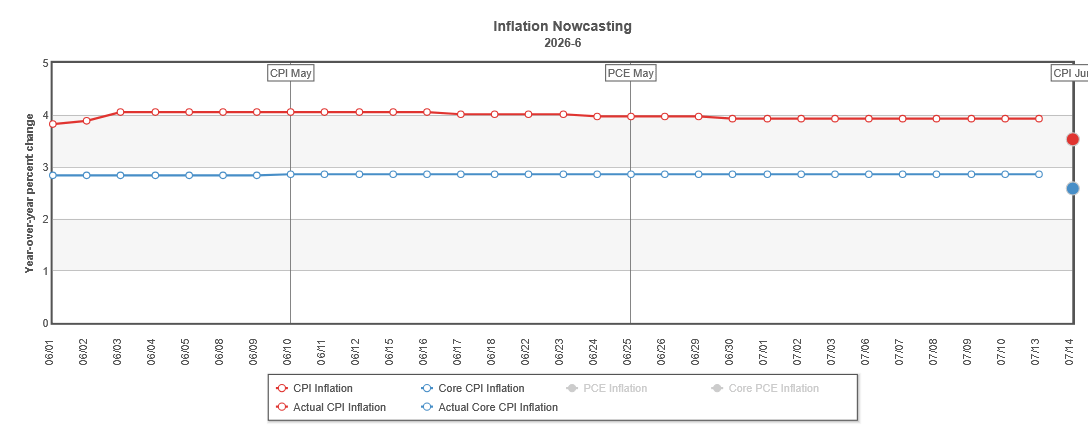
Wall Street and corporate media “experts” were anticipating good news in the June inflation report, but they were not expecting the news to be this good.
Economists forecast that falling gas prices will turn the June Consumer Price Index negative, but that doesn’t mean the coast is clear for inflation just yet. Stripping out volatile food and energy prices should show inflation remains well above the Federal Reserve’s target on an annual basis, according to economists.
Still, economists say the good news is that inflation pressures have at least stabilized, and the surge of oil prices earlier in 2026 does not appear to have spread beyond the most energy-sensitive portions of the economy. The question is how other variables in the inflation picture may improve.
Naturally, the enthusiasm over unequivocal economic good news produced a bit of gaslighting as well—why confine oneself to facts when there is the opportunity for propaganda? The prospect of outright deflation in the CPI report led to a few exaggerated headlines:
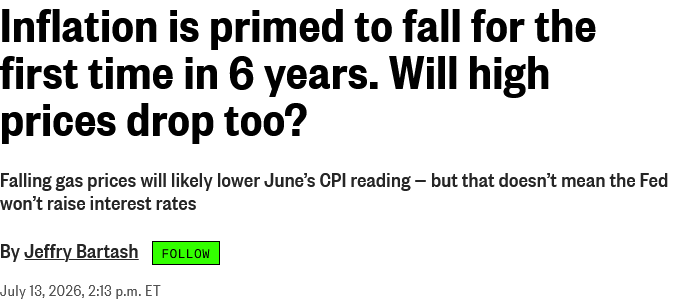
In reality, the last time the CPI report printed outright deflation was in June of 2024.
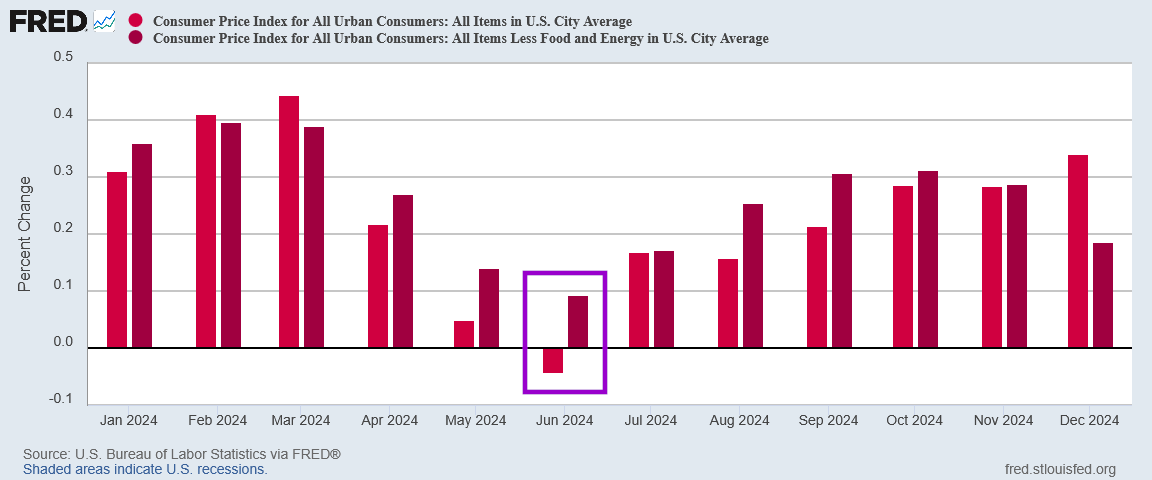
Not even Common Core Math can squeeze six years in between then and now.
Wall Street expected good news, and Wall Street got even better news. That does not happen very often.
Deflation Month On Month, Disinflation Year On Year
Month on month, the headline price drop was a fairly substantial 0.4%—the largest decline in headline prices since the COVID Pandemic Panic in 2020, when prices fell 0.8% month on month
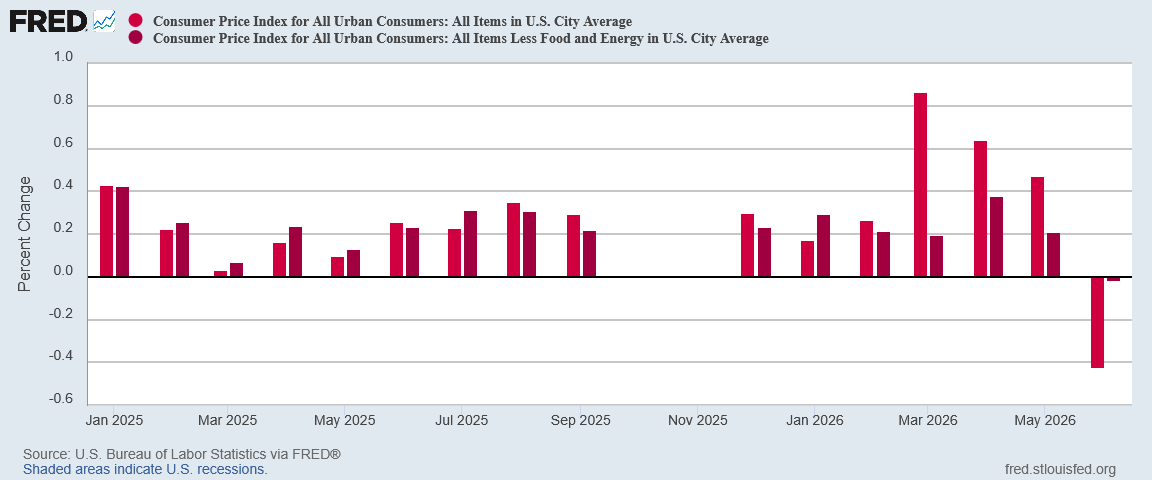
Core inflation mostly held steady, slipping a miniscule 0.02% month on month.
The month on month price decline also produced major disinflation year on year, with headline inflation printing at 3.5%.
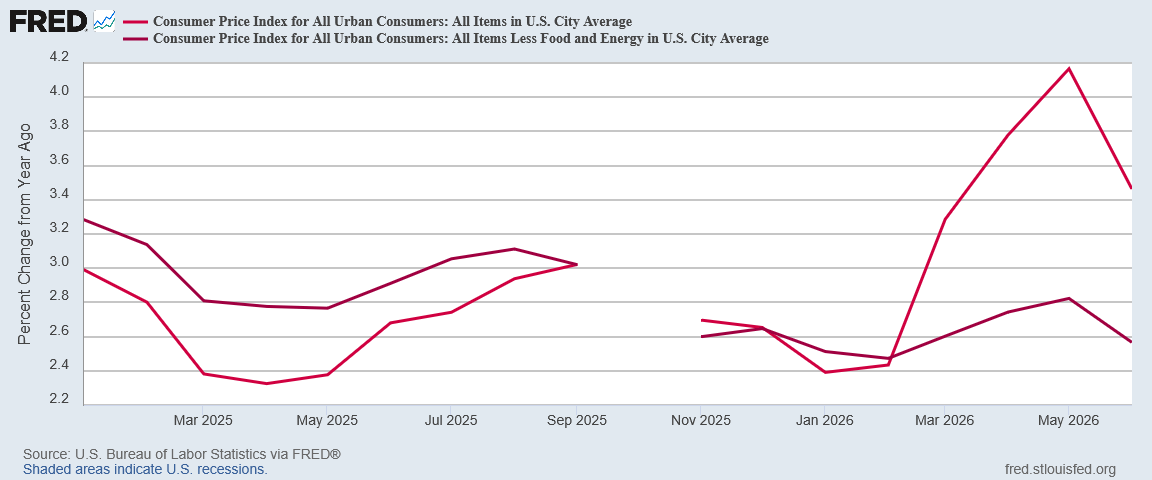
Core inflation cooled to 2.6%.
The price drop very nearly erased all year on year inflation for the past three months. At 3.5% year on year inflation is above where it was in March of this year, but it is substantially below where the inflation numbers were just in April.
Energy Prices Way Down
While energy price deflation has been a recurring theme in the CPI report, June was the first month in quite a while when there was a significant decline in energy prices.
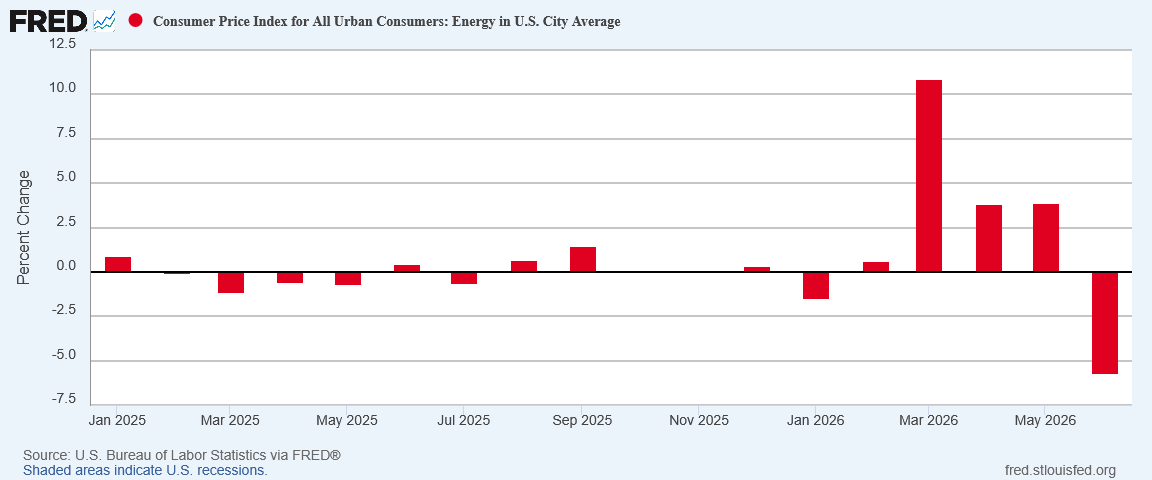
With a decline of 5.7% month on month, energy prices captured the largest month on month drop since the COVID Pandemic Panic.
As might be expected from such a large drop, virtually all energy price index components showed deflation for June.
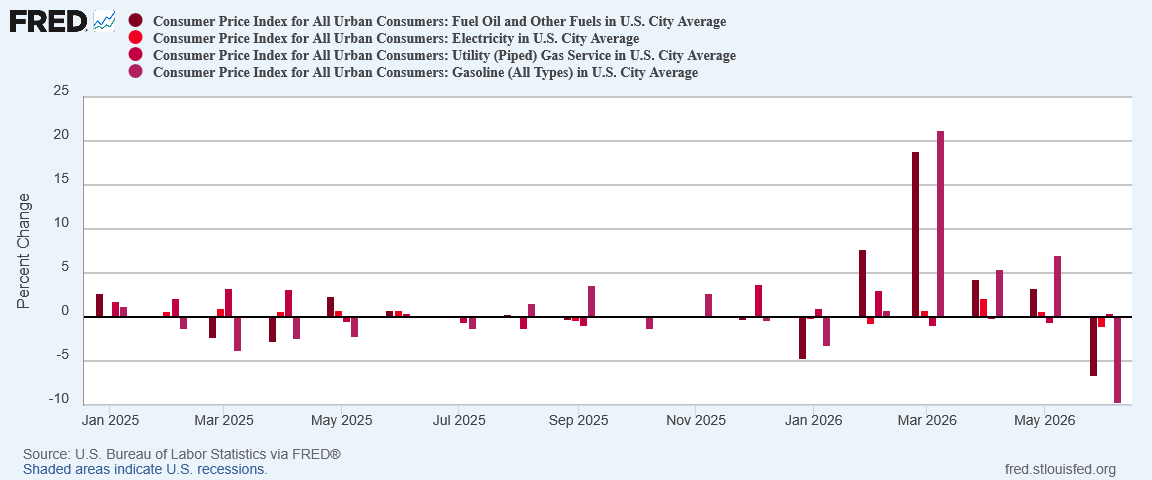
Only piped natural gas showed any increase in prices.
The other volatile measure in headline inflation is food. Food was the one portion of consumer prices where the month on month inflation rate actually increased.
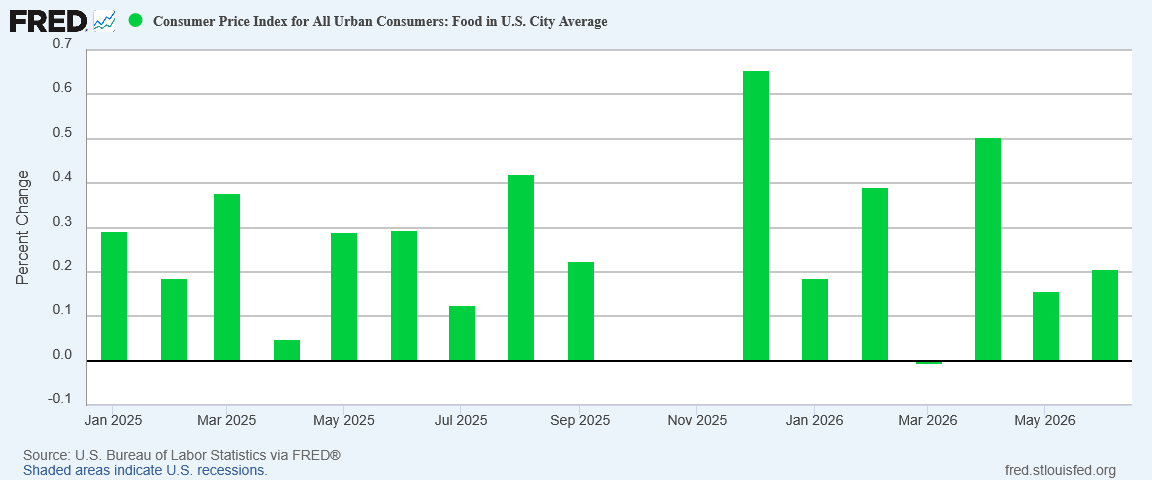
While food price inflation increased month on month in June, that rise did not even come close to offsetting the declines in energy prices.
Durable Goods Prices Continued To Drop
The only reason durable goods prices falling in June is not by itself a major news item is because durable goods have been dropping month on month since last fall.
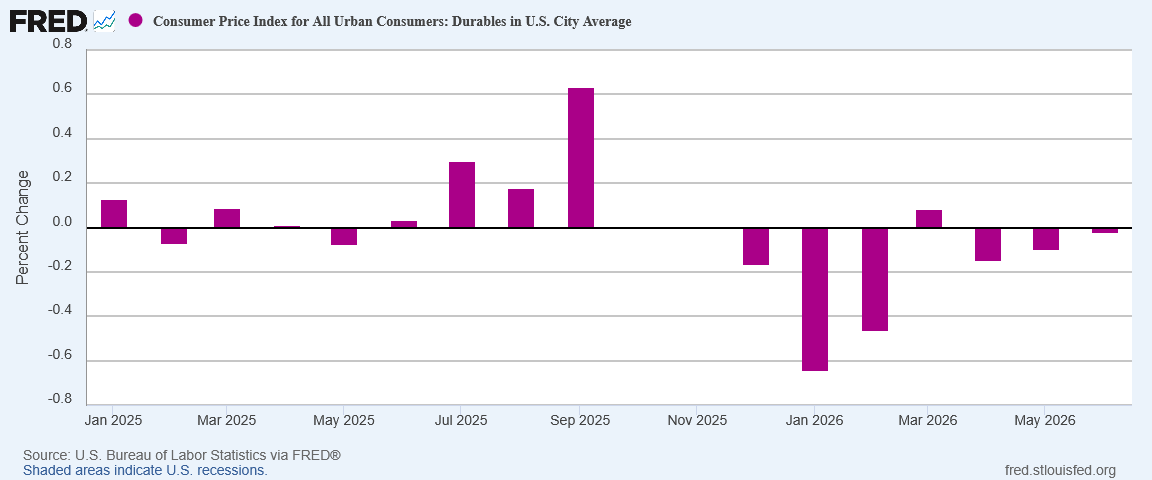
Far more notable is that nondurable goods printed deflation month on month as well.
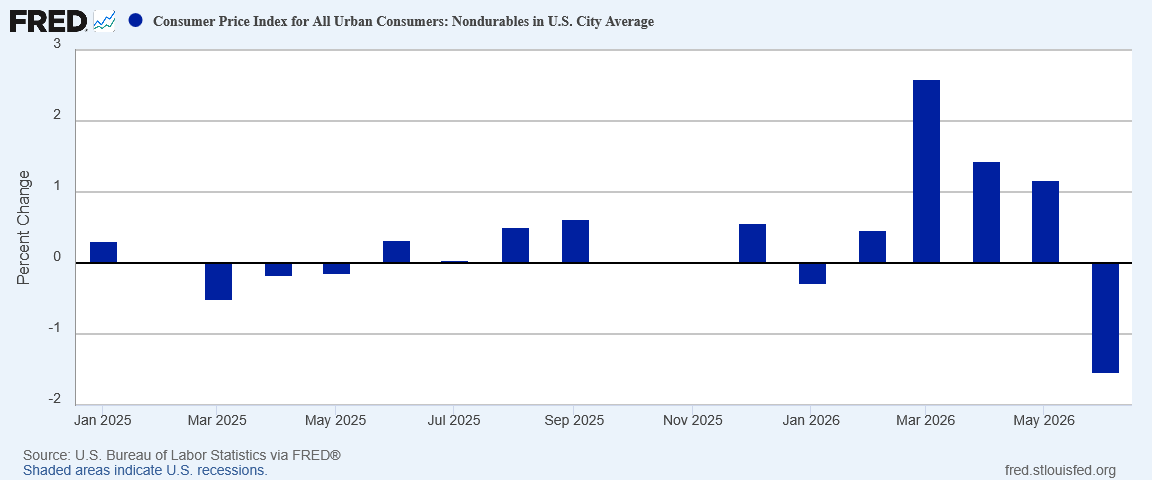
Even before prices started rising in March, nondurable goods prices had been trending higher. Yesterday’s CPI print was the first decline since January, and the largest decline since the COVID Pandemic Panic.
When we compare energy prices to nondurable goods prices, we can easily see why nondurable goods are down:
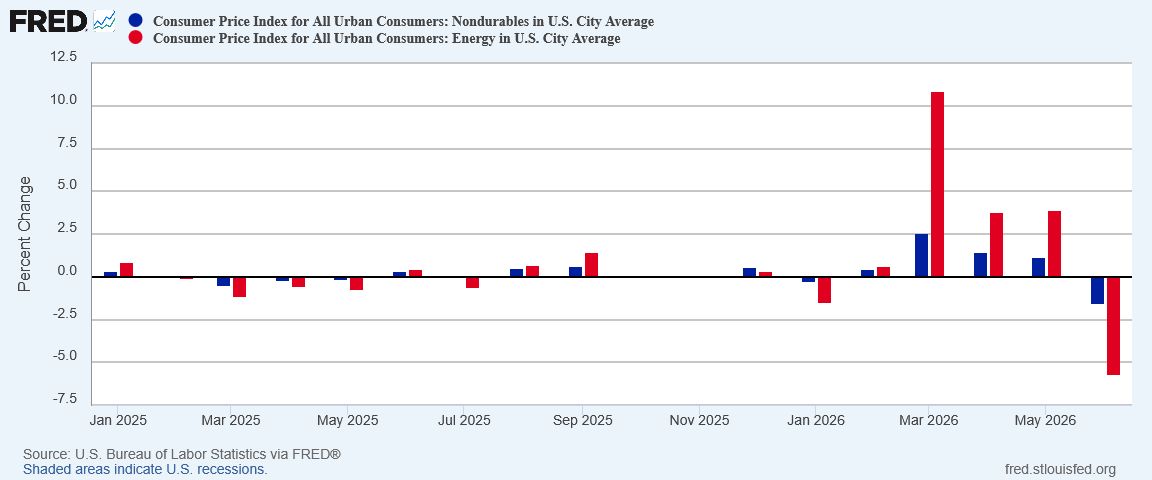
Energy prices have driven nearly all the recent change in nondurable goods prices. Energy has been driving nondurable goods prices up, and in June energy drove nondurable goods prices down.
Even services printed a sliver of deflation in June.
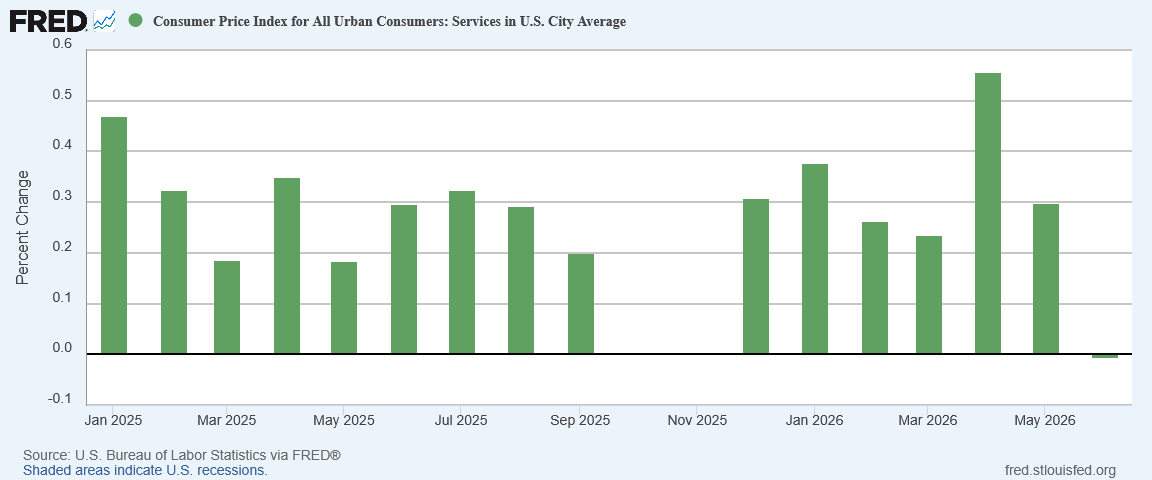
While nowhere near as large as the declines during the Pandemic Panic, that service prices dropped at all is noteworthy; service prices have been trending up in recent months.
The only part of core inflation which stayed positive for June was shelter price inflation.
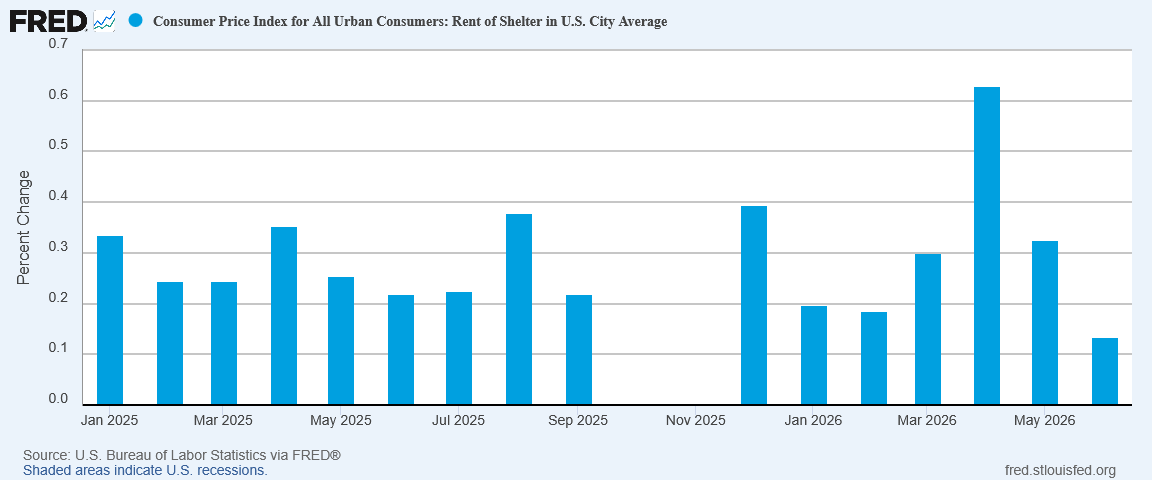
However, at .13% month on month, housing prices printed the smallest month on month increase since October of 2022.
Even the forward-looking Zillow Observed Rent Index (ZORI) showed some cooling in June.
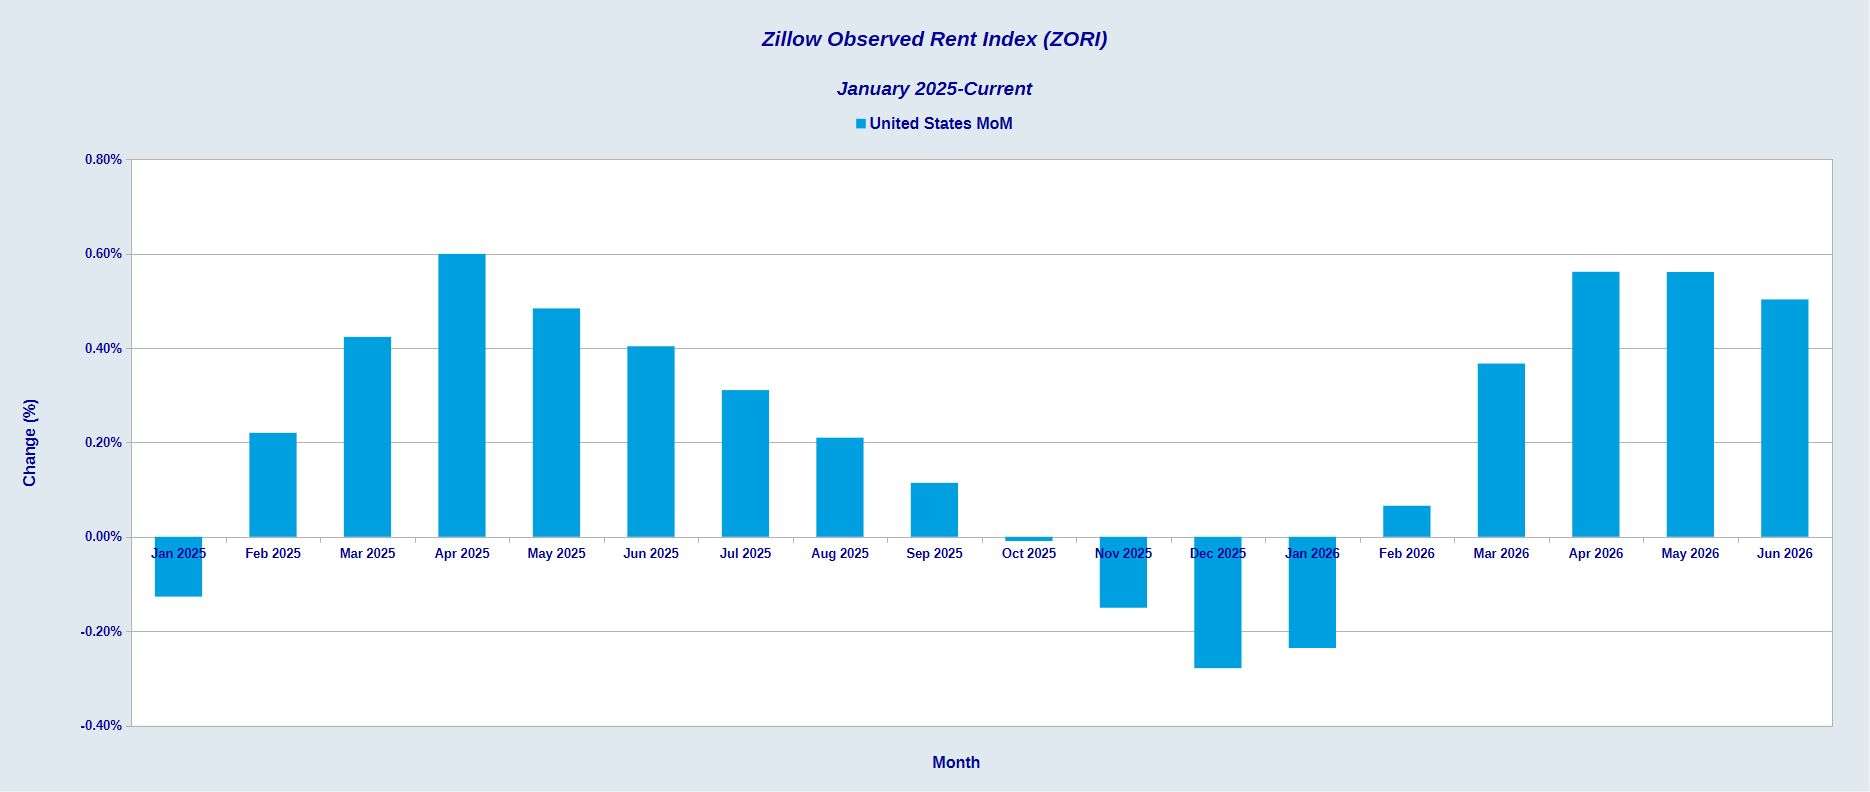
There was not a single segment of the CPI data set where there was not at least significant disinflation, with most segments printing outright deflation.
Stagflation Never Emerged
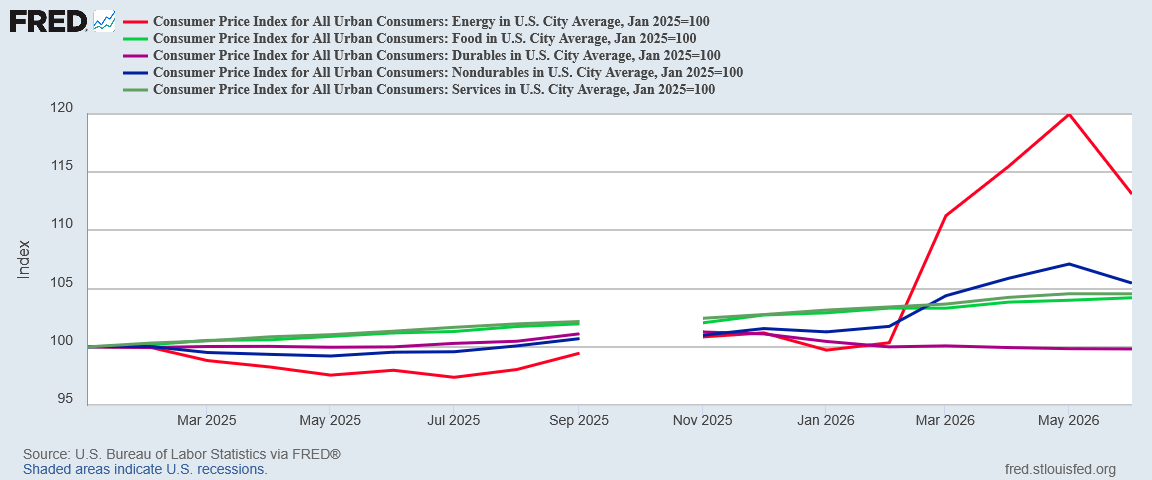
Perhaps most encouraging in the June price drop is that the energy price and supply shock from March never really translated into a stagflation crisis.
While energy prices rose dramatically beginning in March, that price rise never moved beyond energy prices. If we index the segments of the CPI data set to January of 2025, we quickly see that the surge in energy prices had little observable effect on other price segments.
Nor do we see the energy price surge showing any influence on other prices if we index from 2021 onward.
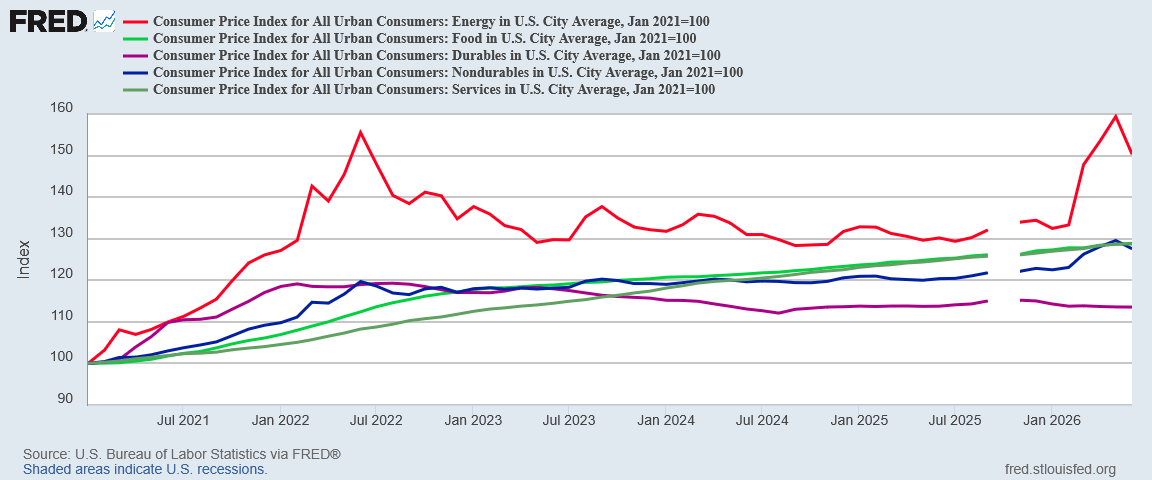
The deflation among durable goods is a trend extending as far back as January 2022. The general upward trends in food and service prices has not been impacted much if at all by energy prices. Only nondurable goods shows any influence from energy prices at all, but that is due to energy prices being also a subset of nondurable goods. Outside of energy prices, nondurable goods showed no inflationary trend.
While there is always a concern that a supply shock can produce significant consumer price inflation while also boosting unemployment, the classic toxic brew of stagflation that defined consumer price trends during the 1970s, that scenario simply never materialized.
Not Going To Last
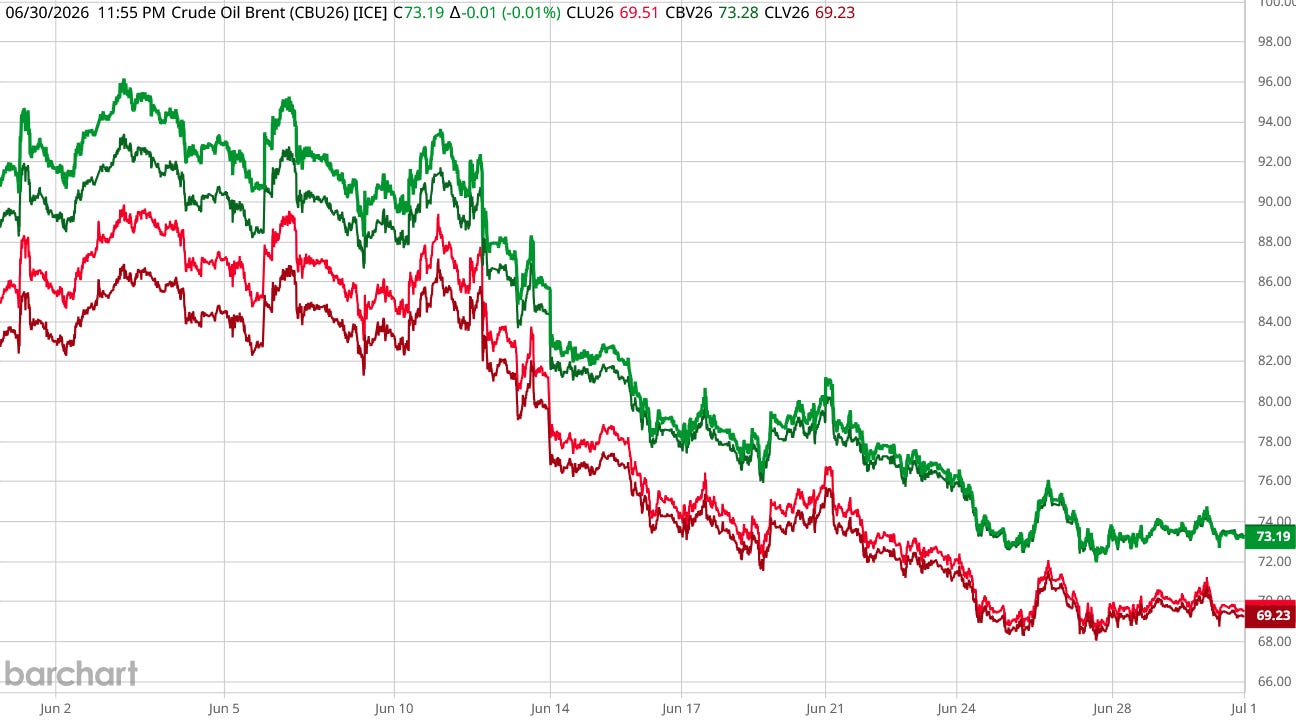
There is no mystery why energy prices are in deflation for June: energy prices on the open market dropped in June, after their spring surge.
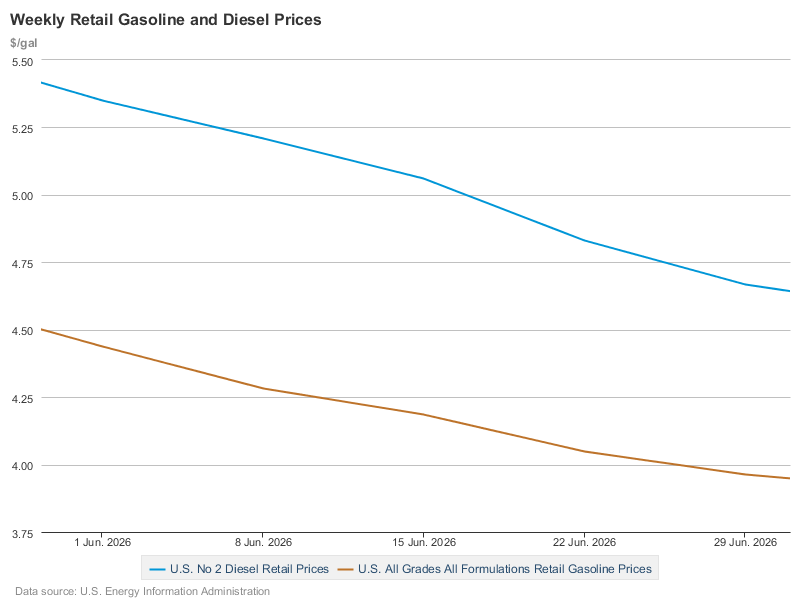
Fuel prices followed suit, with both diesel and gasoline prices at the pump heading south.
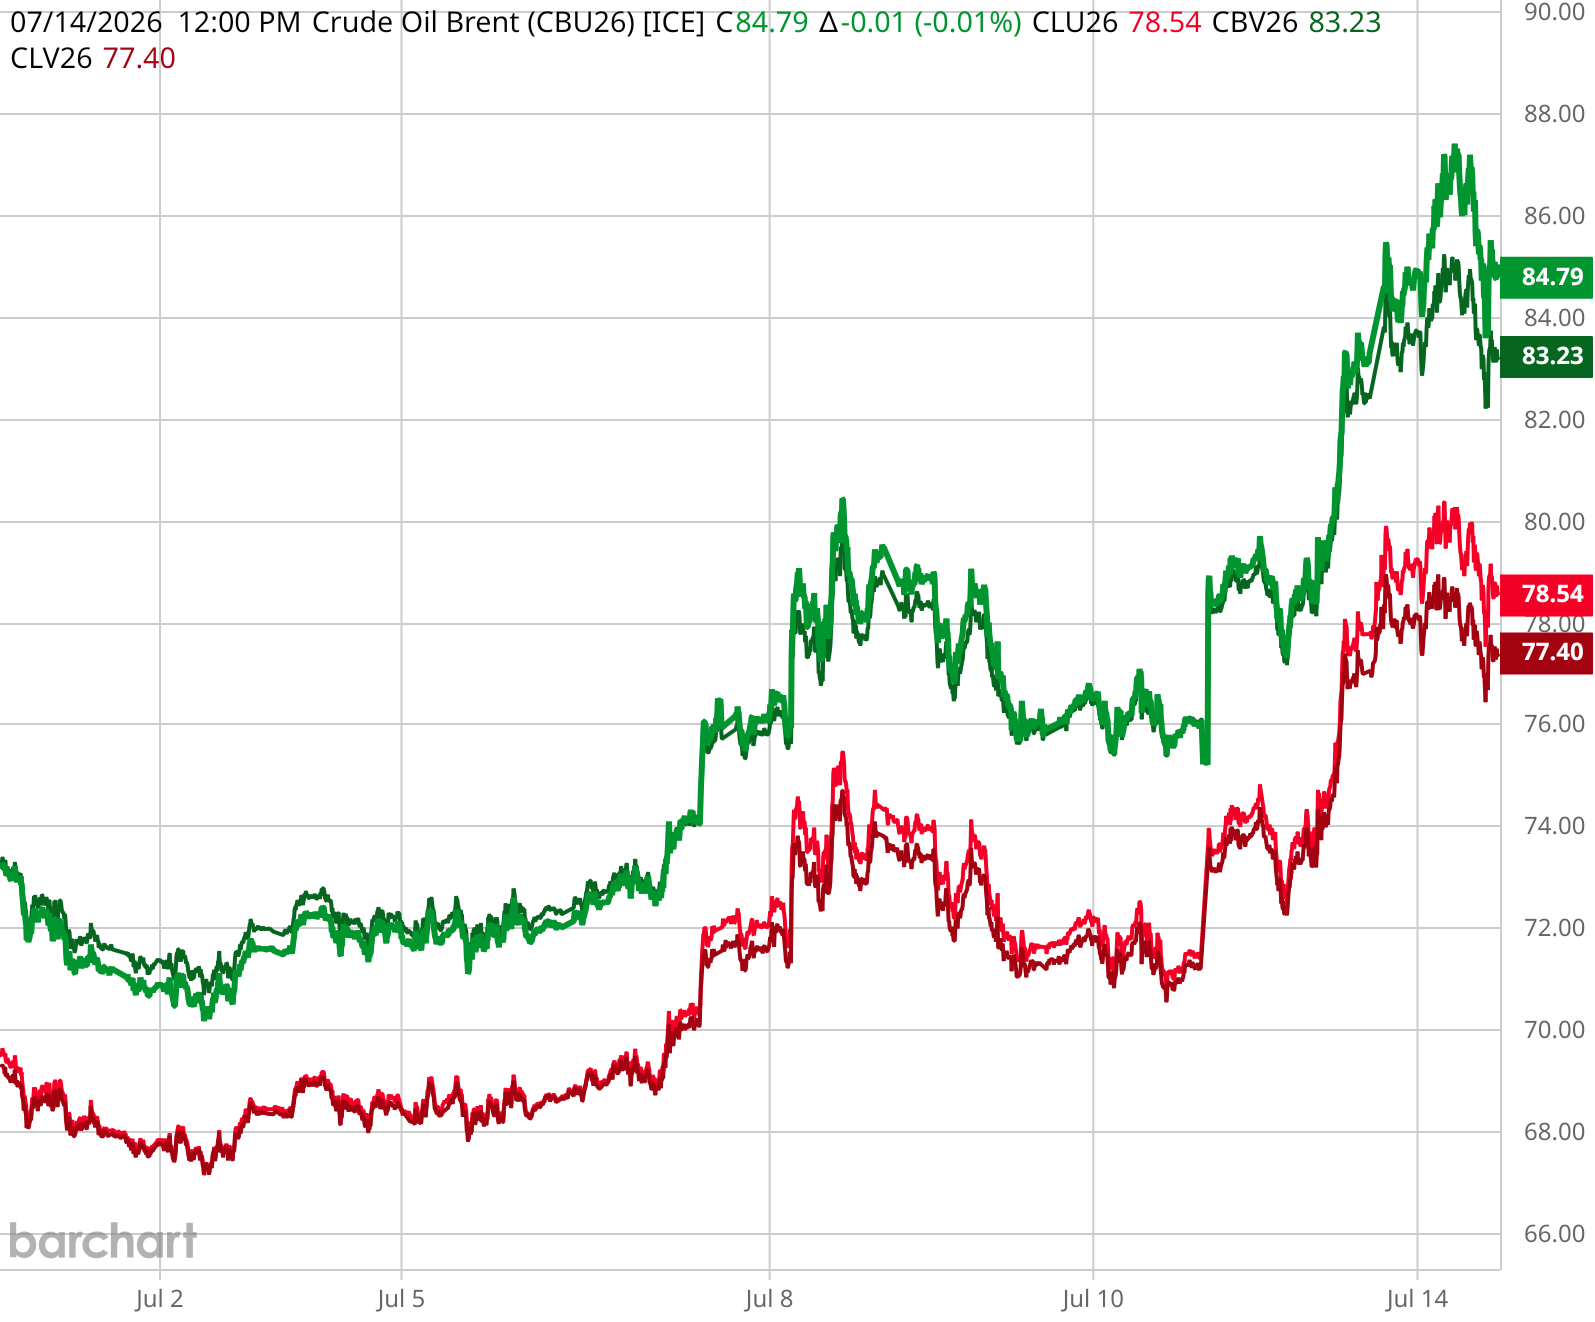
However, with the resumption of hostilities between the US and Iran over the Strait of Hormuz, oil prices have already begun to track upwards once again.
Gas prices quickly followed.
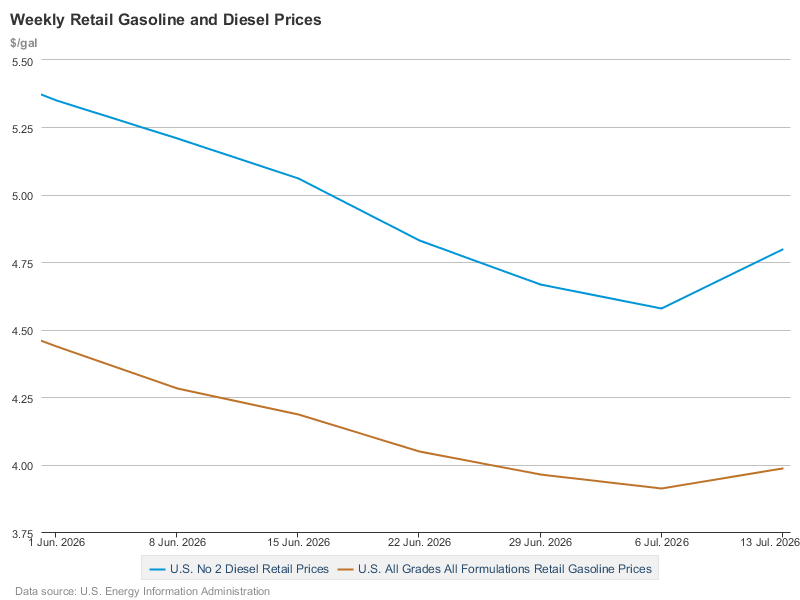
Energy prices fell in June, and that fall defined consumer price inflation patterns for the month. Energy prices have started rising since the end of June; that rise is sure to define consumer price inflation patterns for July.
The drop in prices for June is a welcome shift after the energy price surges of the past few months, but the one thing we already know is that it will not be repeated in July. There is no trend reversal in play for consumer prices, merely an abrupt and temporary cooling of consumer price inflation.
That the June inflation print won’t be repeated for July is perhaps the most encouraging part of the Consumer Price Index Summary. As bad as persistently high inflation is, and as economically damaging as it can be, persistent deflation is a far more severe problem, as it blocks all economic growth. Outside of durable goods, the US economy has not been seeing persistent price deflation. While there is room for debate about how much or how well the US economy is actually growing, one fundamental reality of the US economy is that it is growing—at a time when that cannot be said of other major economies such as China.
June was the month when all the prices fell in the US. It was the month when much of the energy price and supply shock that first hit the economy in March largely reversed.
July will not be a repeat of that price drop. July will also not be a repeat of March, even with energy prices moving up once more. We will see some further inflation increases at least for the summer months, but at present a new hyperinflation cycle such 2021-2022, or a 1970s-style stagflation crisis as was feared back in March, is not in the offing.
That outlook could change. Every factor that made stagflation a real possibility over the past few months is still present. Persian Gulf oil flows are still at risk of disruption. Strategic oil reserve releases are still at risk of not being able to buffer that disruption. The war with Iran shows no sign of ending quickly.
The June inflation report erased much of what could easily have become a severe stagflation crisis in the US. It did not erase the forces that would have caused that stagflation crisis.
The June inflation report was a one-time shot of good inflation news. Enjoy it while it lasts.
The timing is excellent - less than four months to the midterm elections. Now is when a great many undecided voters are noticing that hmmm, things aren’t really that bad under Trump, and the looming economic disasters that the media screamed about haven’t happened. Maybe MAGA is working!
Sadly , beef prices went up.