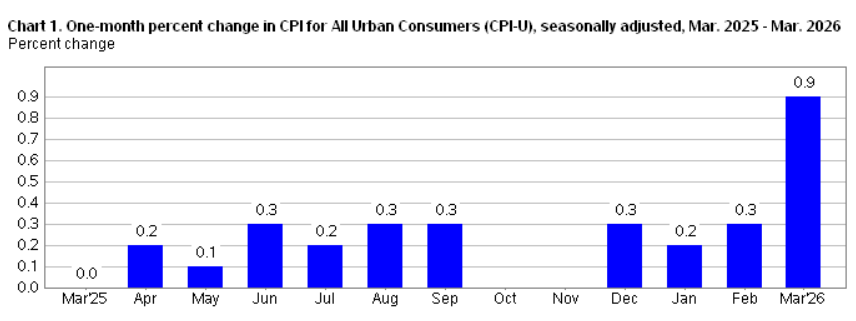
The Consumer Price Index for All Urban Consumers (CPI-U) increased 0.9 percent on a seasonally adjusted basis in March, after rising 0.3 percent in February, the U.S. Bureau of Labor Statistics reported today. Over the last 12 months, the all items index increased 3.3 percent before seasonal adjustment.
We knew this report was coming. We knew the energy shock was coming.
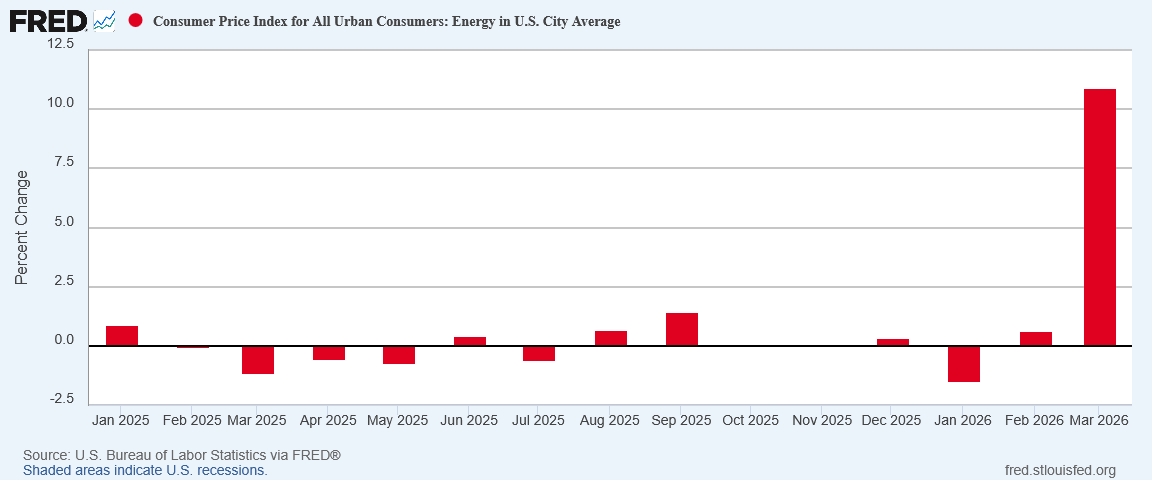
The energy price inflation spike in March was an economic shock. The news that there was an energy price inflation spike in March was not at all shocking.
Yet there are questions lurking within the data, questions that may end up shaping our understanding of what happens with consumer price inflation in April and throughout the summer months.
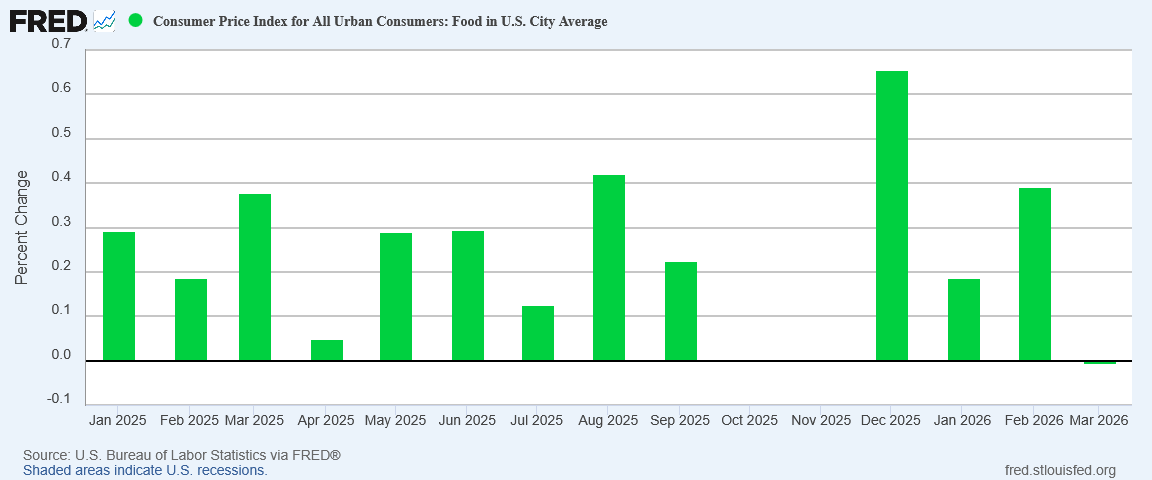
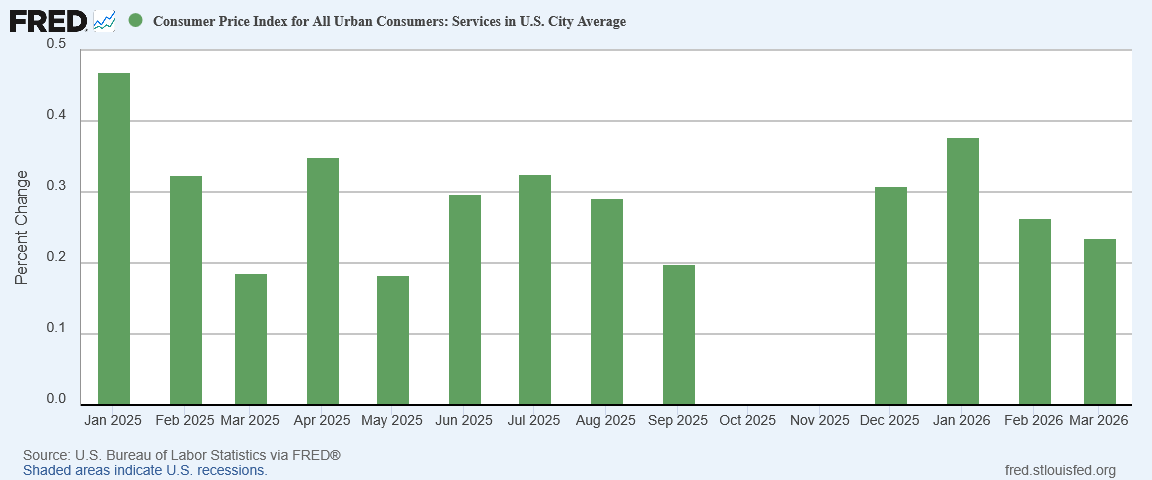
Energy prices were up, and so headline inflation was up. Core inflation, however, was far more muted. For some categories inflation is even cooling.
Cooling inflation can be a sign that demand is decreasing. If demand is decreasing then economic growth is slowing.
Slow economic growth coupled with an energy price shock is how we got the stagflation crisis of the 1970s.
It is far too soon to conclude that we are seeing stagflation in the US economy. It is not too soon to wonder if what is unfolding is a fresh hyperinflation cycle or a stagflationary crisis.
Every article I publish takes time, care, and independence. A paid subscription fuels that work and shields it from outside pressure. If you’re able, join me today.
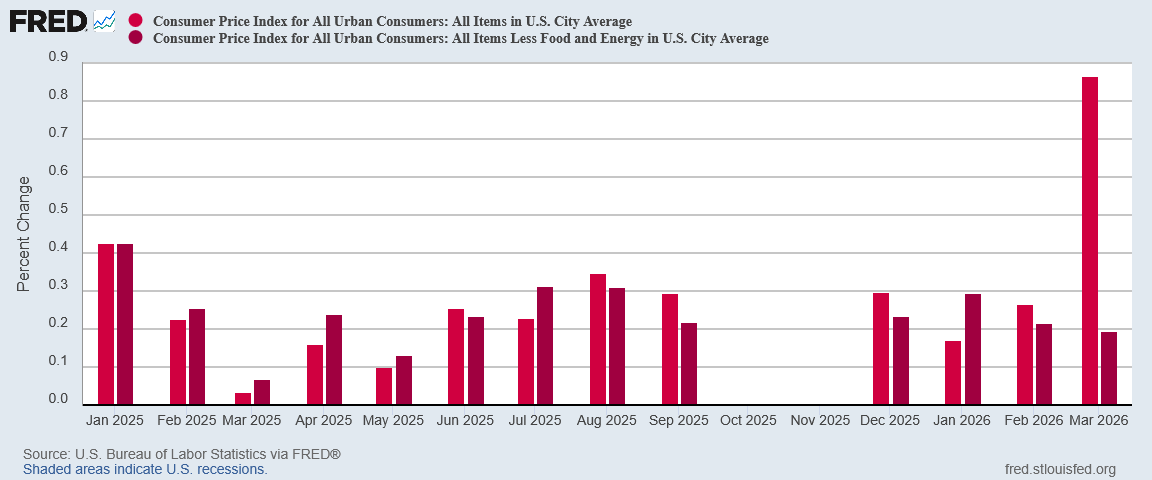
However, the rise in core inflation seems almost a routine fluctuation. Month on month, that core inflation actually cooled gets lost against the backdrop of headline inflation’s energy-driven surge of nearly 0.87%
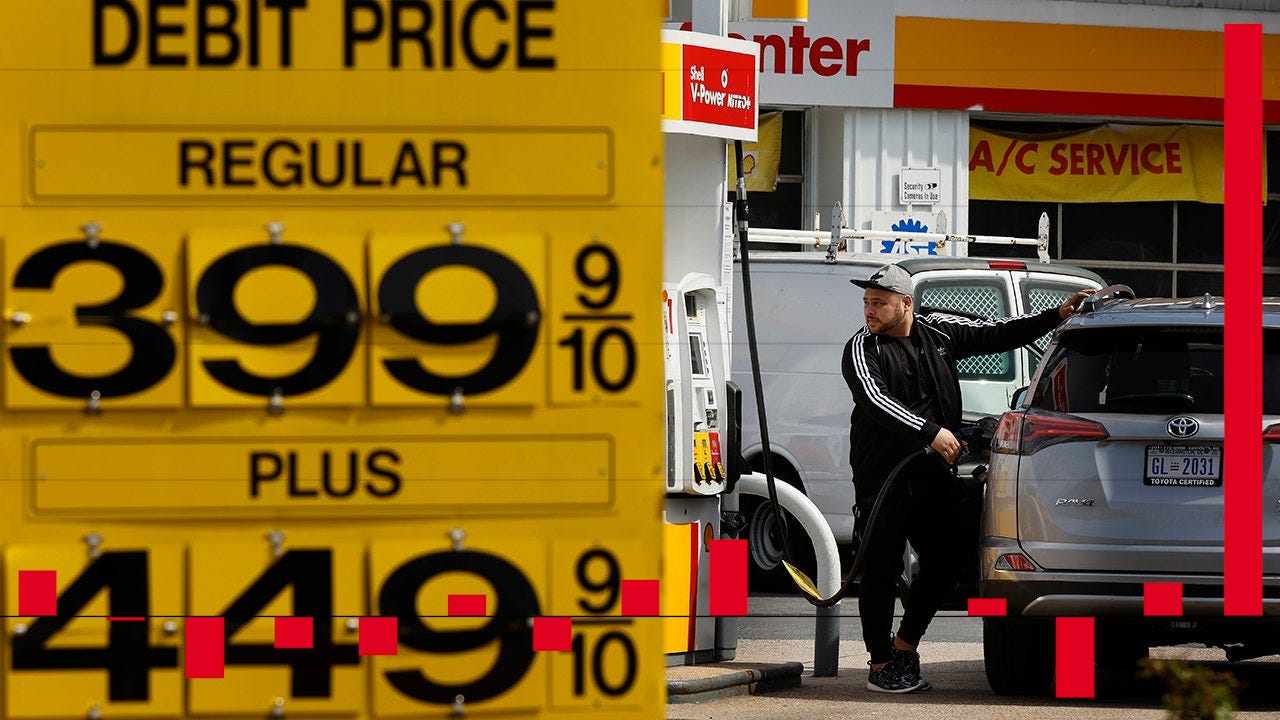
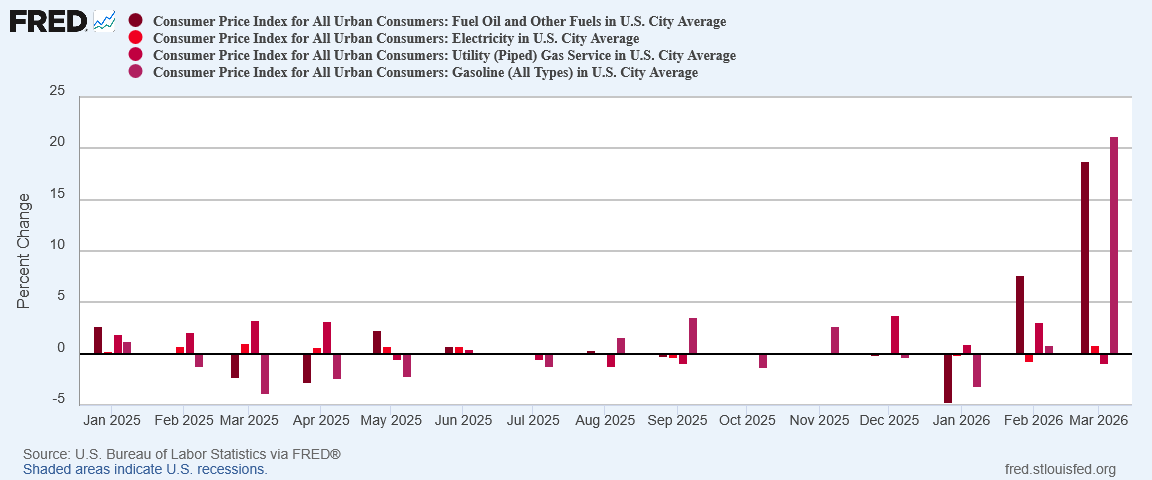
The reason for the disparity, of course, was energy prices, all of which soared in March as a consequence of Operation Epic Fury, President Trump’s war with Iran. That war has resulted in energy prices rising 10.88%.
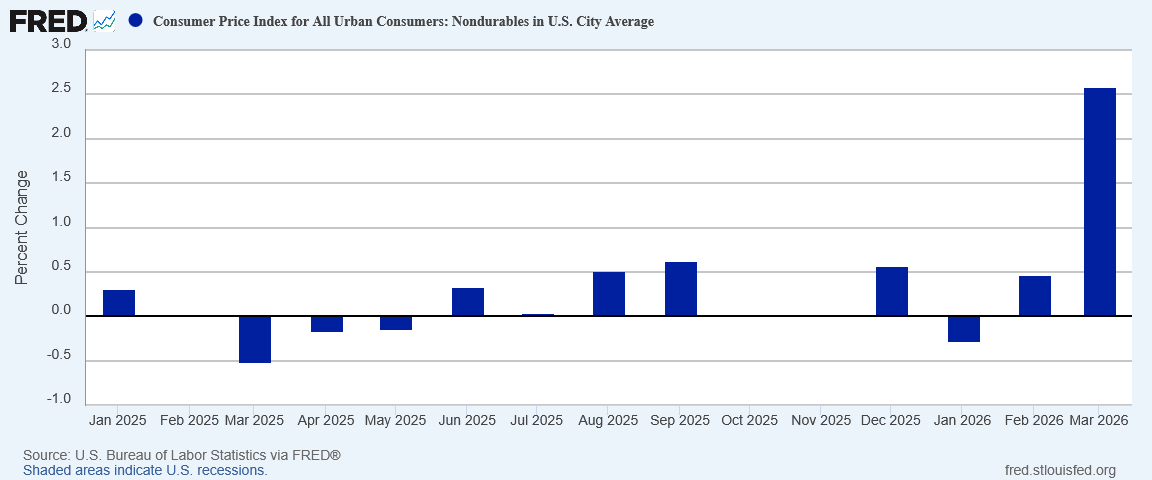
Goods, however, saw inflation heating up significantly. Nondurable goods saw month on month inflation of nearly 2.6%.
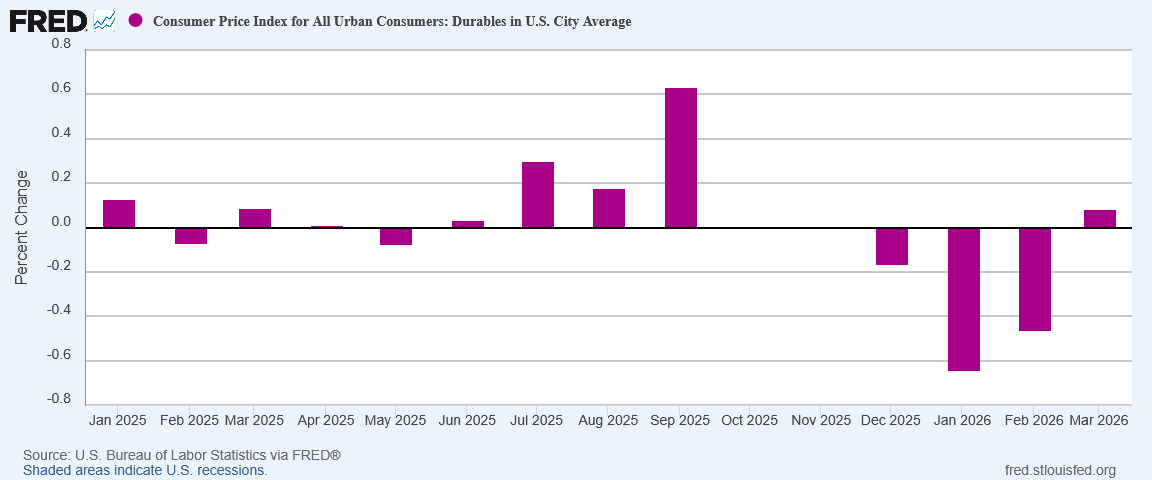
Even durable goods, which have been printing deflation in recent months, returned to month on month inflation.
Intriguingly, shelter price inflation also rose, with the more conservative BLS subindex printing 0.3% month on month and the more forward-looking ZORI index printing close to 0.4% month on month.
Shelter Price Inflation
However, outside of energy, the inflation surge was mostly limited to nondurable goods—which is why month on month core inflation actually fell.
It is this seeming dichotomy between core inflation and energy price inflation (and thus headline inflation) which compels us to question if this is the beginning of a stagflationary crisis, with an energy price surge colliding with a cooling economy, or if this is a simple price shock.
Assessing the risks from the price shock which hit the US economy in March begins with determining whether or not economic activity is increasing or decreasing—whether the economy is heating up or cooling down.
As I have discussed previously, what separates ordinary inflation from stagflation is the level of economic expansion that is (or is not) occurring.
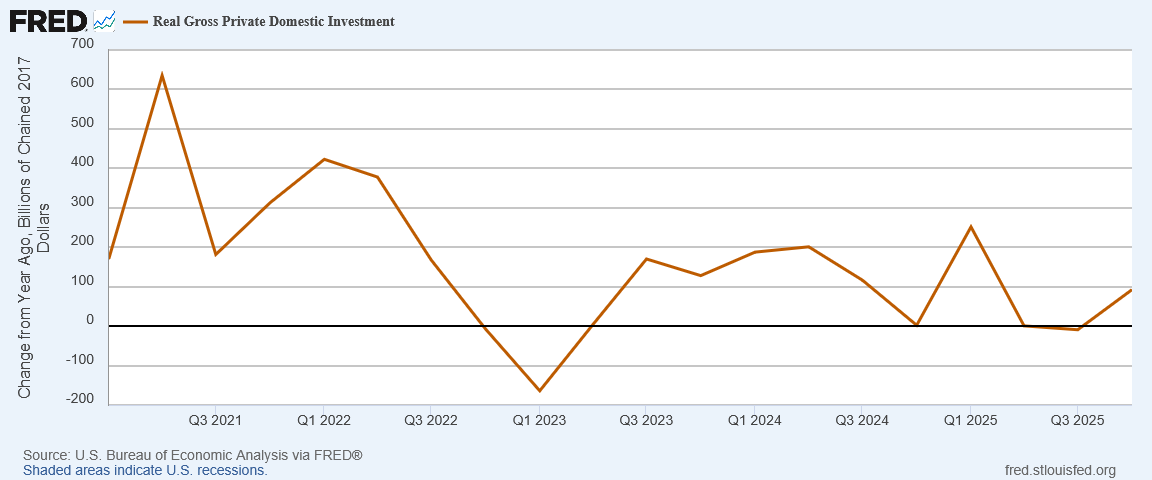
We demonstrably have year on year real investment growth that is charitably described as “volatile” but which has declined overall since 2021 and 2022.
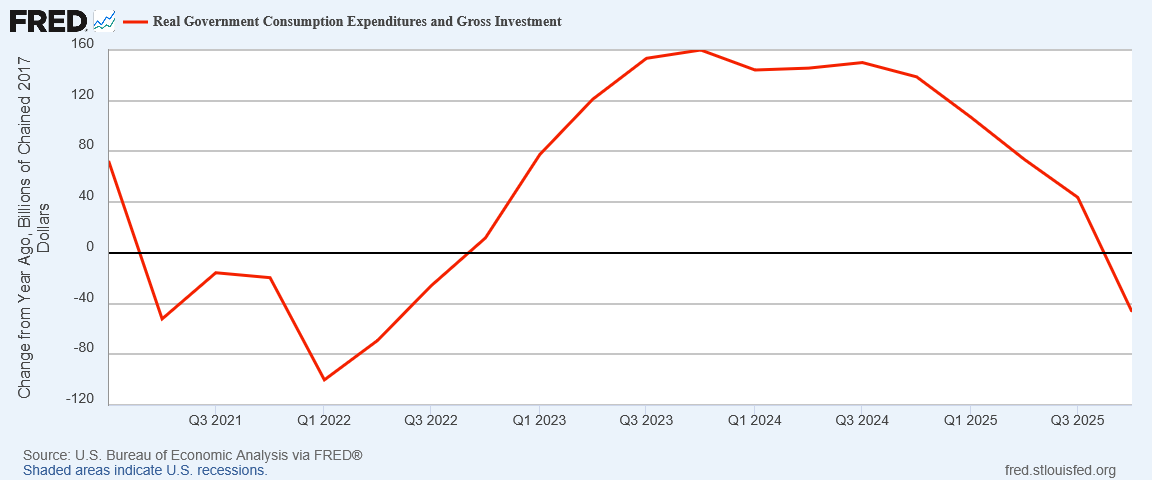
We demonstrably have what many will receive as good news, year on year real growth in government spending that has trended down since the end of 2024 and turned negative at the end of 2025.
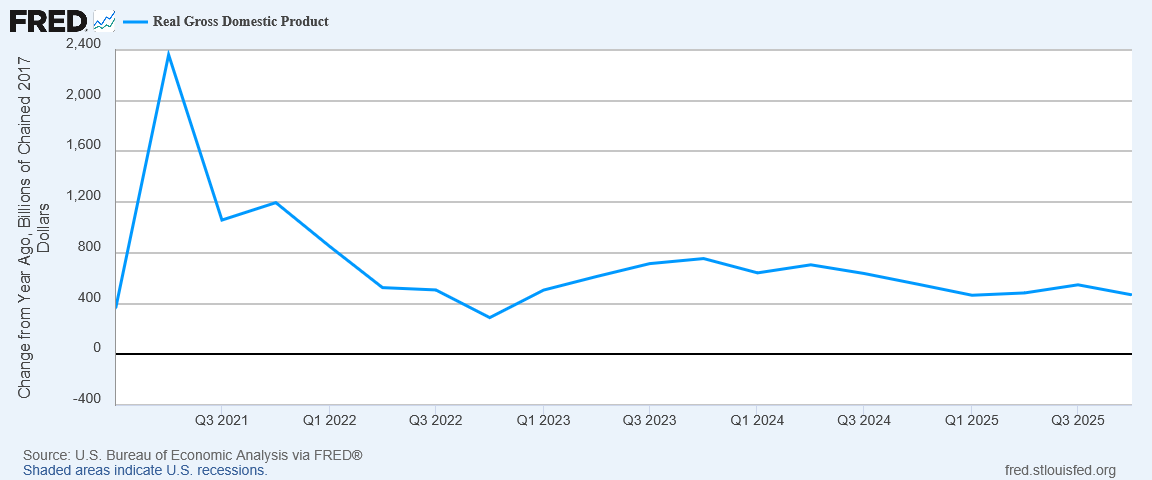
Every major contributing sector to overall Gross Domestic Product has a growth trend that is down. This confluence of trends arguably points to an economy that is softening and slowing down.
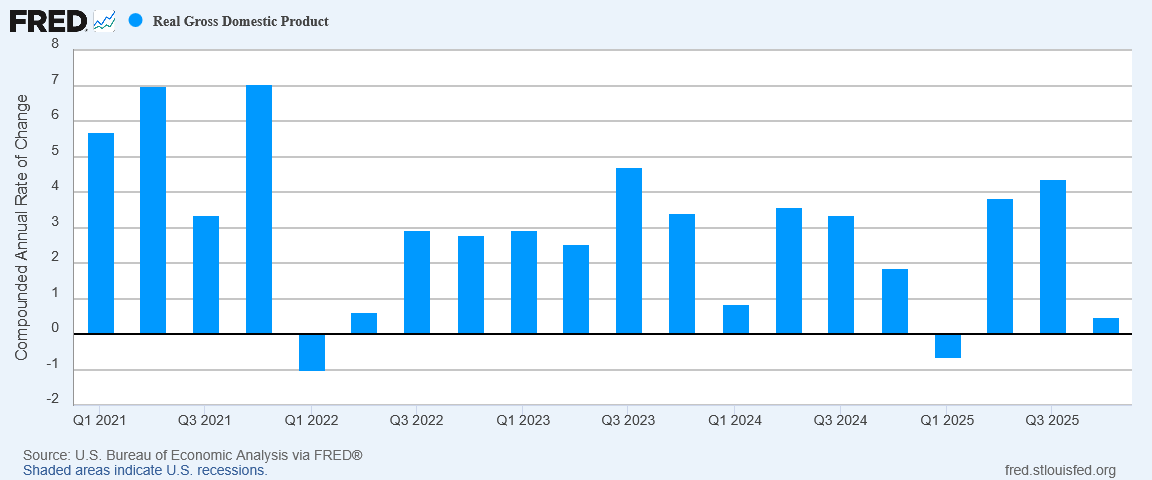
That is certainly confirmed by the BEA’s report that real GDP growth fell off a cliff at the end of 2025.
President Trump’s claims of a “Golden Age” in the US economy notwithstanding, there is more than a little evidence to sustain the assessment that the economy is cooling down and not heating up.
While the March Employment Situation Summary report showed far better job growth than anticipated, it is far from clear that this country’s jobs recession has ended.
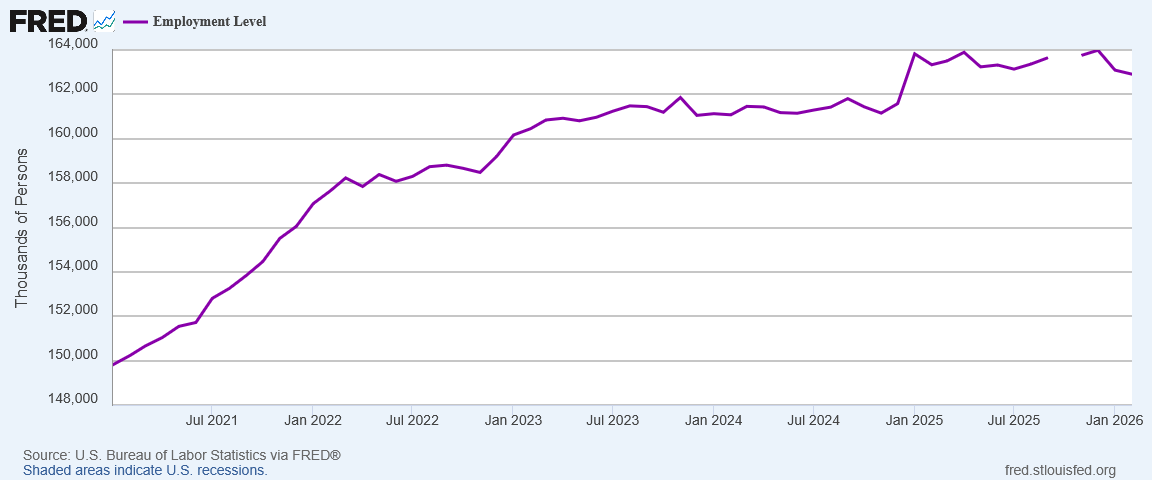
The Employment Level from the Current Population Survey (Household Survey) portion of the jobs report shows that employment peaked in this country at the start of 2025 and has trend down since.
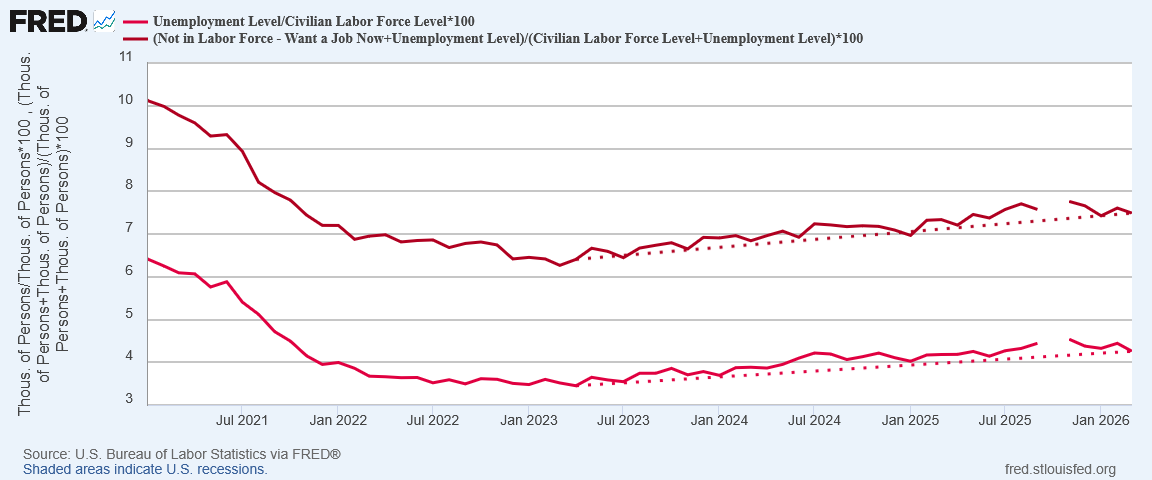
While unemployment has declined since last fall, in both real and “official” terms, the longer term trend in joblessness is still one of increase rather than decrease.
While the data does not (yet) point to an economy that is unequivocally suffering, the data does show that a considerably amount of job growth is needed for American workers to participate in President Trump’s “Golden Age”.
Rising joblessness trends and falling employment levels certainly call into question the premise that the US economy is growing. As a rule, we look for growing economies to have increased demands for labor. If the economy is growing we should expect to see unemployment trending down and the employment level trending up. At present we see the polar opposite of that.
Even with the positive headline numbers on the March jobs report, it would be a considerable stretch given the current data set to argue that the jobs recession if over. We are not there yet.
The degree of stagflation risk posed by the March inflation surge hinges entirely on whether the economy is robust and growing, or sclerotic and declining.
Certainly for the first three quarters of 2025, economic growth overall was strong for an economy as large as America’s.
The fourth quarter GDP print, however, breaks with that narrative completely.
While we cannot infer a trend from a single quarter, there are several trends across the whole of the economy which suggest the fourth quarter GDP numbers may be a confluence of negative factors and not an economic outlier after three strong quarters of GDP growth.
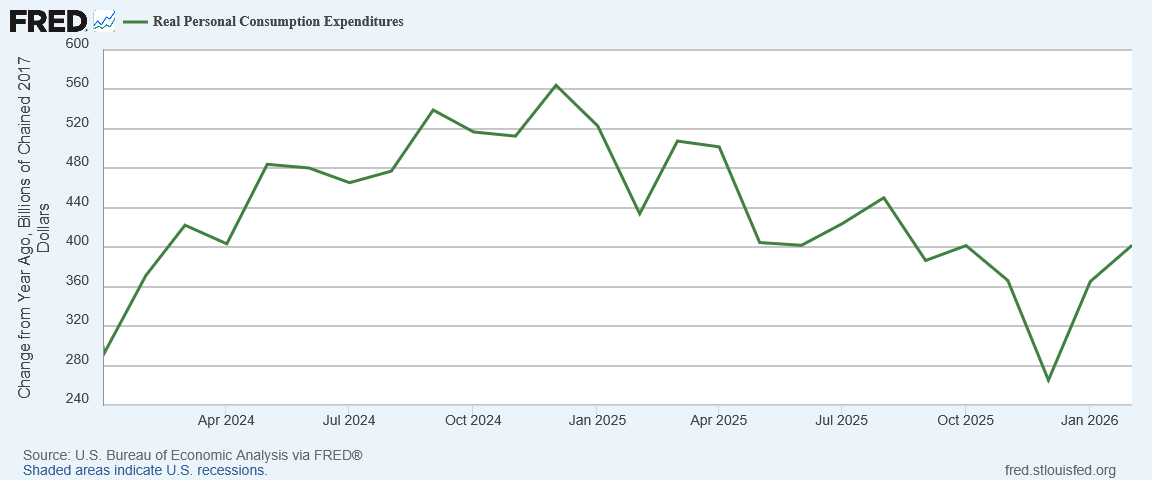
Consumption growth has been softening.
Investment growth has been volatile but broadly declining.
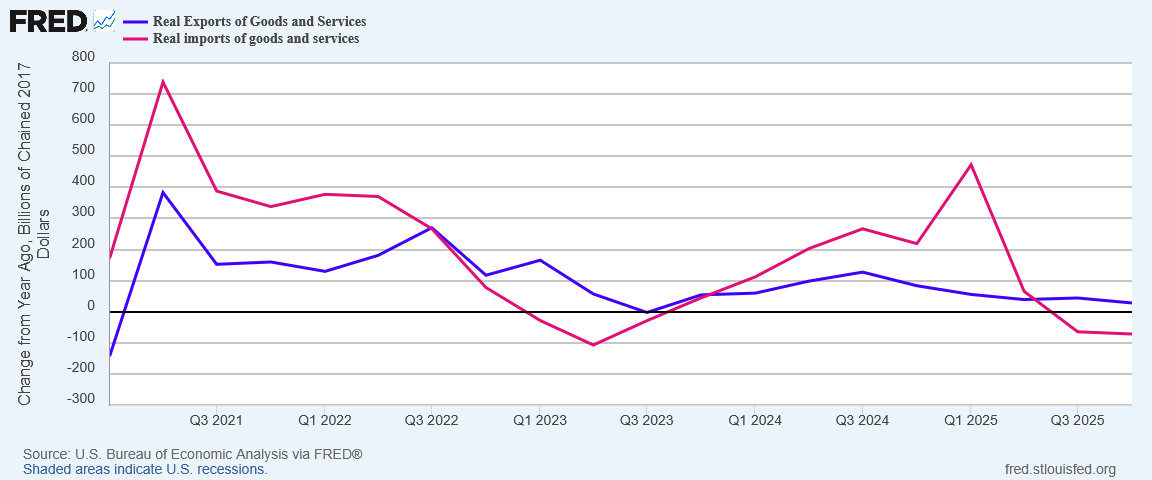
Imports and exports have been declining.
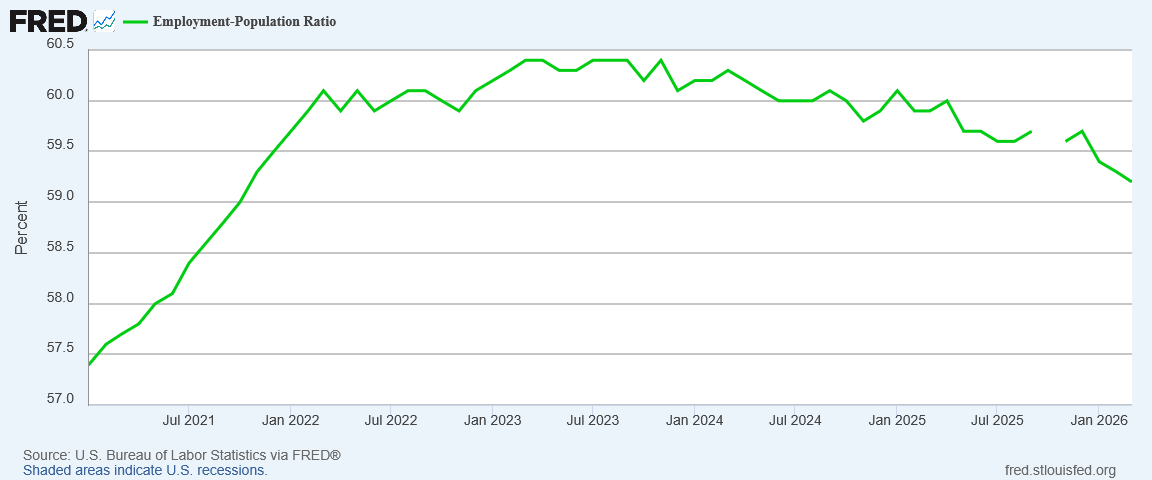
The realities of the ongoing jobs recession also argue against presuming the US economy is hale and healthy. With the Employment Level and Employment-Population Ratio both declining, while joblessness is increasing, the labor portion of the economy is far from in good health.
The sudden rise in fuel costs could potentially further hinder consumption, as every dollar consumers put into their vehicle’s fuel tank is a dollar that cannot be spent elsewhere. That same rise could also produce shipping and transportation dislocations, as trucking concerns must grapple with a price surge that likely exceeded all of their budget forecasts and resource planning.
If that proves to be the case, we will see a drop in consumption over the next couple of months simply because there will be less available to consume, while the resulting scarcity shock will push prices for many goods higher even as overall demand is pushed lower.
That is the stagflation scenario.
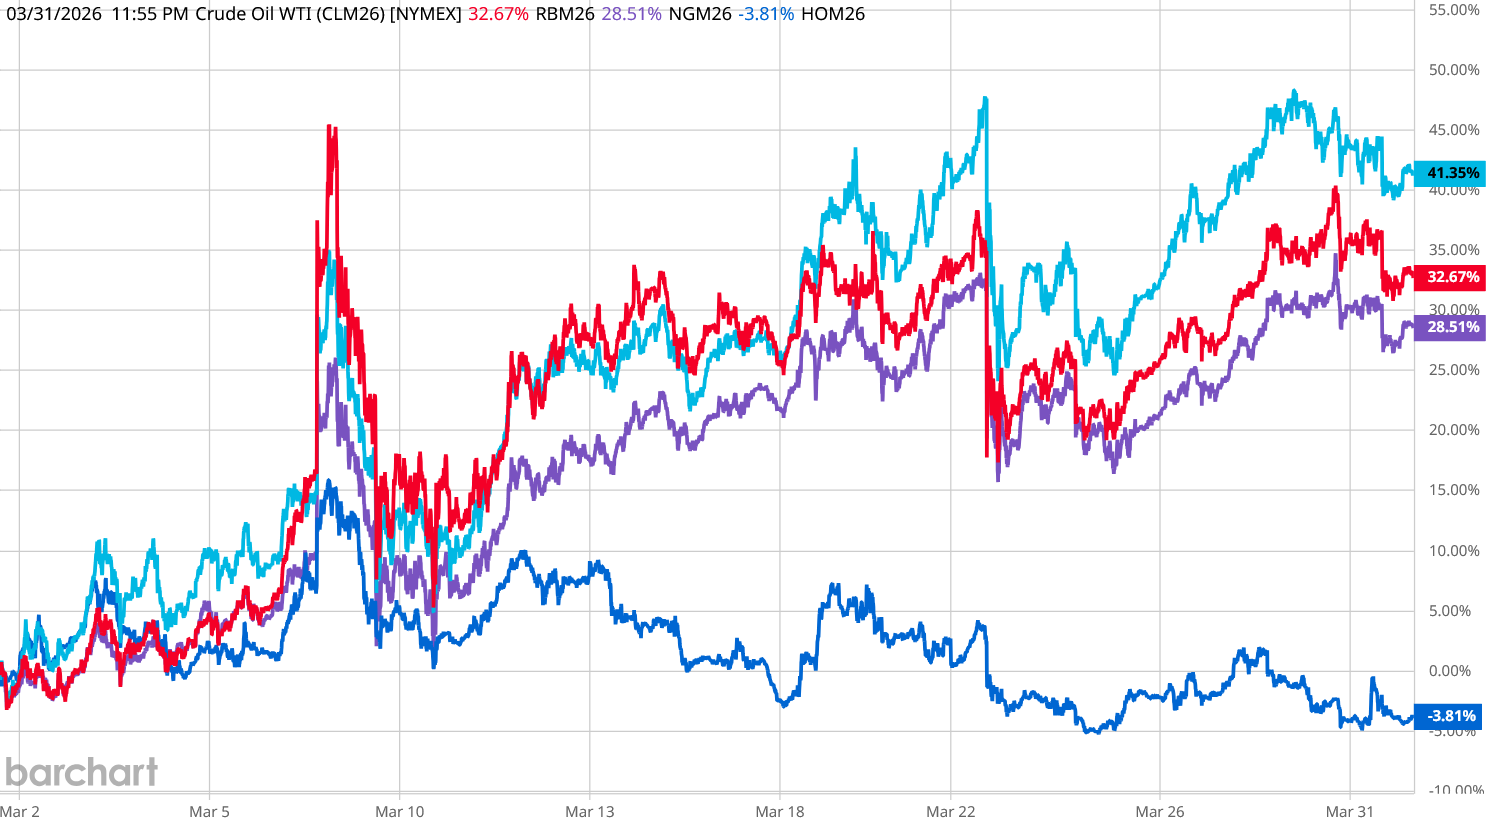
However, if US oil producers are able to produce more, and oil refinery logistics can recalibrate for the sudden shifts in global energy markets, even before the Persian Gulf flows are restored the US could see fuel prices and supply trend back towards pre-war levels. Increased oil production could produce job and wage benefits which would help end the jobs recession and bring more Americans to the level of prosperity intimated by Trumpian rhetoric of a “Golden Age.”
That is the inflation scenario.
It will be a few months still before we see which scenario is the one unfolding before us. Jobs, consumption, and inflation numbers all have to trend across a few months to know what the trend is.
What we know for now is that March energy price inflation printed considerably than it has been, while core inflation is still cooling. With only limited improvement in market prices for oil and its refined products, there is little reason to anticipate at present that April will bring any improvement. April could quite easily see even worse inflation. People may be hard pressed to distinguish between the present inflation surge and that from the start of the 2022 hyperinflation cycle.
What happens beyond April rests entirely on the outcome of the next phase(s) of the war with Iran. Will the Strait of Hormuz be reopened? Will Arab oil production be quickly restored? Will the Persian Gulf be consumed in a paroxysm of violence which decimates Middle East oil flows for the next few years?
All of those scenarios lie with the realm of current probability. One of them will happen—but we do not know which one.
Will we have inflation or stagflation? So long as the fog of war lingers over Operation Epic Fury, we are not going to know.
Every article I publish takes time, care, and independence. A paid subscription fuels that work and shields it from outside pressure. If you’re able, join me today.
You certainly raise a bunch of concerning issues, Peter. Yes, the war simply must end quickly, or there will be serious economic prices to pay - and I think we can count on Trump to understand this!
One bit of data has piqued my curiosity: the increase in shelter price inflation. Our border has been closed and more than one million illegals deported, so you would think that would ease shelter price inflation. Any idea why it’s increased?
Thanks for all you do, Peter!
AGI 🤖🪙💱 TOKEN market pricing ‘splainer:
https://claude.ai/public/artifacts/8977751d-31fb-4240-b282-8ee15ddb2e25
.....follow the money, Boomtown Cycle!⚒️🎲