

May CPI: The Energy Shock Not So Shocking (Yet)
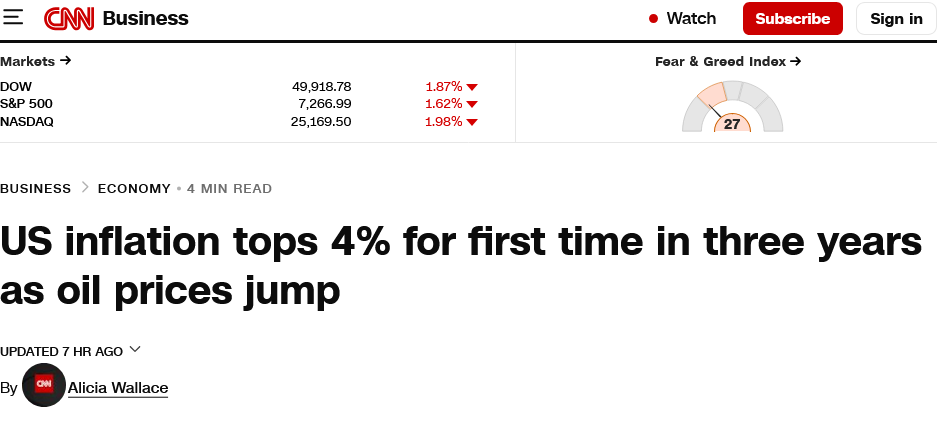
Corporate Media Is Gaslighting (Again): Inflation Did NOT "Jump" In May

There is narrative and there is data. Narrative should draw on data. Data should not be molded by narrative.
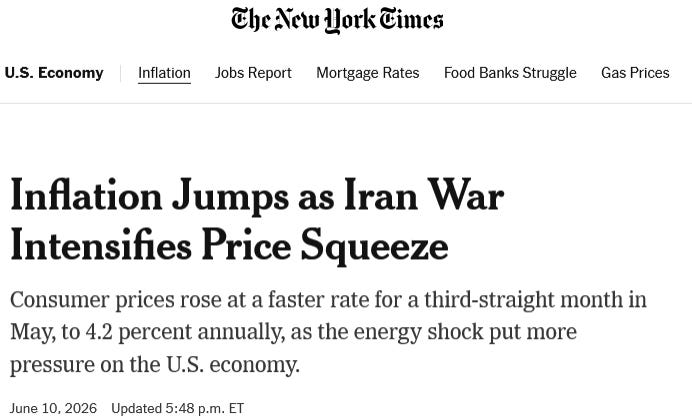
We need to remember that when discussing the May Consumer Price Index Summary, because while corporate media speaks in almost reflexively pearl-clutching terms of inflation “jumping”, the data tells a different story.
The all items index rose 4.2 percent for the 12 months ending May, after rising 3.8 percent for the 12 months ending April. The all items less food and energy index rose 2.9 percent over the year, following a 2.8-percent increase over the 12 months ending April. The energy index increased 23.5 percent for the 12 months ending May. The food index increased 3.1 percent over the last year.
At year on year inflation of 4.2%, the May CPI print was right in line with Wall Street projections, and just slightly above the Trading Economics forecast of 4.0%.
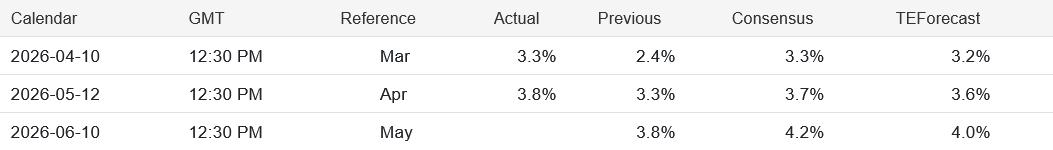
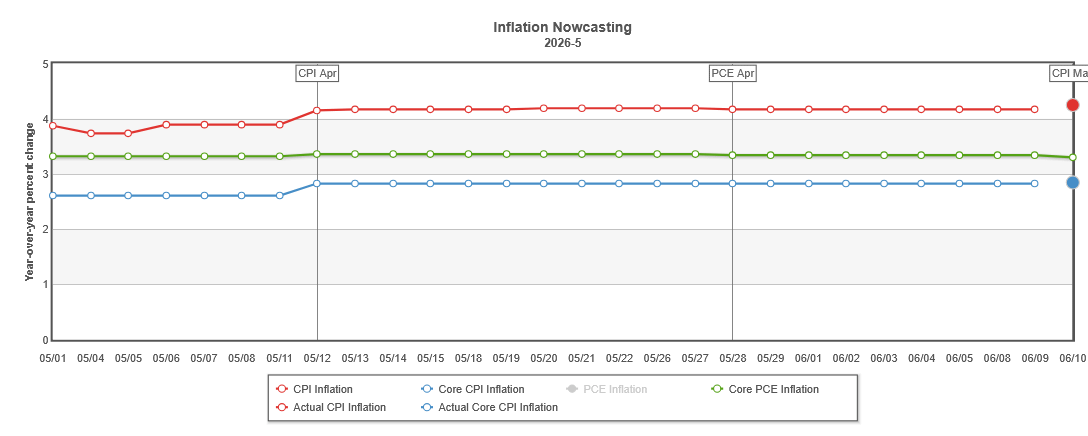
At 4.2%, the CPI print also came out exactly where the Cleveland Fed’s inflation nowcast projected.
4.2% year on year is quite a bit more inflation than what we had in February, before the start of Operation Epic Fury and Iran’s illegal response of closing the Strait of Hormuz.
However, we must also remember that year on year inflation for April was 3.8%. For March it was 3.3%, and for February it was 2.4%.
In other words, the big “jump” in consumer price inflation happened in March, and we are actually seeing disinflation since then, meaning inflation increased by less in May than in April, and less in April than in March. The energy price shock is, for the moment, proving to be a good deal less shocking than originally anticipated.
The blunt reality is that corporate media is once again peddling a narrative untethered from the facts. Either they are lying (again) or they do not know how to read the data, but inflation did not “jump” in May. That happened in March.
I leave the reader to decide how much of the media’s gaslighting is from malice and how much is from simple stupidity.
Corporate Media IS Gaslighting
We only have to look at the headlines corporate media outlets are using to describe the May inflation report to see the narrative they wish to advance.
There is the New York Times getting the data exactly wrong:
CNN, still the most busted name in Fake News, decided to be equally factually challenged about oil prices (oil prices came down in May).
Even Bloomberg chose a headline that was somewhat to the left of accurate.

Gasoline prices did rise significantly in May, but the increase was nowhere near the surge we saw in March.
Consumer price inflation rose in May, and rose significantly. The data does confirm that much.
What the data does not confirm is the presentation of inflation rising at an increasing rate. That did not happen in May. Overall, consumer price inflation rose at a slower rate. Inflation decelerated. Inflation did not accelerate in May.
When inflation rises at a slower rate, that is called “disinflation”. That is what we have in the May report.
All Rates Of Change Matter
As anyone familiar with a dictionary can quickly verify, “accelerate” means to go faster. When we look at the year on year inflation graph for the Consumer Price Index, do we see evidence of acceleration? No. We do not.
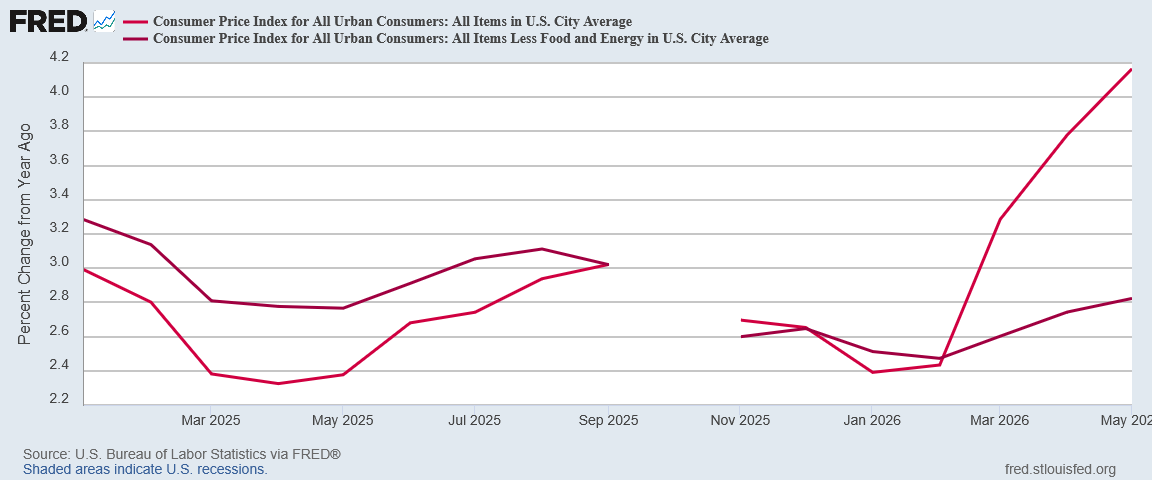
When a graph bends down even a little, that means the rate of change has decreased, and close inspection of the data confirms what the eye can see plainly looking at the graph: from March to April to May it bends down.
At 4.167% in May, year on year inflation rose 0.388pp from April’s 3.779%, which represented a 0.493pp rise from March’s 3.286%.
In order for inflation to have accelerated (or “jumped” or “surged”) in May, the change from April would have had to have been greater than the 0.493pp from March to April. As the change from April to May was less than the change from March to April, what the data shows is inflation rising more slowly in May than in April.
We can see this even if we just look at the raw index graph for both headline and core CPI.
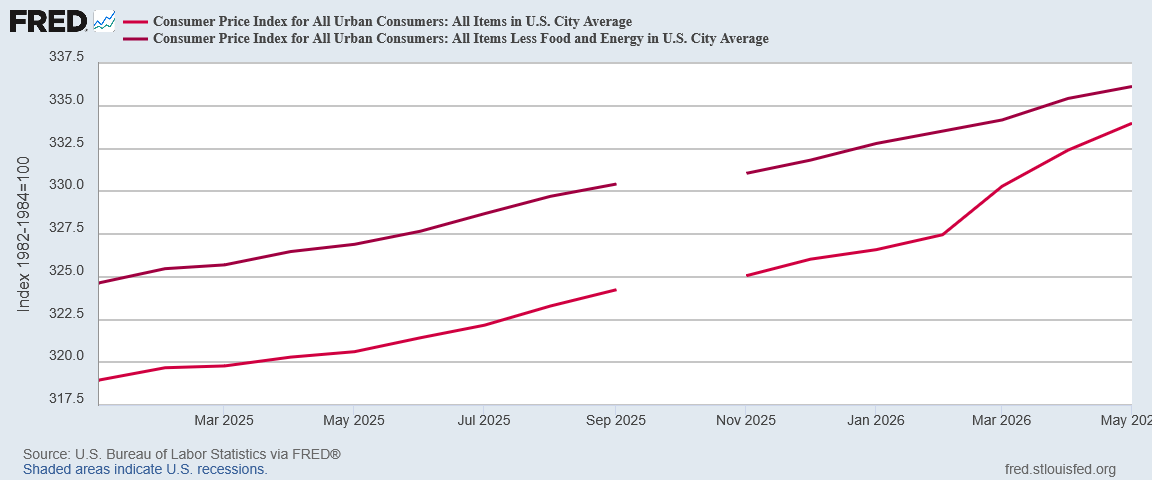
Just the fact that both graphs bend down moving from March 2026 to April 2026 to May 2026 is itself absolute proof that inflation slowed in May. It did not slow by much, but what it absolutely did not do is rise faster.
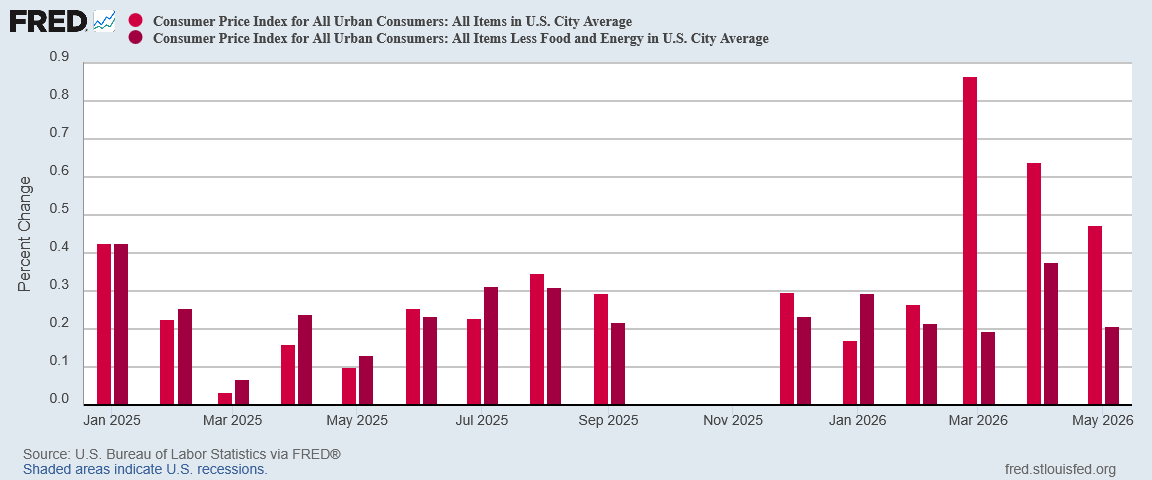
Even when we look at the month on month chart, we see less of headline and core inflation in May than in April.
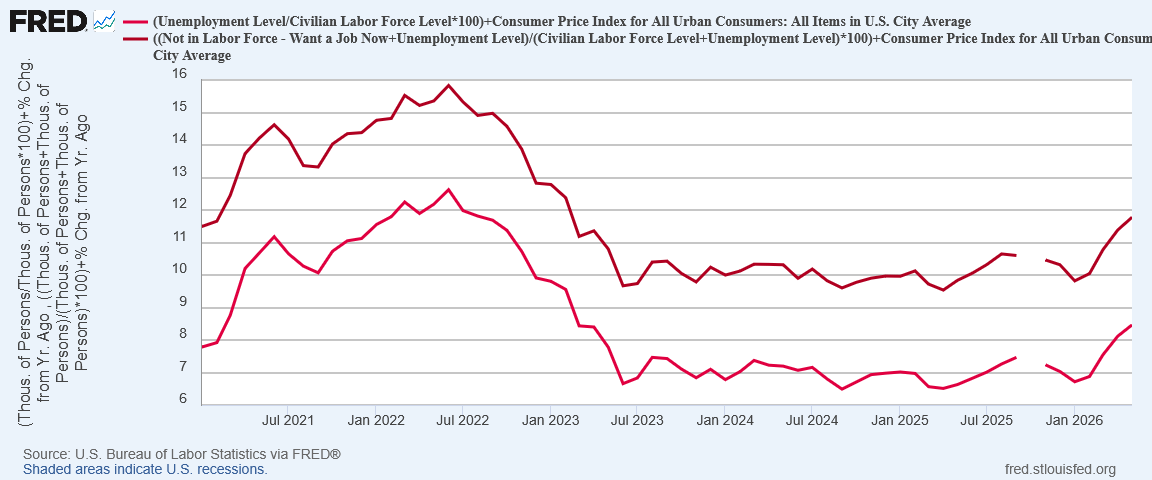
This is not to say that inflation did not rise significantly in May. It did. Because inflation rose in May, the “Real Misery Index”—consumer price inflation plus real unemployment (including those persons not in the labor force but who want a job now)—also increased.
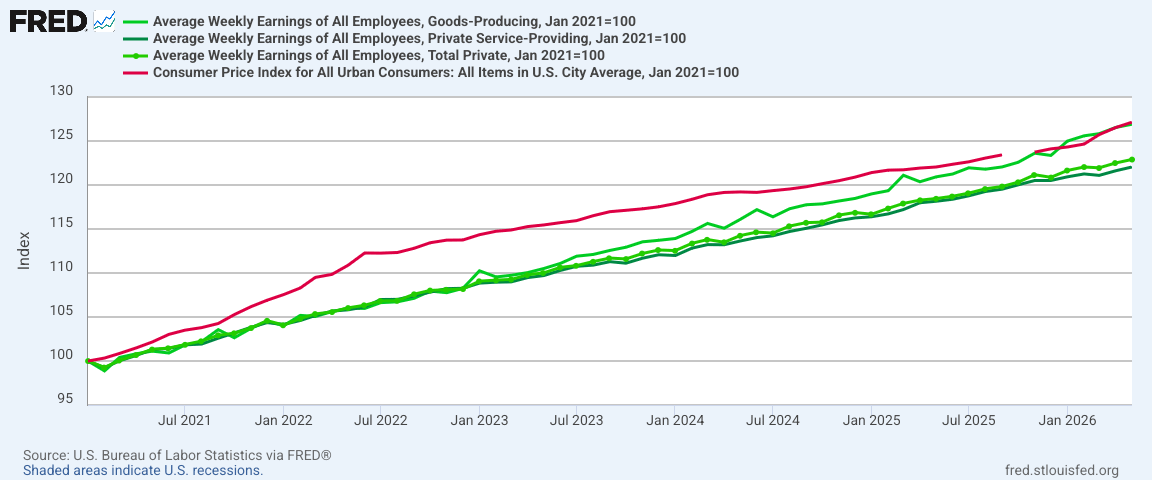
We must also recognize that, with the May inflation print, inflation is once again outpacing earnings even for the higher paying goods producing jobs.
We cannot say the May inflation report is good. Consumer price inflation rose 4.2% in May, and that is not at all good.
It also rose less in May than in April.
When inflation was printing north of 9%, such disinflation was of great interest to corporate media. The reader is left to draw their own conclusions why corporate media is not interested in such disinflation now (*cough* “Trump!” *cough*).
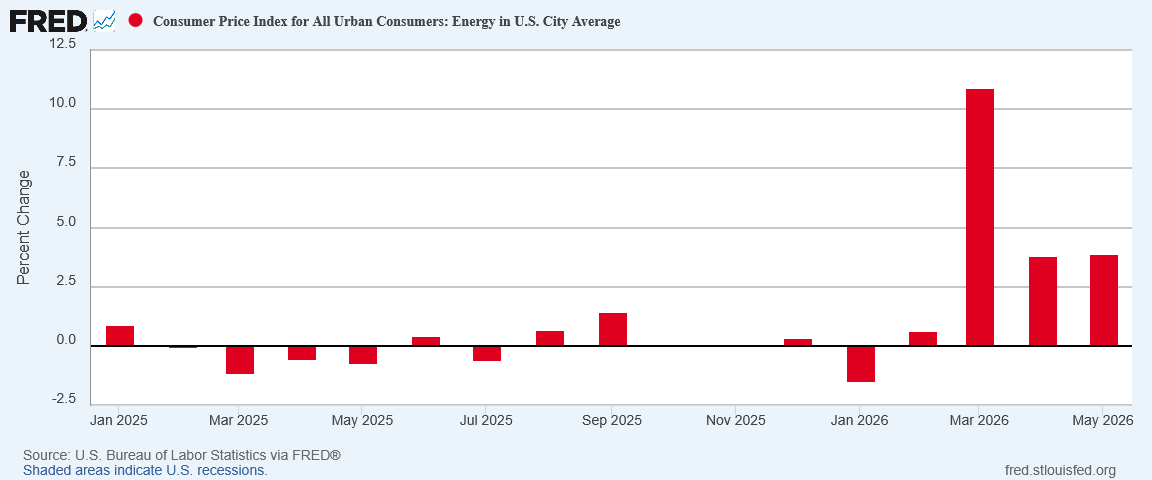
Energy Price Inflation Almost Unchanged
We still have energy price inflation in May. What we do not have is considerably more energy price inflation in May than in April. 3.80% to 3.88% is not considerably more inflation month on month, particularly for energy.
Even with the components of the energy index, we have more disinflation than outright inflation.
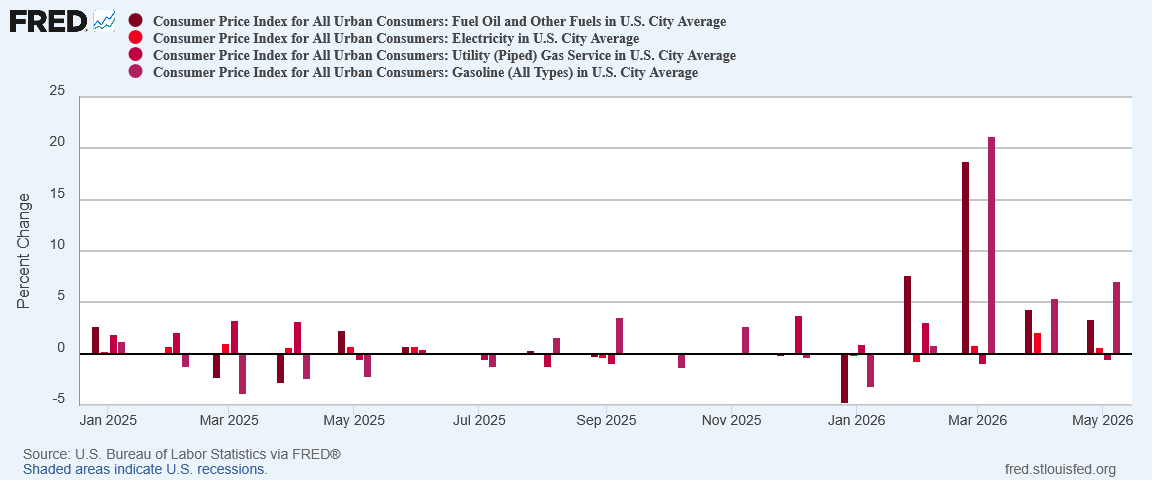
Fuel oil and diesel dropped a full percentage point month on month, from 4.3% to 3.3%. Electricity dropped from 2.1% month on month to 0.6% month on month. Piped gas slipped into outright deflation in May, printing at negative 0.6%.
Gasoline did increase in May, rising 7% month on month, which is a significant increase over April’s 5.4% month on month. That is not a price movement shared by other energy index components.
We still have significant energy price inflation, and gasoline is a significant factor in that inflation. But overall we simply do not have more energy price inflation in May than in April. We have energy price disinflation in May. That should make a difference in how we view the data.
One reason why energy price inflation was not worse in May: Oil prices were lower at the end of May than at the beginning.
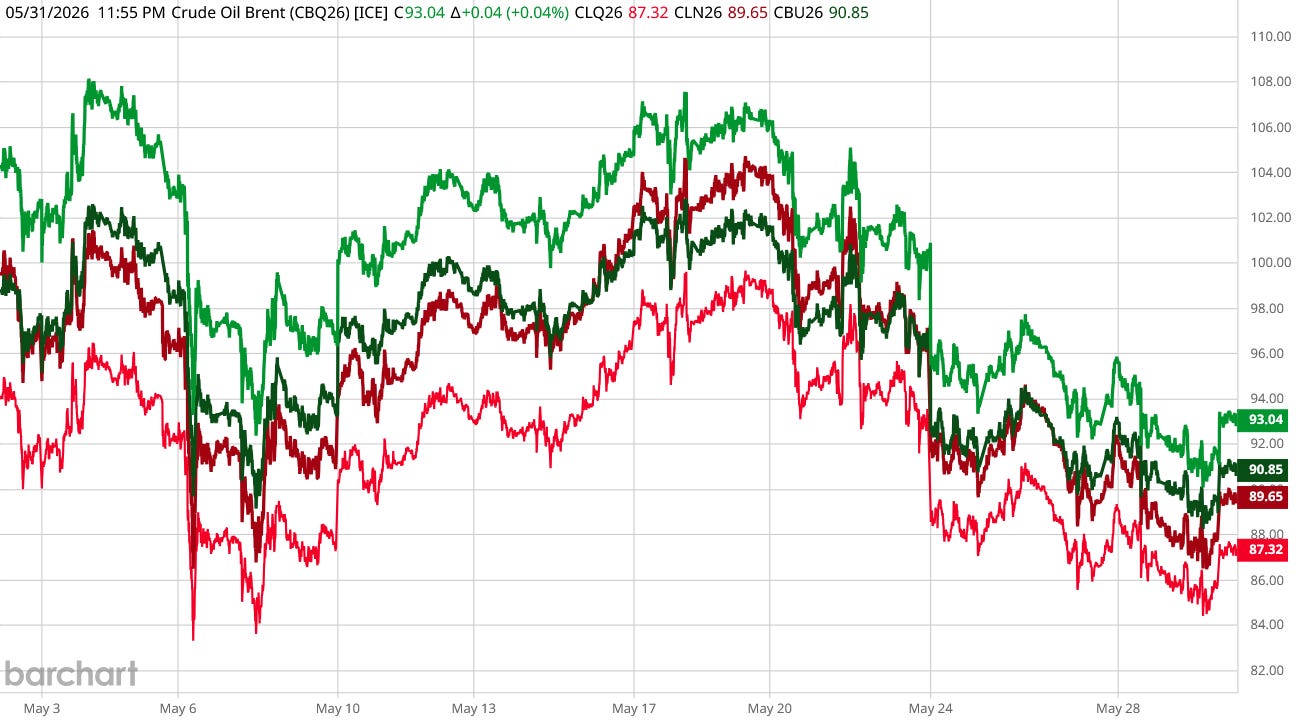
Remember how CNN said oil prices “jumped”? I think they meant to say “dropped”.
Actually, they probably did mean to say “jumped”, but the correct word would have been “dropped”, although that would have not made for nearly as gripping a headline.
Food Price Inflation Cooled, Durables Dropped
Food price inflation also did not jump in May, but cooled, from 0.5% month on month to .16%
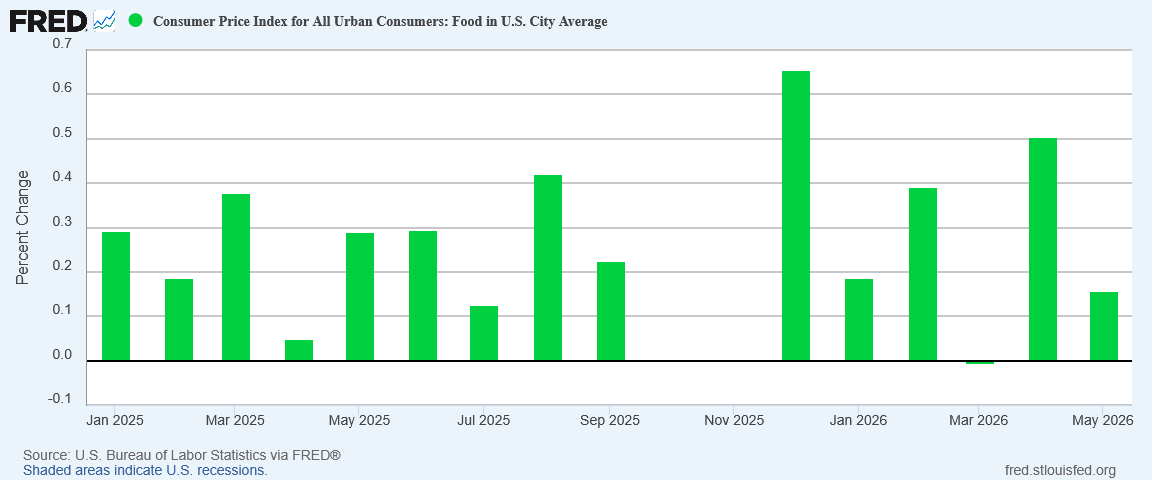
May food price inflation month on month was actually the third lowest food price inflation print since the start of President Trump’s second term.
Durable goods printed their second consecutive month of outright deflation month on month.
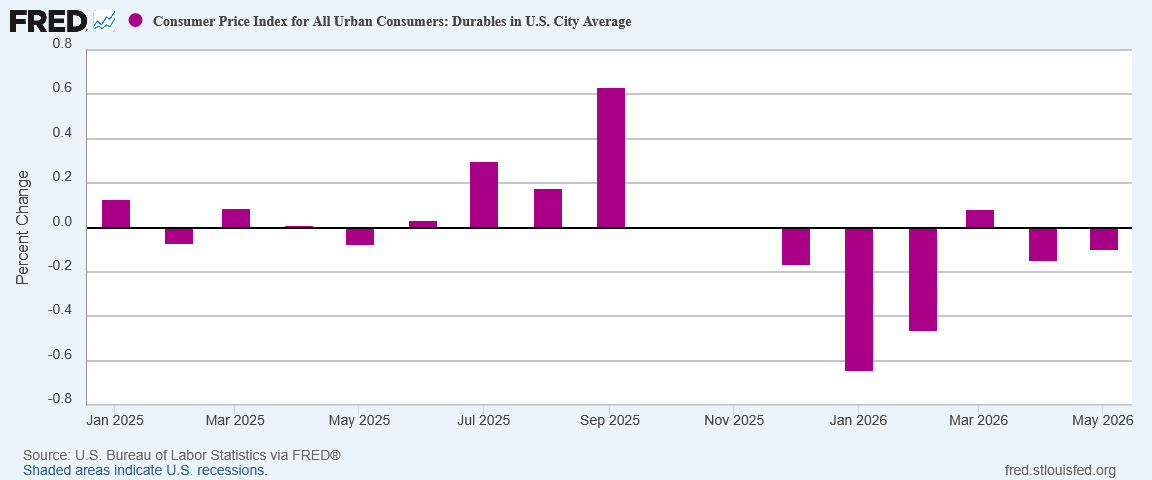
It is rather difficult to credibly speak of inflation surging when the data is printing deflation.
Even nondurable goods printed disinflation month on month, from 1.4% in April to 1.2% in May.
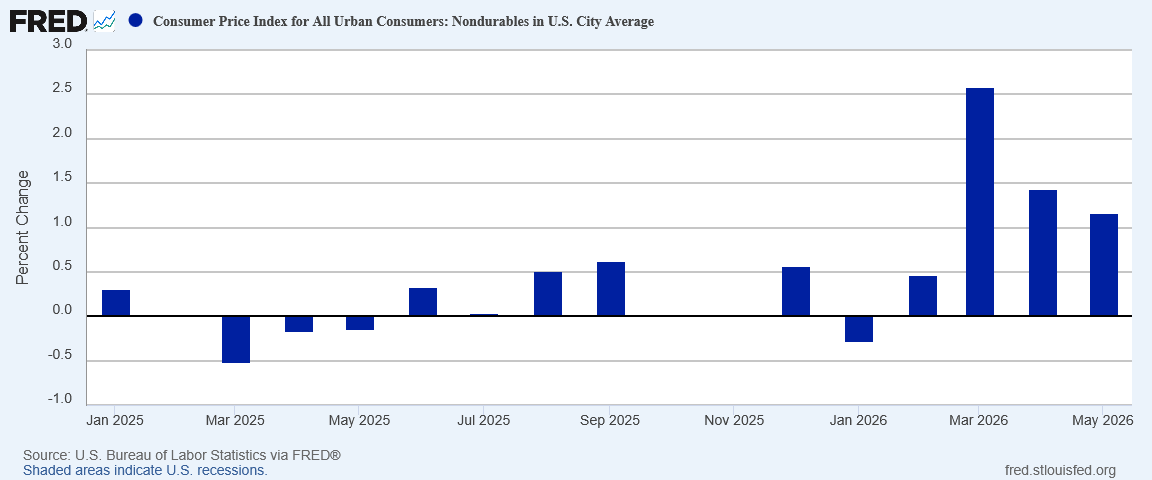
“Aha!” I hear you shout excitedly, “1.2% is higher than it was all last year!”
That is true. For the past three months nondurable goods price inflation have been considerably above where was throughout 2025.
However….
Nondurable goods includes energy and fuel, and when we put the nondurable goods and energy indices side by side, it is immediately clear from where literally all nondurable goods price inflation month on month comes.
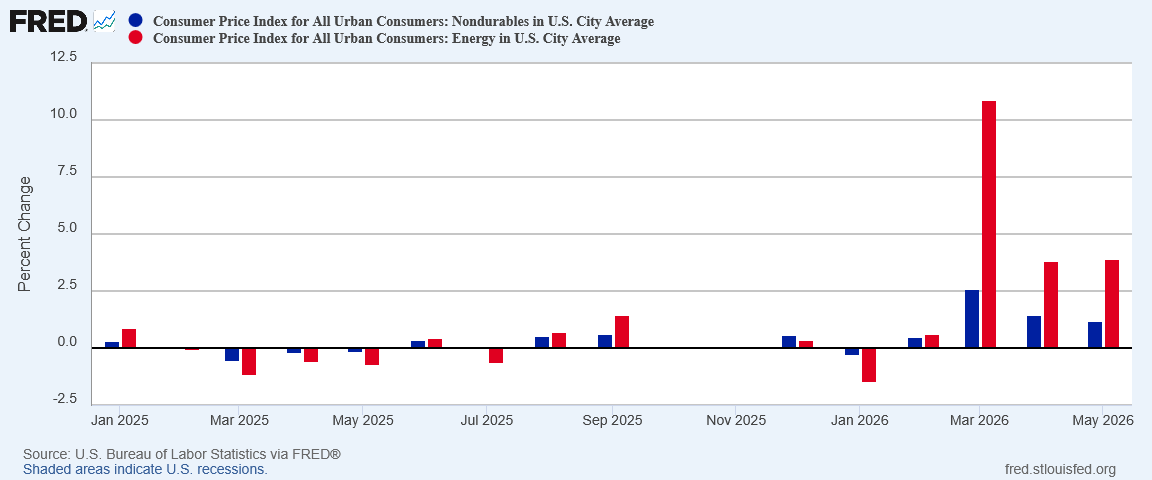
If nondurable goods overall showed disinflation, and energy showed marginal inflation, printing well above the nondurable goods index overall, then we most likely have nondurable goods price deflation for everything except energy.
Your Mileage Will Vary, And So Will Inflation Rates
While headline inflation year on year is a sizeable number, when we look at the components of that inflation, we see that energy is by far the only category showing significant energy price inflation.
We see that if we index the components of consumer price inflation to January 2021.
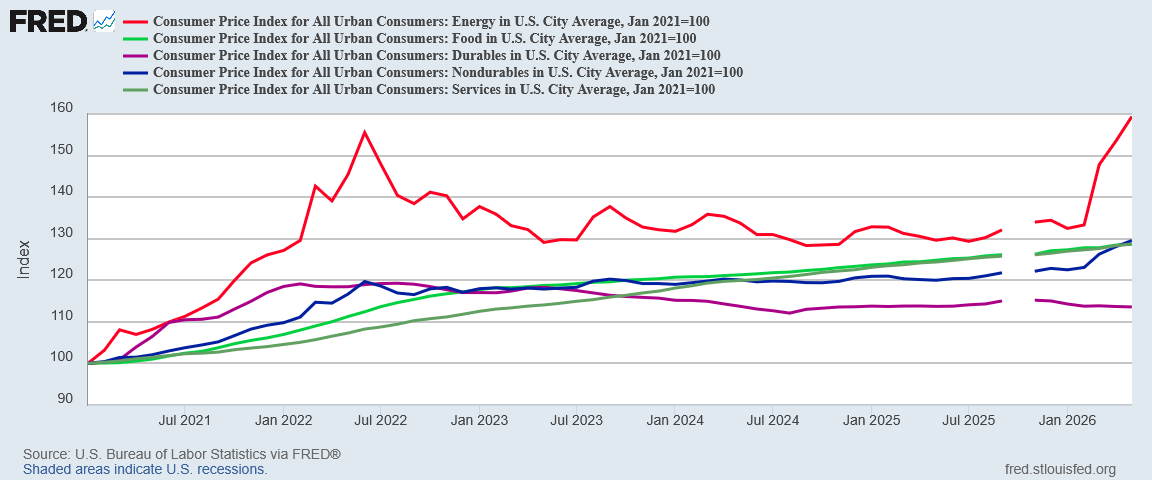
Durable goods have been in a long-term deflation trend, and even nondurable goods were largely treading water in May.
Even if we bring the index forward to January 2025, we still do not see significant inflation outside of energy.
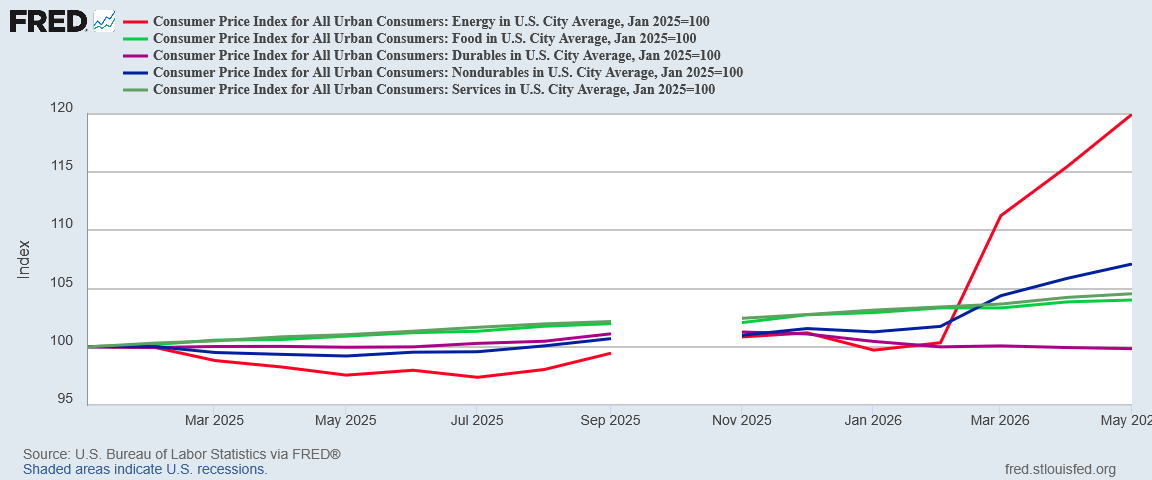
When we pause to consider that much of the rise in nondurables is because of energy, it immediately becomes clear that we are not seeing any substantial inflation at all except for energy.
We know why we are seeing energy price inflation. The data indicates we are not seeing much inflation anywhere else.
To blithely speak of inflation “jumping” when the data shows the reality to be far more nuanced is stupidity at best, malice at worst, and gaslighting regardless. The reality is that there is some inflation beyond energy, but the bulk of May’s consumer price inflation print is energy, almost to the exclusion of everything else.
This Is Not The Stagflation Shock We Feared (Not Yet)
We should not pretend that a headline consumer price inflation rate of 4.2% year on year is a good inflation print. It isn’t.
Headline inflation rose in May, rising not quite as much as it rose in April.
Yet virtually all inflation components showed disinflation for May, rising by less than they did in April. Without energy price inflation, we might have even seen more outright deflation than we did.
Nor should we pretend that the energy price shock is not real. It is extremely real, and very likely will have some very real consequences.
We should also not lose sight of the fact that the war with Iran is ongoing, that the Strait of Hormuz is still illegally closed, and that Iran has roiled energy markets by closing off the Strait.
The forces which injected a price and supply dislocation in global oil markets, thus producing a spike in consumer price inflation here in the United States, are still present. Those forces may even be getting worse.
If (when?) the buffering effects of large scale strategic petroleum reserve releases is exhausted, and if the Strait of Hormuz remains blocked, we could very easily see another energy price shock even greater than the one we saw in March. We might even see a contagion effect as inflation moves beyond energy prices and into multiple supply chains and output channels. What China has been seeing for the past couple of months we could be seeing in the US economy within a month or two.
The disruption of global oil supplies as a result of Iran illegally closing the Strait of Hormuz and shutting off 20% of the world’s oil flows is an unequivocal stagflation force and will, if it is not buffered and marginalized, have impacts which will reverberate through the US economy.
That disruption is threatening or producing stagflation in virtually every economy on earth. That disruption has not yet produced significant stagflation in the United States.
Perhaps that is because the United States is reaping significant benefit from strategic petroleum reserve releases. Perhaps that is because the United States economy is proving to have greater strength and resilience than we might have been tempted to conclude.
Regardless of the reason, the reality is that we are not seeing any destabilizing price surges outside of energy prices, at least not yet.
That could change. If the closure of the Strait of Hormuz continues for long enough, it very likely will change. Depending on what we see in producer price inflation for May (remember, the PPI is a leading indicator for the CPI), we may see destabilizing price surges outside of energy by July or August.
We are are not seeing those destabilizing price surges outside of energy in the May Consumer Price Index Summary. Energy price inflation is up, and that is pushing headline inflation higher. That is the sum total of the inflation we are seeing.
Even at that, the inflation we are seeing in May is noticeably less than what we saw in April. The inflation we saw in April was noticeably less than what we saw in March. The energy price shock was at its most shocking in March, two months ago.
That is what the Consumer Price Index data plainly shows, but that is not what corporate media is telling you.
Corporate media is feeding up headlines that say inflation is accelerating rather than decelerating. Corporate media is feeding up narratives that say prices surged more in May than in March. Corporate media is feeding up stories on inflation that are simply not accurate, and in some instances are demonstrably not true.
Consumer price inflation for May was definitely not good. 4.2% headline inflation year on year qualifies qualifies as “bad”.
Corporate media gaslighting on the actual state of consumer price inflation for May is proving to be even worse. Again.
For most of my life, the mark of a good journalist was that he was factual. Not spewing his opinions, or skewing the data to fit his views, but FACTUAL. Somewhere around twenty-five years ago, the collage journalism curriculums shifted to being about “advocacy”. Maybe the young idealists thought they were doing good to advocate instead of report, but the long-term result has been the destruction of media credibility. If all readers know that a writer is spinning the data to fit an agenda, why should we turn to that writer when we are looking for reliable information on which to form our own opinions? If I want to read an opinion, I turn to the “opinions” section of the newspaper. Today’s media has lost their credibility as REPORTERS.
If I want facts, I turn to Peter Nayland Kust, and daily bless him for being factual. Thank you, again, Peter!
https://www.theepochtimes.com/world/trump-says-us-to-hit-iran-very-hard-will-take-control-of-oil-markets-6046551?utm_source=ref_share&utm_campaign=copy