


The September Producer Price Index Summary was a grim warning that more inflation was coming.
Then came the October Consumer Price Index Summary, reporting that inflation had cooled for the month.
What are we to make of the October Producer Price Index Summary? Is it another warning that inflation is going to keep rising?
The Producer Price Index for final demand rose 0.3 percent in October, seasonally adjusted, the U.S. Bureau of Labor Statistics reported today. Final demand prices advanced 1.4 percent in September and 0.4 percent in August. (See table A.) On an unadjusted basis, the index for final demand increased 6.5 percent for the 12 months ended in October, the largest 12-month rise since moving up 7.4 percent in November 2022.
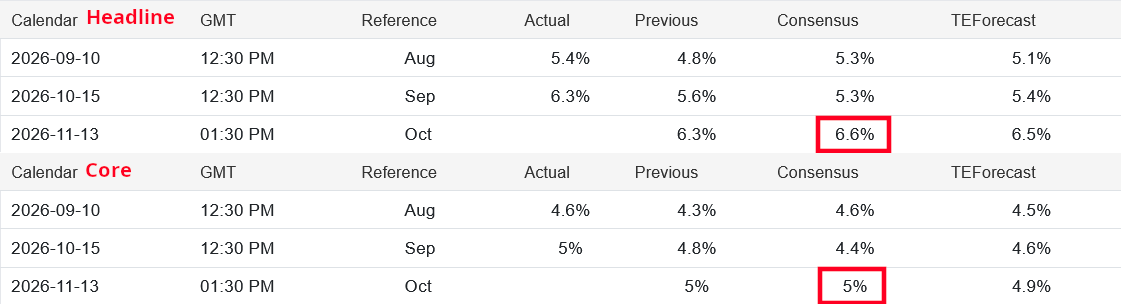
By the numbers, year on year producer price inflation rose 0.2pp to 6.5% at the headline level. Less food and energy producer price inflation remained nearly steady at 5%.
The headline number came in 0.1pp below Wall Street’s expectation.
Month on month, producer price inflation cooled dramatically, rising 0.3% at the headline level, again 0.1pp below Wall Street’s expectations.
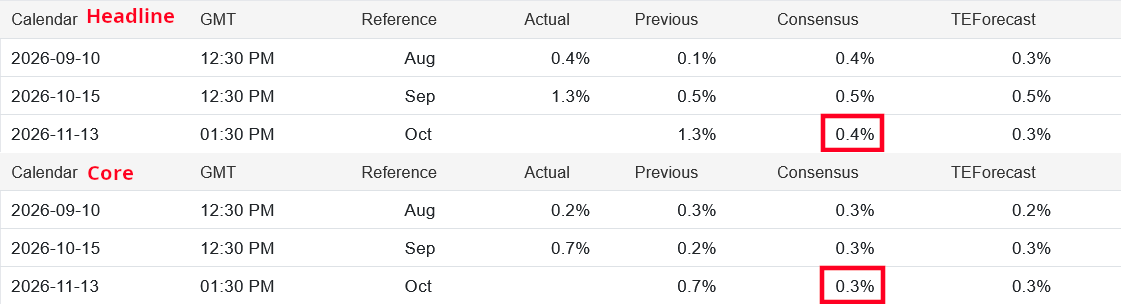
Year on year producer price inflation rose from September. Month on month producer price inflation declined from September.
Is this a signal that we will see an uptick in consumer price inflation perhaps next month? Or is this a signal that inflation overall has peaked, and there is not much more inflation to be had?
Unlike the doggedly incurious corporate media, we need to unpack the details to answer that question.
Corporate Media Sticks To “Gloom And Doom.”
A quick survey of corporate media’s reporting on the October PPI print shows that “gloom and doom” remain very much integral to their inflation reporting.
CNN led the way, emphasizing the rise in year on year producer price inflation.

Wholesale inflation accelerated last month to its highest rate in nearly four years, Bureau of Labor Statistics data showed Friday.
ABC News linked the PPI report to the CPI report from earlier in the week, accentuating that the CPI print came in above expectations and ignoring that consumer price inflation had actually cooled on the month.
While the annual rate marked the highest reading in years, the figure came in slightly below economists’ expectations of an increase of 6.6% from a year earlier.
CNBC positioned the PPI print as further justification for the anticipated increase to the federal funds rate when the FOMC holds its December meeting.
The report comes just a few weeks ahead of the Federal Reserve’s next policy meeting Dec. 8-9. Markets are fully pricing in a quarter percentage point increase in the central bank’s key overnight borrowing rate, with slight odds that the Federal Open Market Committee might opt for a half-point hike.
When we look at the Producer Price Index by Commodity, however, we do not see either the headline or the core indices accelerating.
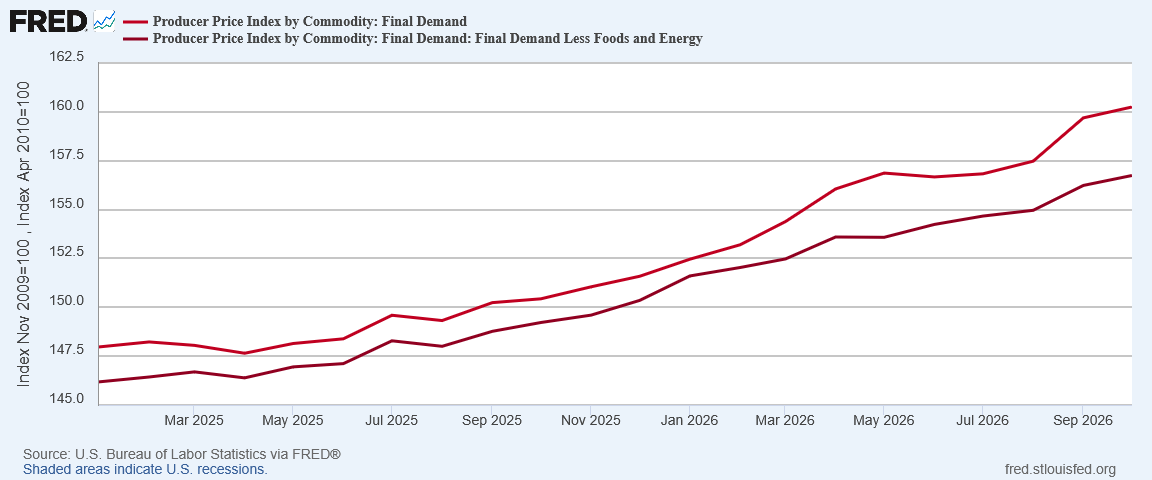
When the index chart bends down, as both the headline and core indices do, inflation is decelerating, not accelerating.
Straight away we can see that corporate media is once again exaggerating the data to sell a “gloom and doom” narrative. The index data shows that producer prices are clearly rising, but it does not show that producer price inflation is surging or even starting to surge out of control.
Month On Month Shows Where Inflation Is
While the year on year inflation figures are the most commonly referenced, even by me, we do well to remember that, by definition, the year on year numbers are far more a reflection of inflation’s recent history than inflation’s present.
The year on year producer price inflation metric tells us how inflation has behaved over the past twelve months.
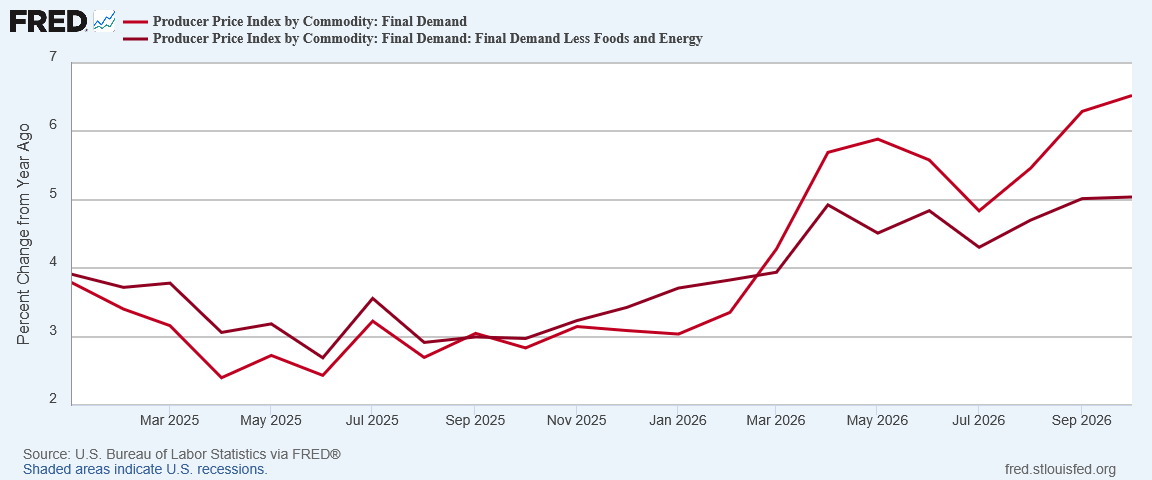
Yet even this figure does not show inflation “accelerating". Just like the index itself, it shows inflation decelerating.
To understand where inflation is at the present time, we must look to the month on month producer price inflation rate.
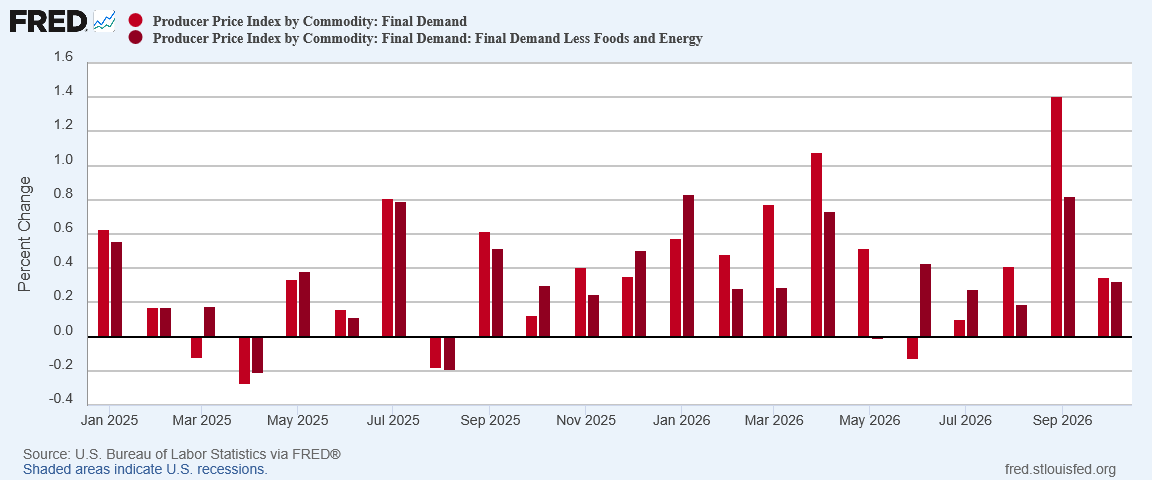
Month on month, producer price inflation cooled dramatically at both the headline and core (less food and energy) levels.
Corporate media is reporting something that is simply not the case. Producer price increases are not “heating up.” The data does not show producer price increases heating up.
PPI Prints Energy Price Deflation
One place we are not seeing an advance indication of future inflation is in the PPI Energy subindex. For October the PPI printed outright energy price deflation.
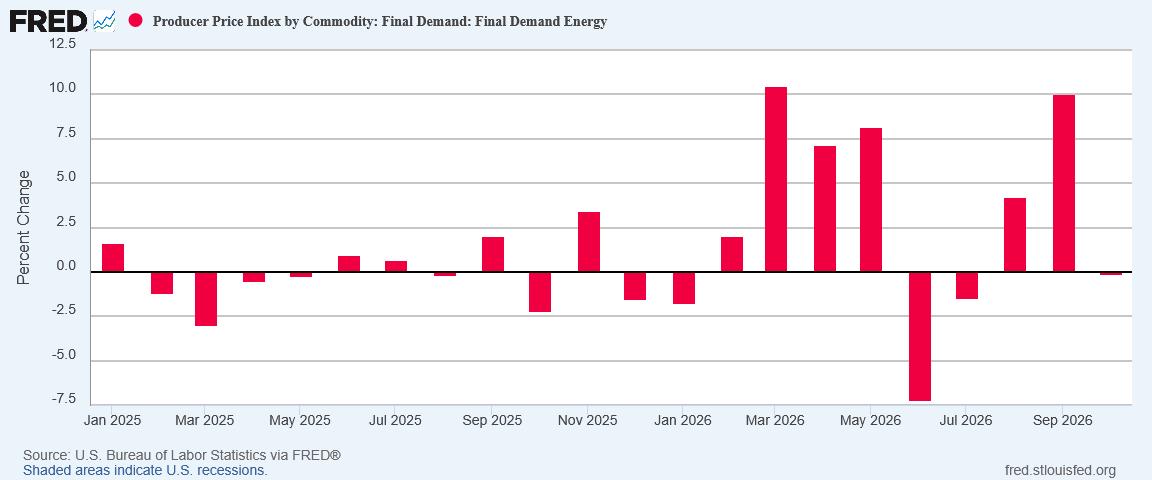
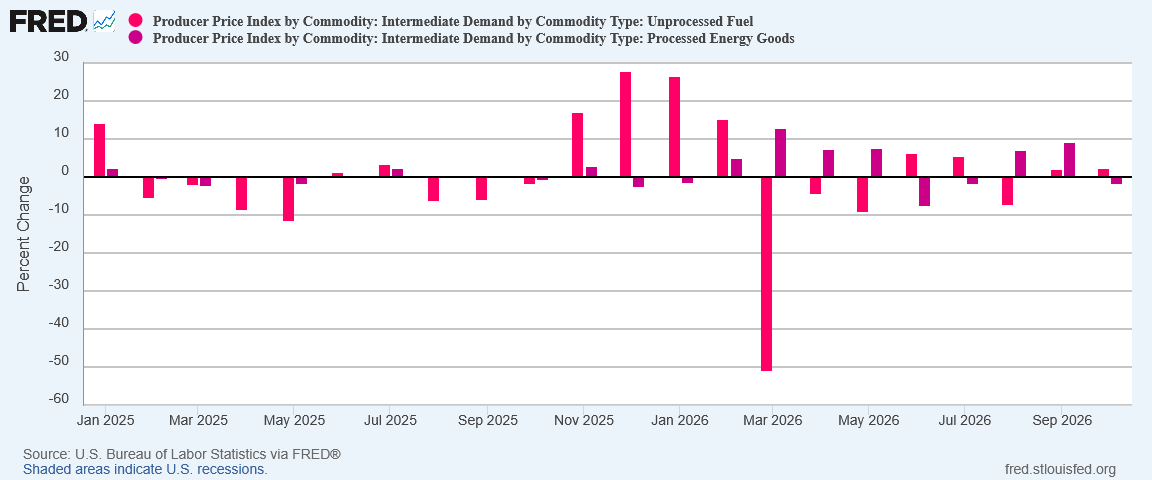
Intriguingly, the deflationary impulse for energy comes primarily from processed rather than unprocessed fuels.
We can see the impacts of energy price deflation within the PPI play out at the pump, with diesel dropping 1.4% during the month and gasoline dropping 7.3%.
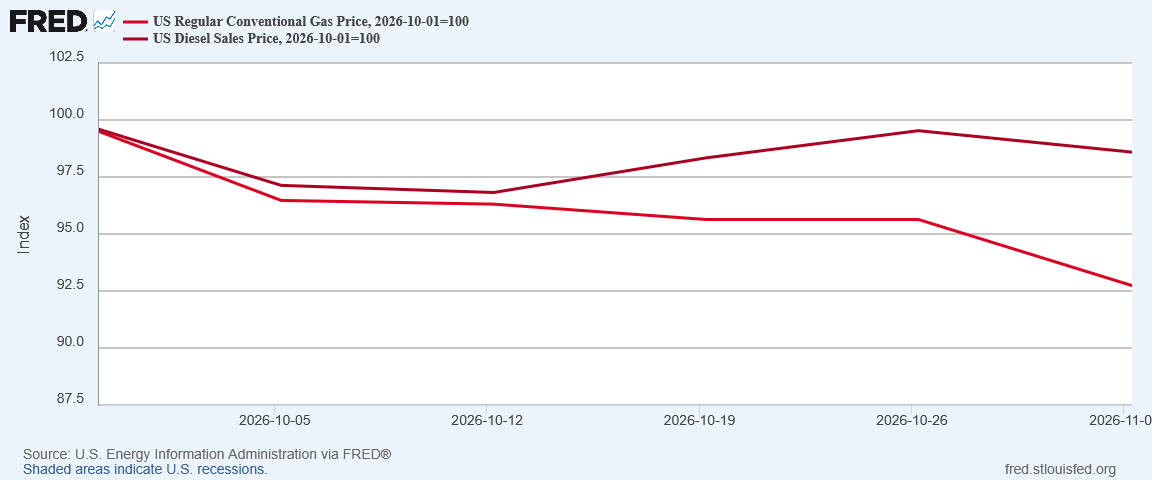
The PPI is printing energy price deflation and we are seeing energy price deflation.
Whatever producer price inflation occurred for goods was moderated by that energy price deflation.
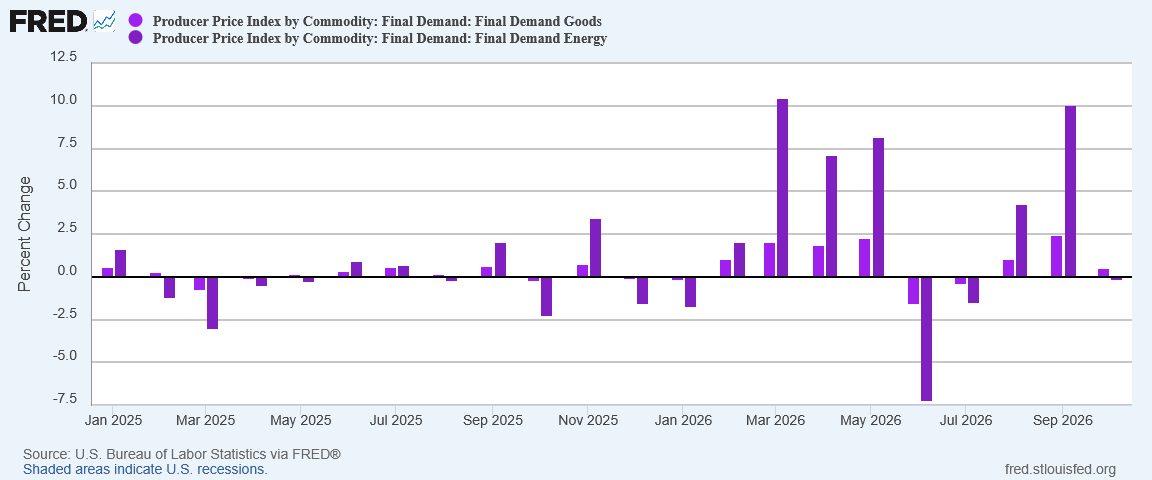
Yet even without the cooling influence of energy prices, producer price inflation for goods overall was considerably lower in October, a welcome change from September’s superheated number.
Food Price Inflation Did Increase
One inflation signal which does bear watching is the increase within producer price inflation for food.
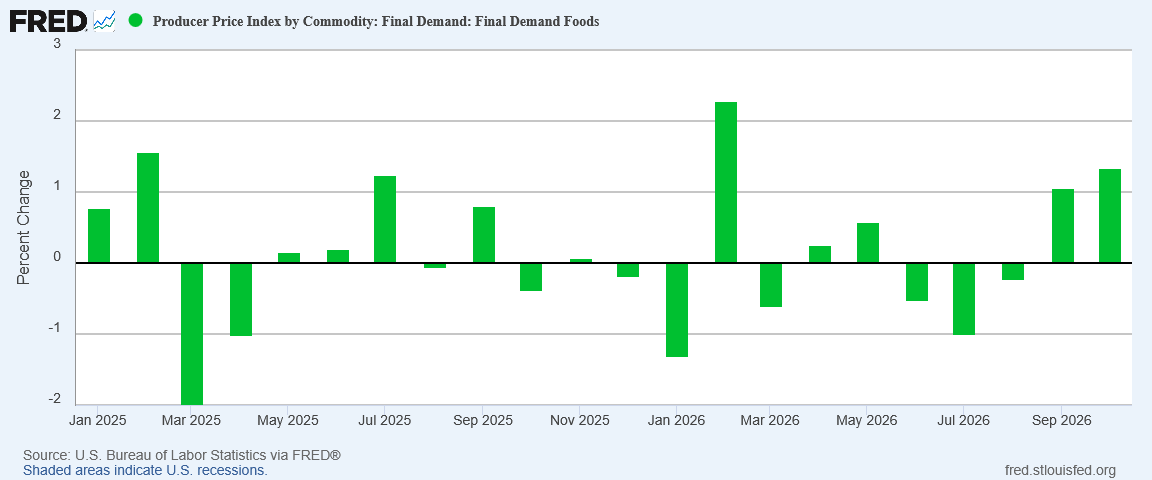
After producer prices for food fell during the summer months, October now marks the second month in a row they increased.
Yet we should not presume that food price inflation is going to persist long or even rise to a substantial level. Food price inflation is on the rise, but fertilizer prices have declined in recent months, or held steady.
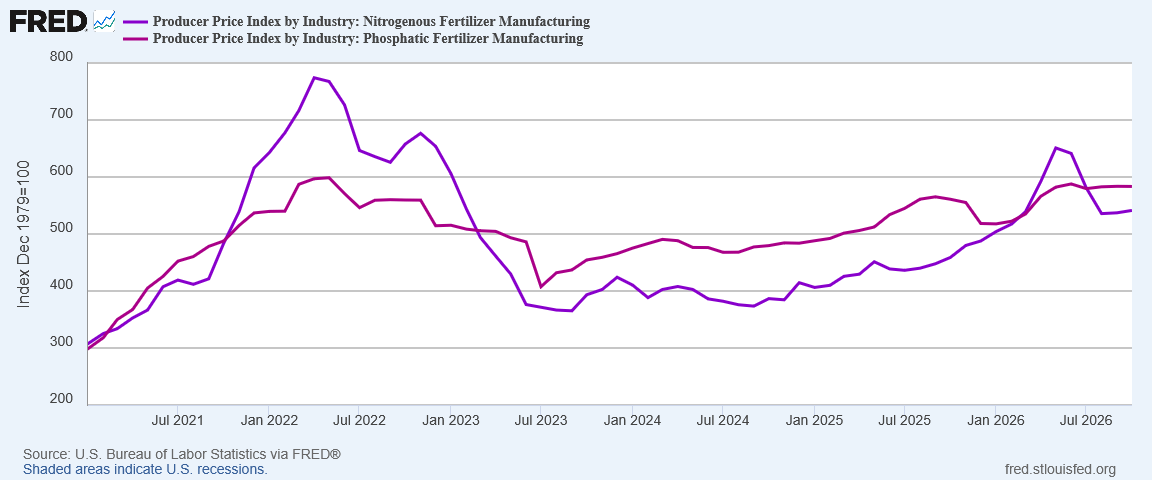
Nitrogenous fertilizer prices peaked in May and have been trending down ever since (despite marginal rises in September and October) Phosphatic fertilizers stabilized in May and have remained largely constant.
Month on month this did produce a small rise in producer price inflation for fertilizers.
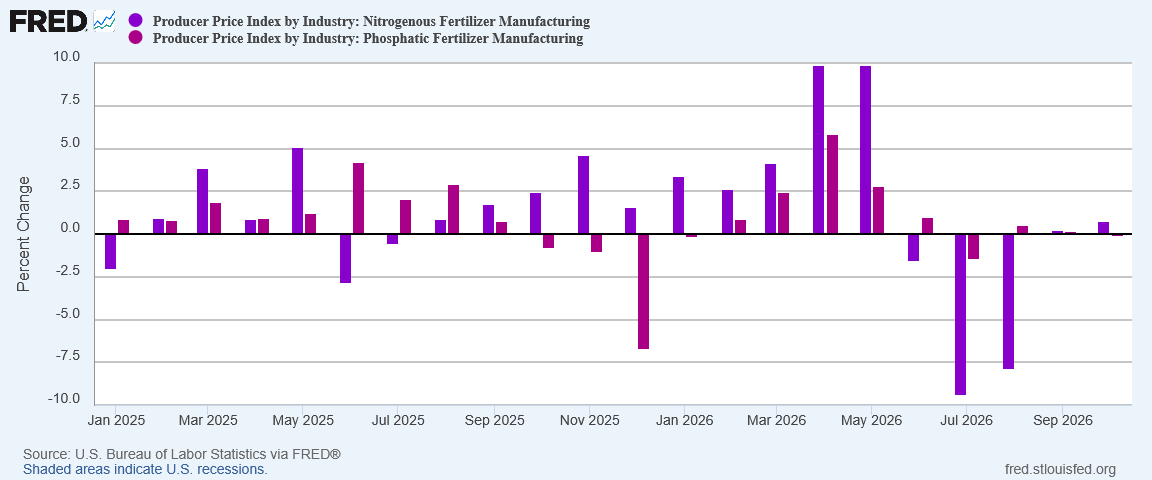
Year on year, however, the macro trend remains inflation cooling and declining.
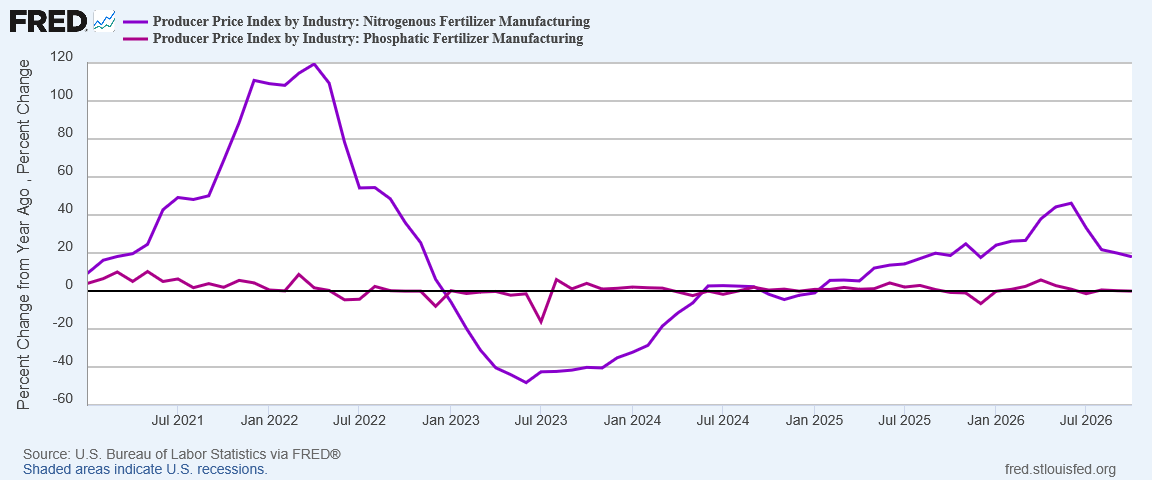
Fertilizers are a core price driver for food prices. Surges in fertilizer prices will produce surges in food prices to varying degrees. In October, we are not seeing fertilizer prices that would push food prices up next year.
Food price inflation itself did rise in October, having risen as well in September. For the short term, that is not a good sign!
Service Price Inflation Also Cooled
Service prices also slowed their rise in October, notching a 0.8pp drop in month on month producer price inflation.
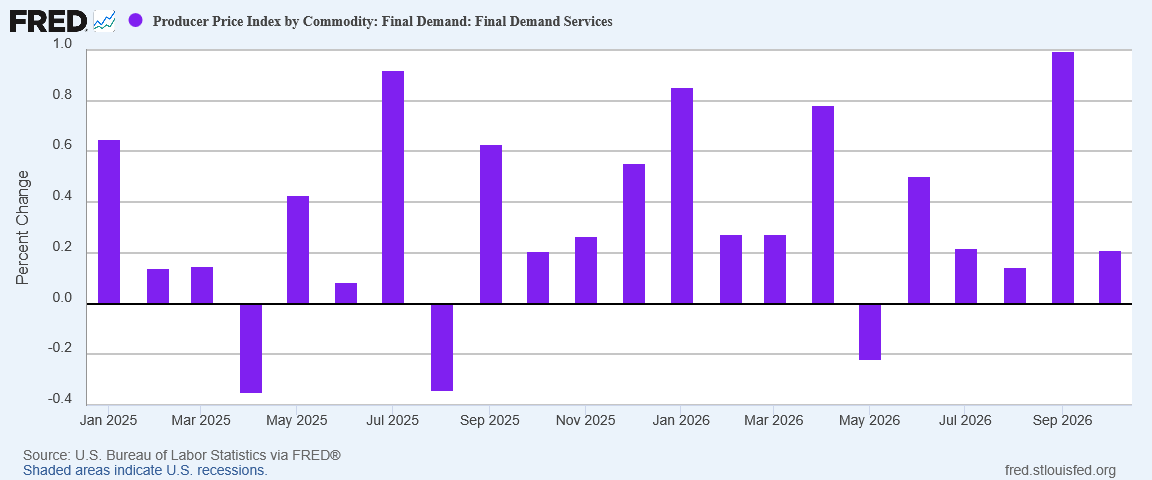
While producer price inflation did not drop equally across all service components, it is worth noting that producer price inflation did drop across all service components.
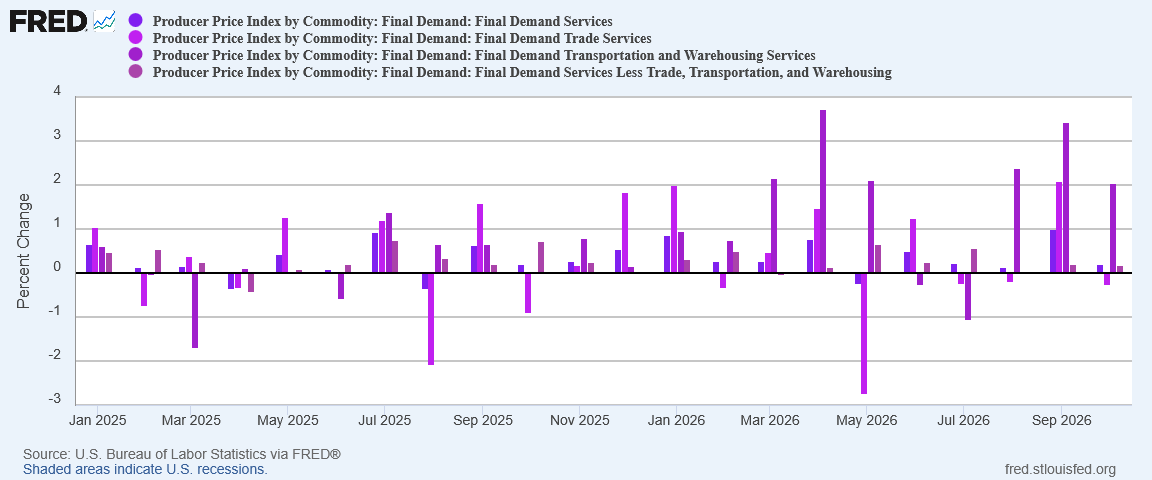
While transportation and warehousing services still rose at a fairly steep 2% month on month, trade services printed deflation, and both aggregate services and services less trade, transportation, and warehousing printed only marginal inflation on the month.
Transportation and warehousing prices indicate there is still some inflation to pass through to show up on the consumer price index over the next few months, but beyond that October’s PPI print is not showing any real signal for increased inflation on the CPI for services.
Intermediate Demand
The PPI subindices which perhaps give the clearest signal for future consumer price inflation, Intermediate Demand, cooled significantly on the month.
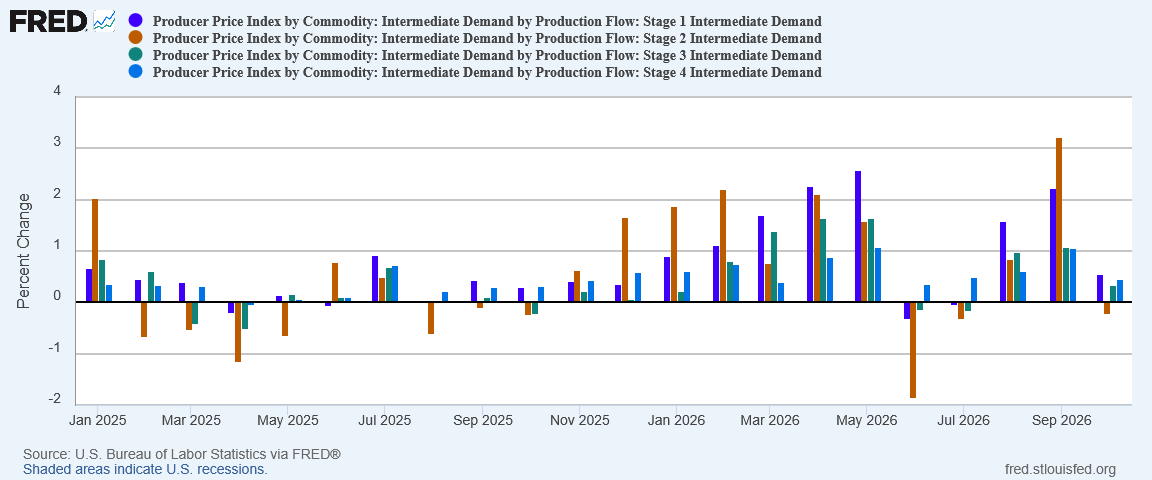
Stage 2 Intermediate Demand printed outright deflation on the month.
Intermediate demand goods are goods sold primarily to businesses. Intermediate demand outputs are production inputs farther along a manufacturing and supply chain.
Structurally, an easing of intermediate demand inflation pressures today eases inflation pressures for final goods tomorrow—and, ultimately for consumer prices. The significant drop in producer price inflation for intermediate demand in October means there is less impetus from the producer price index to push prices up in November and December.
Less impetus is deceleration, not acceleration.
What Do Commodities Prices Show?
A primary inflationary pressure on all producer prices is a producer’s cost of various inputs. Every good and service offered for resale is by definition the result of combining various resources acquired in various markets.
A survey of commodities prices themselves will reveal the extent to which there are resource constraints creating inflationary pressures on producer prices.
When we look at the broad commodities price indices and their movements over September and October, we do not see any sustained pressure pushing up resource costs.
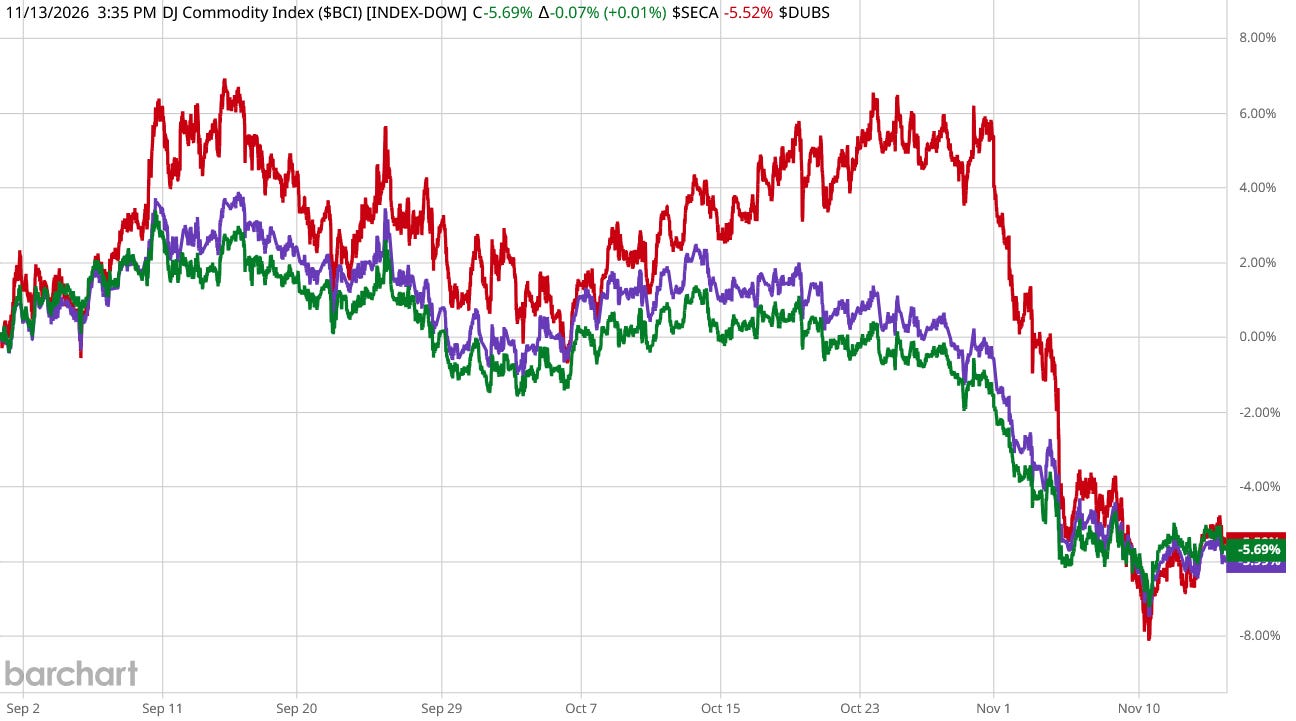
Since mid-September, only the S&P Enhanced GSCI index showed any capacity even for sustaining a price level. Other principal commodities indices have been trending down and at an increasing pace after mid-October. Notably, even the S&P Enhanced GSCI reverted to the mean and moved back into alignment with other indices. Whatever was distorting that index up until the end of October has since ameliorated.
Certainly the indices are not showing any inflationary trend which could cause producer price inflation to accelerate.
When we examine various specific commodities prices we also do not see much which could result in accelerating producer price inflation.
Di-ammonium Phosphate, a key fertilizer ingredient, has not trended down much even recently, but neither has it trended up since August. Where a price is not rising there can be no inflationary pressure overall by definition.
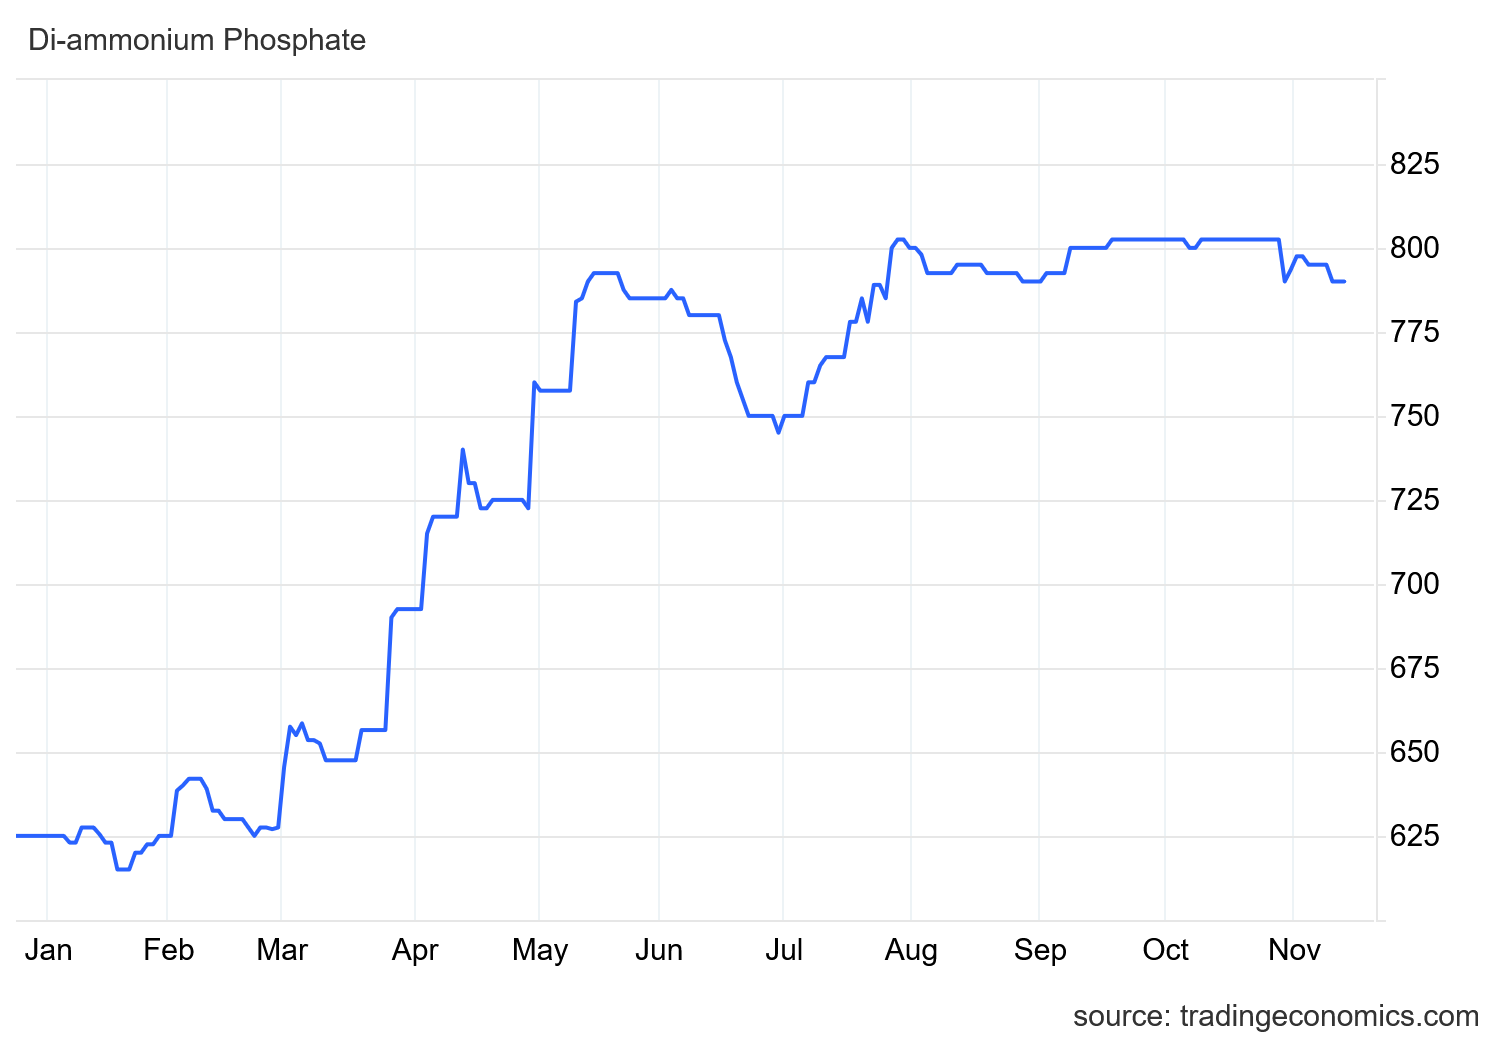
Several other industrial commodities, such as Urea, Sulfur, and Aluminum have been in broad decline since at least the summer.


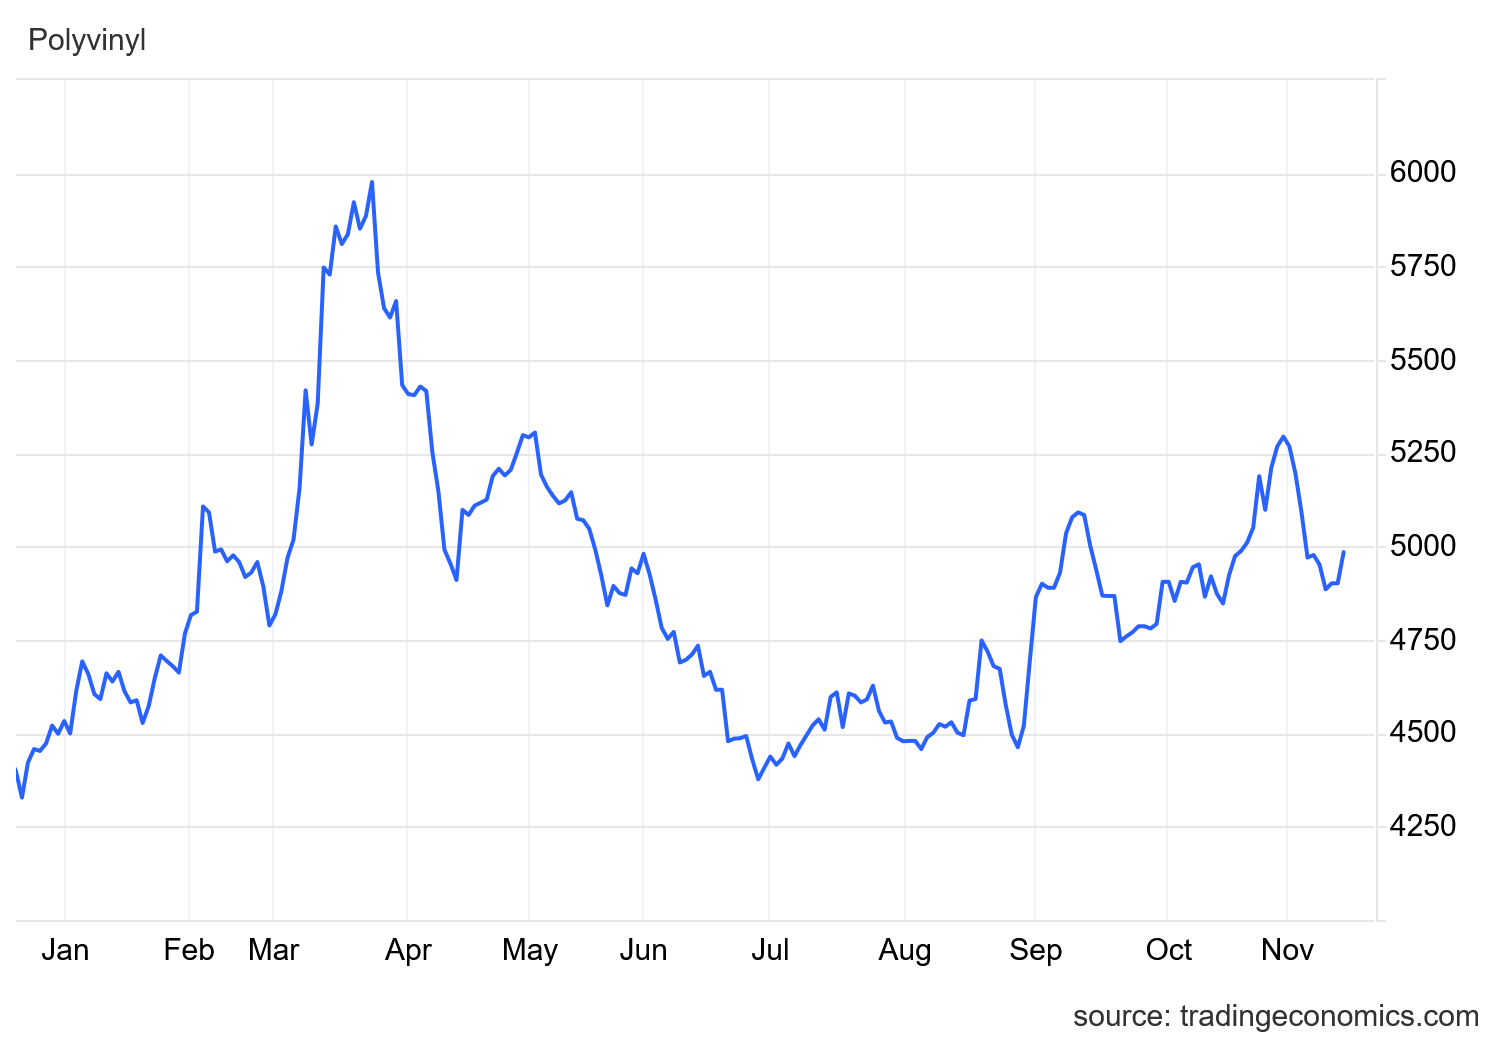
Other industrial commodities, such as polyvinyl, have been moving up somewhat recently, but are still well below the price surges which immediately followed Operation Epic Fury.
There are industrial commodities such as polyethylene, polypropylene, styrene, and bitumen which have shown inflationary pressure until quite recently, then declined significantly.


The movements of industrial commodities in particular are significant as many are obtained through petroleum refining, making their availability an intrinsic part of the ongoing “oilpocalypse” supply shock emerging from the twin wars in Ukraine and the Persian Gulf.
Yet even the recent movements of metals such as copper and steel rebar are showing price decrease rather than price increase.


When prices are trending down we have deflationary pressures rather than inflationary ones.
As commodities are the inputs for the goods and services within the Producer Price Index, if there is acceleration within producer price inflation, we should expect to see across the broad cross section of commodities a trend of rising prices. We are not seeing a trend of rising prices. We are seeing trends of declining prices and stable prices, as well as trend reversals within several commodities.
Without a broad trend of rising commodities prices, there are few if any plausible sources for an acceleration within producer price inflation.
Producer Price Inflation Slowed
The Producer Price Index itself rose in October. There is no denying that. Producer prices are rising, and will continue to rise. We are not likely to see producer price deflation except occasionally.
Yet rising producer prices does not mean producer price inflation is accelerating. For inflation to be “accelerating”, prices have to rise by a greater amount in the most recent month than in the previous month. The producer price index chart must bend up and not down. Even if the index itself has risen, if there is a downward bend in the graph the inflation rate has slowed down.
In September we saw producer price inflation surge. Given that the PPI is in many respects a leading indicator for the CPI, that September producer price print signaled we would see hotter consumer price inflation in October.
We saw cooler consumer price inflation in October. Consumer prices rose, but more slowly than anticipated.
The October producer price print is signaling cooler consumer price inflation for November, and possibly for December as well.
The signals within the Producer Price Index itself we find confirmed by broad trends of declining or stable prices across a cross section of commodities and industrial inputs. The price movements we need to see in industrial inputs to effect accelerating producer price inflation, and thence accelerating consumer price inflation, we are not seeing at present.
This is by no means a guarantee that we will see cooler consumer price inflation in November or December. The September producer price print was clearly not a guarantee of hotter consumer price inflation for October, so even within just that data we can see the inherent problematic nature of economic signals.
The October Producer Price Index Summary shows that producer price inflation slowed in October, much the way Consumer Price Inflation (CPI) slowed for the month. The October producer price print shows less inflationary pressure to transmit into the coming months.
What corporate media is calling “accelerating” producer price inflation is actually decelerating producer price inflation. Aside from food, there are no inflationary signals in the October PPI data indicating inflation will be higher in the future.
Producer prices rose in October, but producer price inflation slowed. That is what the data indisputably shows.
I am always amazed at how extremely good you are at this, Peter. This is a task that requires insight, experience, accuracy, and an unbiased assessment, and you are just the BEST.
I so wish that President Trump could know about All Facts Matter. He would scoop you up so fast that you’d be on his team within hours!