

Don't Like The Inflation Numbers? Just Make Up New Ones
Why The "Experts" In The Financial Press Need To Just Stop Talking

As we apprehend how corporate media treats (or mistreats) the inflation numbers we get every month, it is important that we be mindful that Allan Sloan has been writing about business since forever, and has won an impressive award numerous times.

Allan Sloan, who has written about business for more than 50 years, is a seven-time winner of the Gerald Loeb Award, business journalism’s highest honor.
Who is Allan Sloan? Someone who has been writing about business for over five decades—an “expert” nonpareil.
Keep this in mind, because it means his slicing and dicing of the latest inflation data for the US is how an “expert” wants us—want you—to view the data. We are to accept his view as the “correct” view simply because he said so.
It's time to have some fun with numbers.
Specifically, with the cost-of-living numbers that so many people — including the Federal Reserve’s board of governors — pay so much attention to.
Allan Sloan doesn’t like the numbers the Bureau of Labor Statistics has given us, so he has decided to generate his own numbers. We must pay attention to his numbers because he is, after all, an “expert” nonpareil.
He begins by telling you the Consumer Price Index numbers are wrong.
Let’s start with the Consumer Price Index numbers released by the federal Bureau of Labor Statistics on May 10. The headline number was 4.9%. However, even though that’s the 12-month number, it’s clearly not the amount by which the CPI is rising these days.
How do I know that?
By looking at the month-by-month numbers and using some common sense.
Of course, one could divine this directly from the Consumer Price Index Summary, as I pointed out when the data was released:
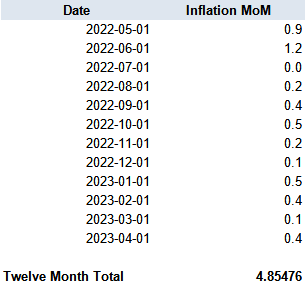
What follows is his manipulation “analysis” of the month-on-month changes in the Consumer Price Index for the past twelve months. For reference here are the month on month percent changes in both the CPI and PCE price indices, at both the headline and “core” (i.e., with food and energy stripped out) levels.

He starts by making a momentous discovery—headline inflation changes diminished significantly after last June.
Yes, the monthly changes add up to the headline 4.9% number. But the detailed numbers show that 2.1% of that 4.9%—almost 43% of the total increase—came in just two of the 12 months: May and June of last year.
Since the big 1.2% jump in June, the 10 months from July through April ran up a total increase of only 2.8%.
In other words, he took the monthly numbers and added them up to see what the graph above shows directly.
Remember, he is the “expert” nonpareil, so this is deep stuff!
He doesn’t like that number, so he decides to abandon “convention”.
Instead of being bound by the conventional 12-month number, let’s take the 10- month number and annualize it. By annualize, I mean expand the 10-month number to 12 months. That produces a 3.36% number, which we’ll call 3.4% to keep things simple. That’s a more accurate reflection of what’s going on in the economy now than the 4.9% number is.
By “annualize”, what he means is taking the month on month percentage changes for the ten months from July, 2022, through April, 2023, averaging them, and then applying the compound interest formula to that average.
This is his “more accurate” reflection of what’s going on in the economy than the original headline number—because he says it is.
(Note: appeals to authority are inherently fallacious. Appeals to your own authority are inherently foolish.)
Of course, what his “more accurate” reflection of what’s going on in the economy does not match are either the core PCE Index changes month on month or the core CPI changes month on month.

The significance of the May and June data from last year disappears when you factor out food and energy price inflation.
If you add up the 12 month totals for both the PCE and CPI core numbers, you get a number that is quite a bit higher than his 3.4%—and noticeably higher than even the headline number.
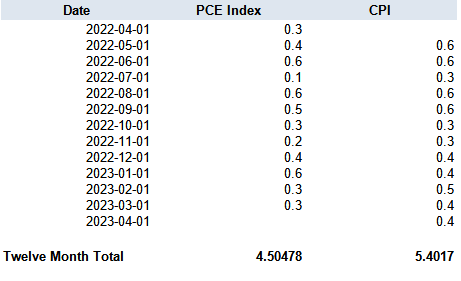
By this view of “what’s really going on”, annual consumer price inflation is a full two percentage points higher than his view of “what’s really going on”. But you should disregard core inflation gauges and go with his massaged metric because he’s the “expert” nonpareil.
The reason the Bureau of Labor Statistics and the Bureau of Economic Analysis compute their respective consumer price metrics without the food and energy sub-indices included is because food and energy tend to have greater volatility, so much so that their shifts can potentially obscure arguably more substantive inflation trends.
How much volatility do the food and energy subindices have? Enough for the energy subindex to completely overwhelm a chart of the principal subindices plus the headline change.

When we remove the energy subindex, we can more easily see the food volatility.

Readers may recall that I have discussed not only the volatility but the shifting consumer price changes within the various subindices that go into the headline CPI numbers.

The plain reading of the available data is that inflation is, by definition, economic damage inflicted by distortion of overall levels of both supply and demand.
Inflation due to a sudden scarcity of goods and services is not the result of an expanding economy, but a shrinking one.
Inflation that reduces real wages—as even Jay Powell has conceded is happening—is not inflation that is the result of people enjoying greater prosperity, as that would necessitate rising real wages.
Inflation that drastically alters relative prices among goods and services that every consumer requires—food, transportation, shelter, and energy—is inflation that is at every turn reducing the overall amount of these goods that can be acquired. Inflation means people are buying less yet paying more—which translates into a net reduction in economic output, not a net increase.
Allan Sloan disregards the volatility among the components that go into the headline CPI numbers—volatility which even the BLS, BEA, and Federal Reserve regard as highly dispositive to “what’s really going on”, as the commentaries provided by the BLS in their monthly inflation summary reports attest.
The index for shelter was the largest contributor to the monthly all items increase, followed by increases in the index for used cars and trucks and the index for gasoline. The increase in the gasoline index more than offset declines in other energy component indexes, and the energy index rose 0.6 percent in April. The food index was unchanged in April, as it was in March. The index for food at home fell 0.2 percent over the month while the index for food away from home rose 0.4 percent.
The index for all items less food and energy rose 0.4 percent in April, as it did in March. Indexes which increased in April include shelter, used cars and trucks, motor vehicle insurance, recreation, household furnishings and operations, and personal care. The index for airline fares and the index for new vehicles were among those that decreased over the month.
The all items index increased 4.9 percent for the 12 months ending April; this was the smallest 12-month increase since the period ending April 2021. The all items less food and energy index rose 5.5 percent over the last 12 months. The energy index decreased 5.1 percent for the 12 months ending April, and the food index increased 7.7 percent over the last year.
None of this is relevant to Allan Sloan—and, remember, he is the “expert” nonpareil.
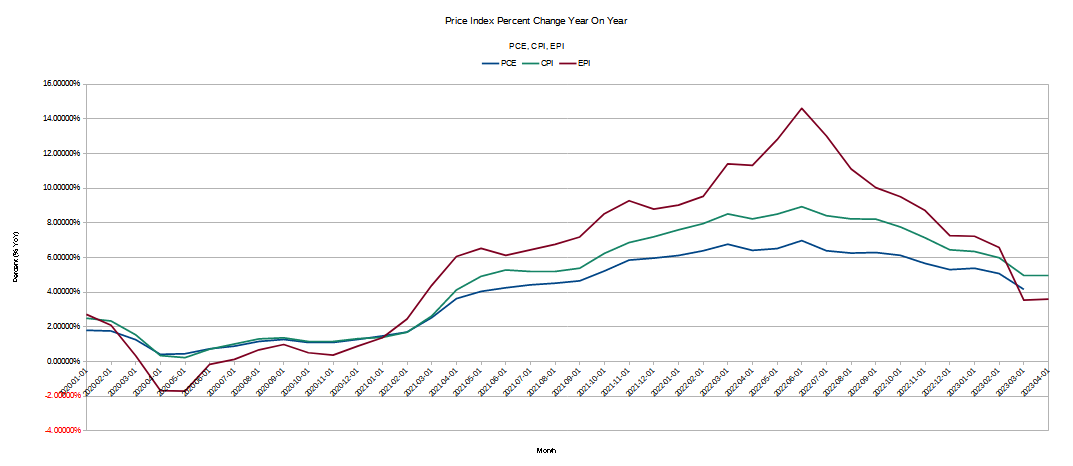
Volatility within the consumer price inflation data is something a good many inflation watchers besides myself address. Peter C. Earle, an economist with the American Institute of Economic Research, monthly puts out an alternate view of consumer price data, the Everyday Price Index.
The purpose of the AIER’s Everyday Price Index (EPI) is to measure changes in the prices of goods and services that are important to people’s everyday lives. The index reflects the price uncertainty (i.e. unexpected and unavoidable price changes) that people face with purchases they cannot easily adjust from one month to the next.
The EPI tracks a subset of prices from the broader Consumer Price Index (CPI) reported by the Bureau of Labor Statistics (BLS). The CPI includes prices of all goods and services purchased by a typical urban consumer. The EPI, in contrast, includes only goods and services purchased on a day-to-day basis that cannot be easily postponed or foregone.
The key distinction between the EPI and the CPI is that the EPI by design tends to emphasize volatility. We can see this directly when we compare the EPI metrics to the monthly consumer price data from the BLS.
The greater volatility in the EPI is particularly visible when we look at the month on month changes.
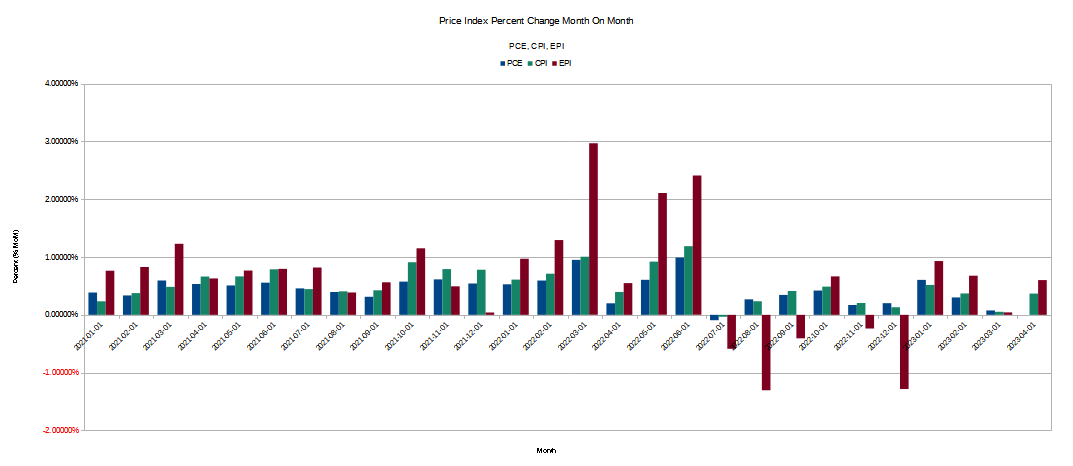
Volatility is an important dimension not just because of what it can mean in terms of actual impact to the customer, but because of what it means when we see a decrease in volatility, as we have seen in the year on year percentage changes for both the core PCE metric and the core CPI metric.

While the EPI emphasizes volatility, arguably a more important consideration for what is happening with consumer price inflation is that, at the core metrics, we are seeing very little volatility—we’re just seeing core consumer price inflation “stuck” at a high level.

Powell’s year of hiking the federal funds rate has altered core inflation by not very much, if at all. The impact on core inflation of two successive federal funds rate hikes in February and March has been almost exactly nil.
A lack of volatility is hardly an unalloyed good. As we see with the “core” inflation metrics, a lack of volatility can indicate a structurally higher level of inflation.
I might not be the “expert” nonpareil, but the idea that we might be faced with a more or less permanent 4-6% annual rate of price increase does not strike me as good news. I do know that no amount of twiddling and twaddling with the headline inflation rate to recast it lower will hide that structural rate of price increase at the core level.
Another point to consider about volatility—what has been going down has gone up before. While some price categories such as energy are actually in decline, and while others are not increasing as much as they have been, it is also important to realize that others have been much higher in the recent past. When we look at the more volatile EPI over time, we see that its declines tend to be more pronounced, as do its increases.
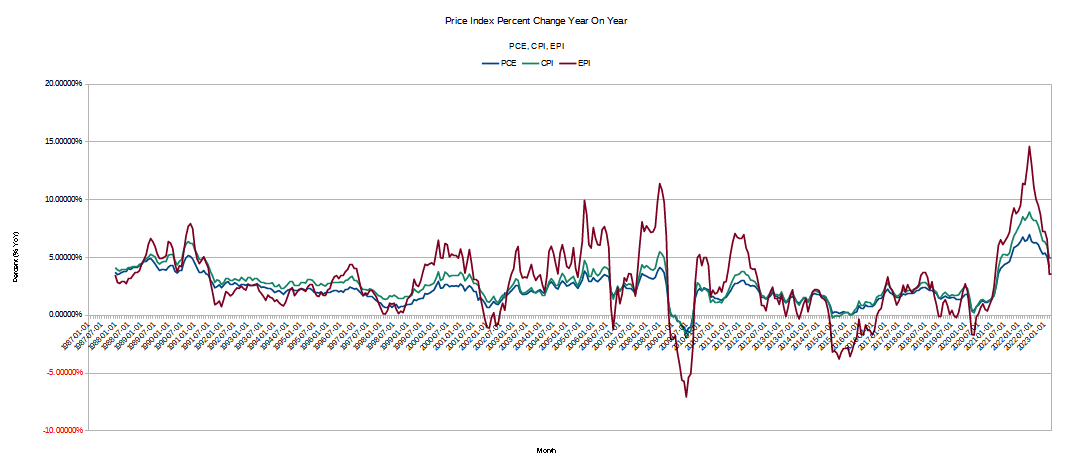
If one goes by the EPI rate of inflation, is is true that consumer price inflation is down significantly—but only because it was up even more significantly.
By any metric—CPI, PCE or EPI—the reality of consumer prices is that of increase, and of a greater rate of increase since 2021 than before.
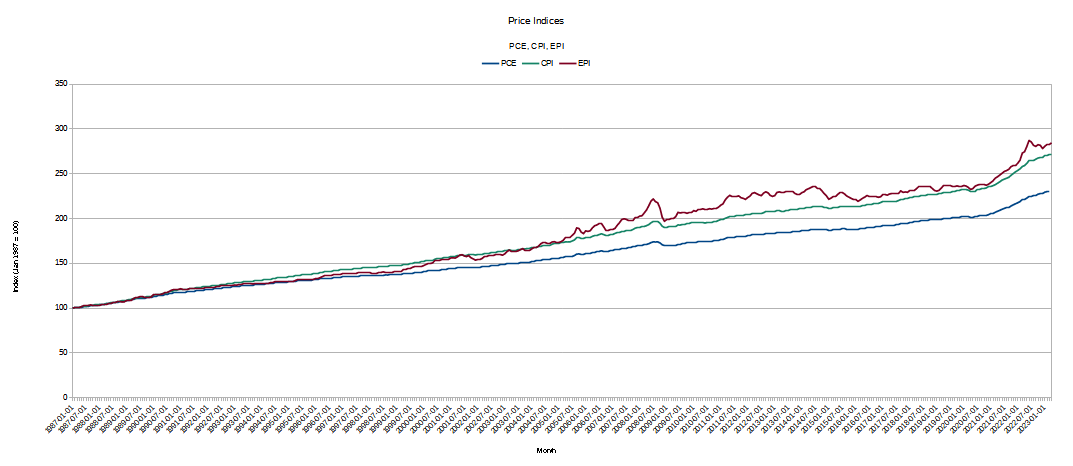
While that rate of increase may have slackened a bit in 2023, it is still above the recent historical norm. Virtually every metric we have for consumer price inflation establishes this—even the publicly available inflation charts from John Williams’ ShadowStats agree with this, and only dispute the magnitude of the increase.


This is the essential point Allan Sloan completely overlooked. This is the crux of the matter the “expert” nonpareil completely missed.
Whether inflation is today 5.5%, 4.9%, or 3.4% is not important. What is important is that inflation has shifted higher, and forced consumers to alter their buying patterns. Inflation is changing—and, in the end, reducing—our consumption patterns.
When we see the evidences around us of a “retail recession”, we are witnessing the damage inflation does to an economy, no matter what the magnitude of that inflation is.

As a result of this forced shift in buying patterns, Walmart has been shifting its attention to grocery items and away from general merchandise.
With consumers shifting more dollars to food, Walmart Chief Financial Officer John Rainey noted that its general merchandise inventory growth rate is down more than 15 percentage points from Q1. General merchandise’s contribution to Q2 sales mix was down 350 basis points.
Target has been making similar moves, leading to declines in sales margins, as grocery items are typically lower-margin items than general merchandise categories.
Both Walmart and Target are grappling with slower and smaller unit sales of merchandise.
Hopeful signs aside, the wider retail market still appears to be struggling on the whole. According to a Cowen analysis, retail foot traffic was up sequentially in the second and third weeks of August but growth remains below 2019 levels by double digits.
In a separate note, Cowen analysts said that unit sales in retail “remain weak,” with “real sales” down from last year in sporting goods, department stores, and clothing and accessories. For most of the retailers Cowen covers, the sales to inventory spread has turned negative this year, with trends worsening in Q2 for those that have reported so far.
This is the reality of consumer price inflation: consumers are paying more but buying less.
Simply making up a new inflation number that seems “less scary” does nothing to change the reason inflation is scary: inflation always means we pay more but buy less. The higher the rate of inflation, the more we pay and the less we buy.
In every inflation scenario this is the order of things.
Even the “expert” nonpareil should be able to grasp that. So why didn’t he?