

Economy at a Crossroads: Boom or Bust Ahead?
We’re Not in a ‘Golden Age.’ We’re in a Fog

If we were so naive as to take corporate media at face value, we would conclude that yesterday’s Consumer Price Index Summary showed inflation surging ahead.
Pro tip: don’t be naive, and don’t take corporate media at face value.
To be sure, headline inflation did rise year on year 0.2pp—a large gain for a single month.
The Consumer Price Index for All Urban Consumers (CPI-U) increased 0.4 percent on a seasonally adjusted basis in August, after rising 0.2 percent in July, the U.S. Bureau of Labor Statistics reported today. Over the last 12 months, the all items index increased 2.9 percent before seasonal adjustment.
However, does a hotter than expected headline inflation print mean prices are heating up across the board? Going by the lede paragraph from CNBC, yes.
Prices consumers pay for a variety of goods and services moved higher than expected in August while jobless claims accelerated, providing challenging economic signals for the Federal Reserve before its meeting next week.
Yet the CPI data is more than a single number, and when we peel back the layers of the data onion the narrative quickly becomes blurred and uneven.
Compounding the confusion is the contrarian signal from the Producer Price Index, which actually printed deflation year on year for August.
Is inflation surging? For August, the answer is “Yes”, “No”, and “Maybe, maybe not.”
Such answers tell us that the economy is at a crossroads, with either boom or bust waiting for us.
Such answers also tell us that we’re not in an economic “Golden Age,” but an economic fog, and no one really knows what is on the road ahead of us.
Contents
Headline Inflation Up A Lot, “Core” Inflation Not So Much
The first thing we can see when we look at the CPI data—particularly the headline inflation print vs “core” inflation—is that the headline numbers surged while the “core” numbers were considerably less enthusiastic.
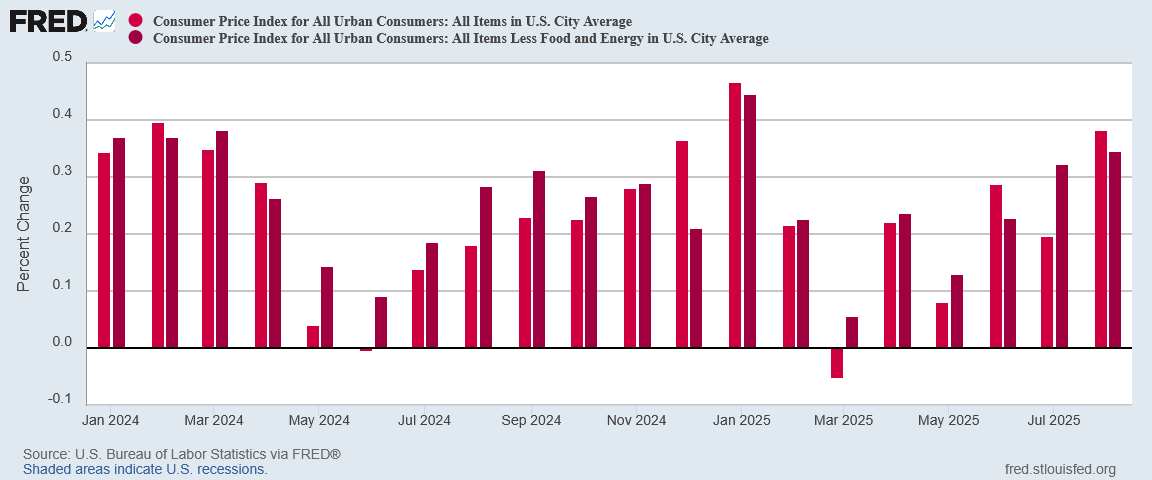
Month on month, headline inflation rose nearly 0.03pp. “Core” inflation rose only 0.02pp. Straight away we can see that inflation was uneven across the board, and that “core” consumer prices were considerably cooler than the headline sectors of food and energy.
Even year on year, we can see that headline inflation ran a lot hotter than “core” inflation.
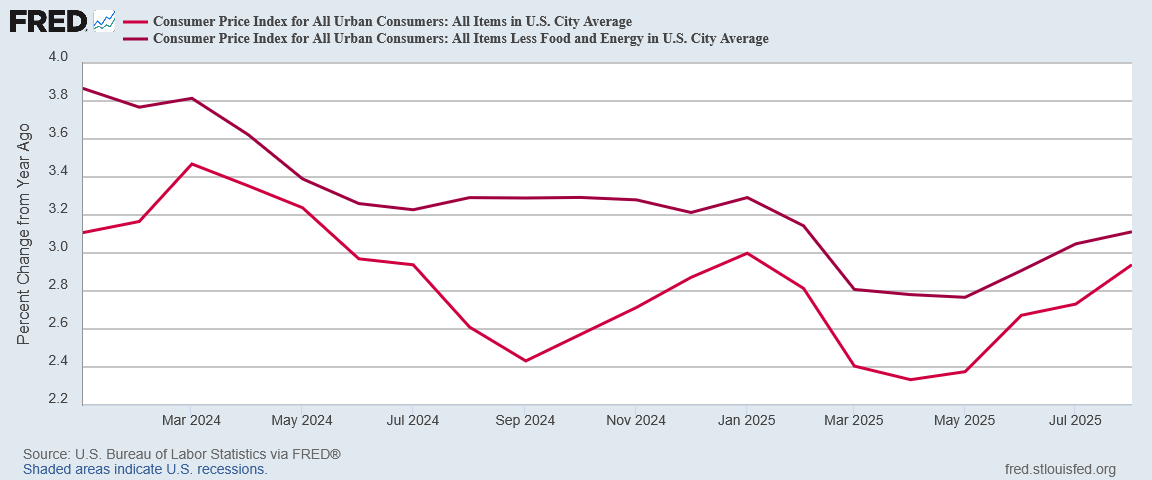
Inflation is rising—just not rising everywhere.
What inflation did do is catch Wall Street somewhat off guard.
Trading Economics’ forecast only a rise to 2.8% year on year.
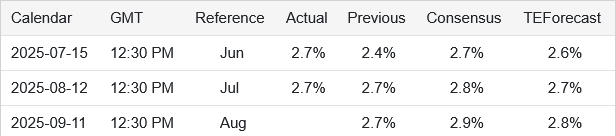
The consensus on Wall Street nailed the prediction this time around, expecting 2.9% year on year.
Notably, the Cleveland Fed’s inflation nowcast came in nearly 0.1pp too low for the year on year projections.
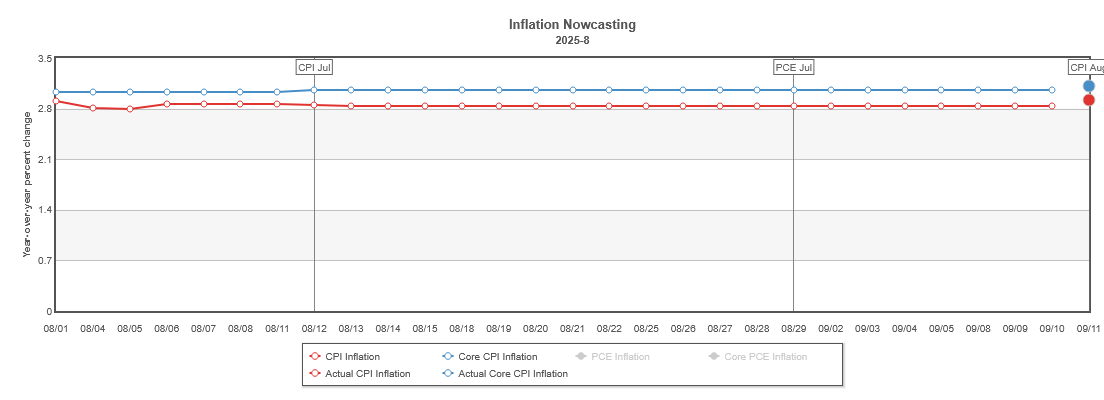
Hotter inflation was anticipated, although not quite as hot as what the BLS has actually reported.
Inflation Mostly Food
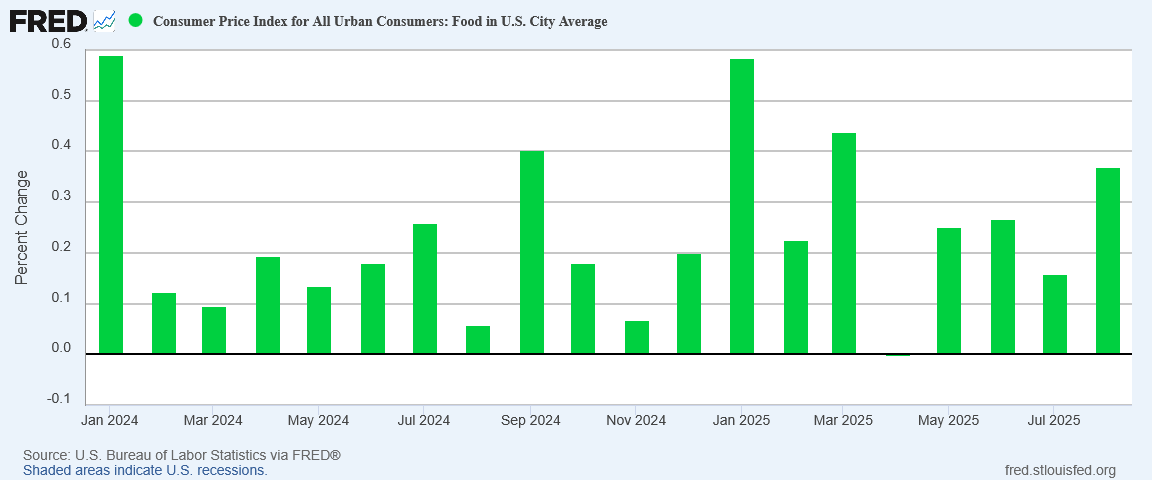
Breaking the headline inflation number down, we see that the big headline inflation gain came in food prices, which rose 0.2pp month on month, doubling the July print.
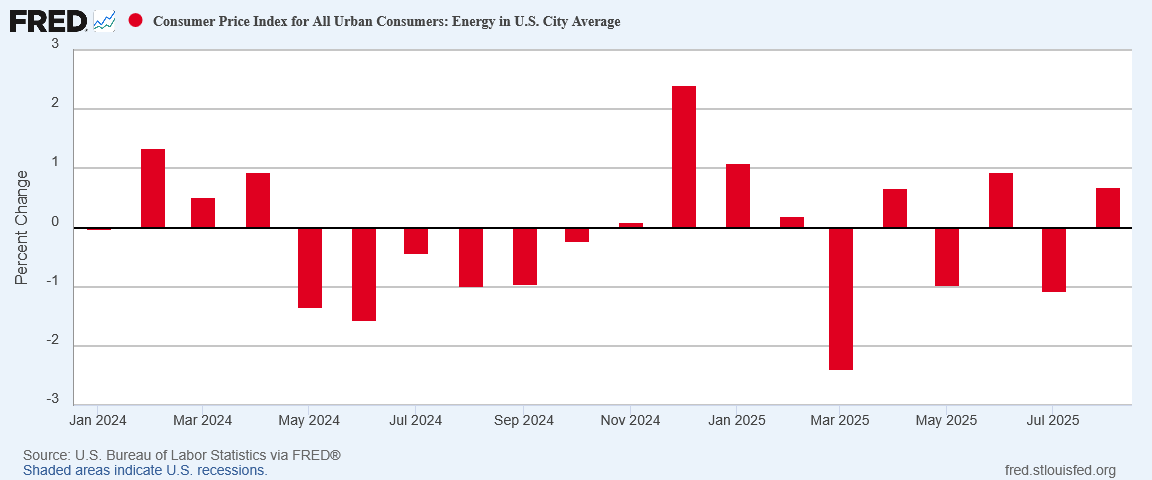
While the more volatile energy prices did return to inflation after dropping in July, at 0.69% month on month, its gain was proportionally more muted.
Rising food prices is definitely not good news for President Trump, as they are naturally one of the more politically significant inflation pain points.
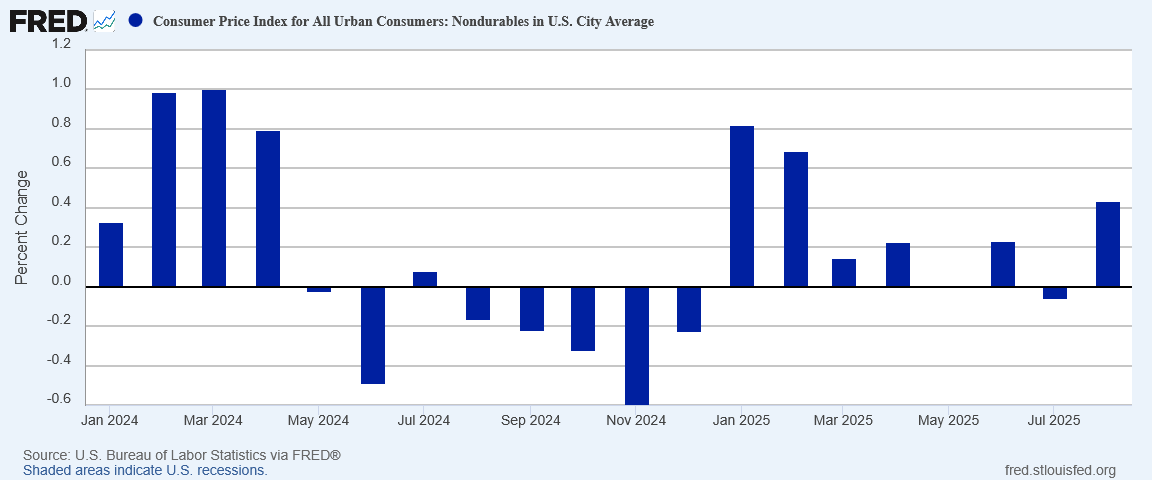
Still, we should also notice that rising food and energy prices can easily obscure the fact that inflation rates for durable goods actually cooled in August.
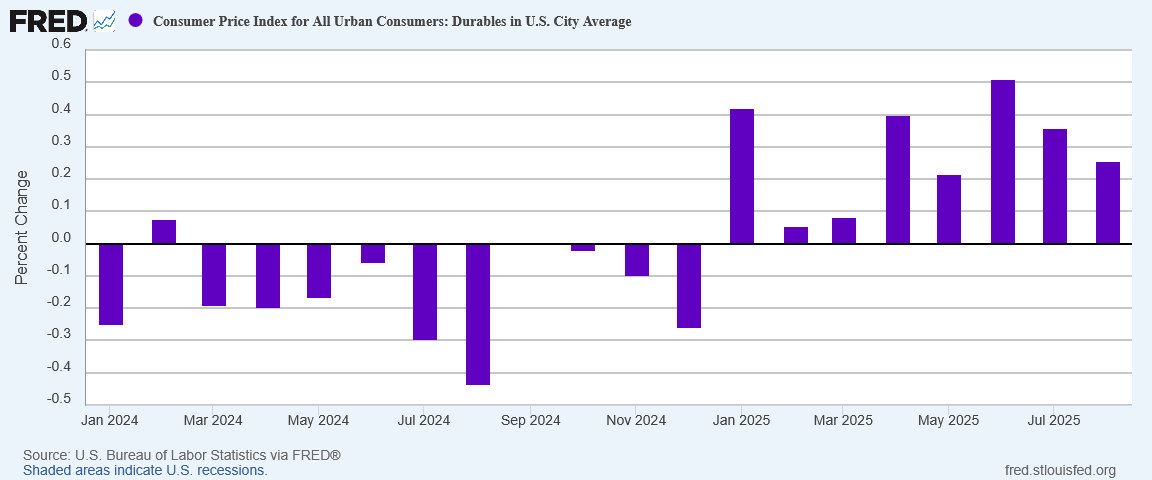
Inflation for durable goods has actually been cooling since June—yet another reminder that President Trump’s tariffs are not wrecking either consumer prices or the economy as a whole. I know you’re as shocked as I am to learn that corporate media is still beating this long disproven dead horse.
The broad increase in inflation partly reflected businesses passing on higher costs from President Donald Trump's sweeping tariffs to consumers and a rebound in demand for travel. Tourist traffic to the U.S. tanked during the spring and early summer amid boycotts and the White House's immigration crackdown.
After all, if it’s bad, it must be because Trump. What other reason could there be?
To underscore just how wide of the mark corporate media is painting the inflation picture with a broad brush, inflation among nondurable goods did surge a fair bit, rising more than 0.4pp month on month.
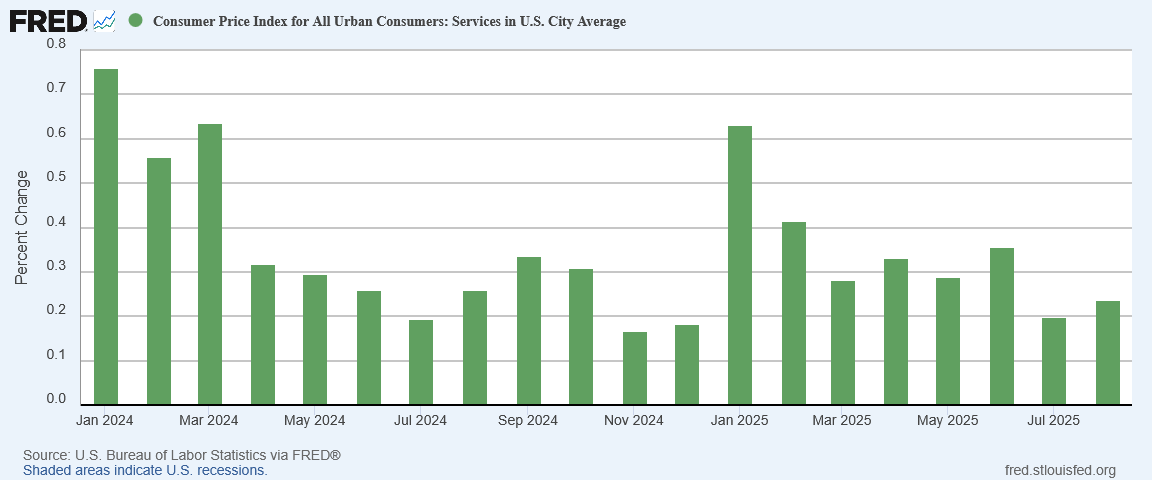
Service price inflation also rose modestly in August.
However, in the ultimate rejection of the “blame Trump and his tariffs” narrative, the other major contributor to the overall inflation uptick was inflation for rent and housing.
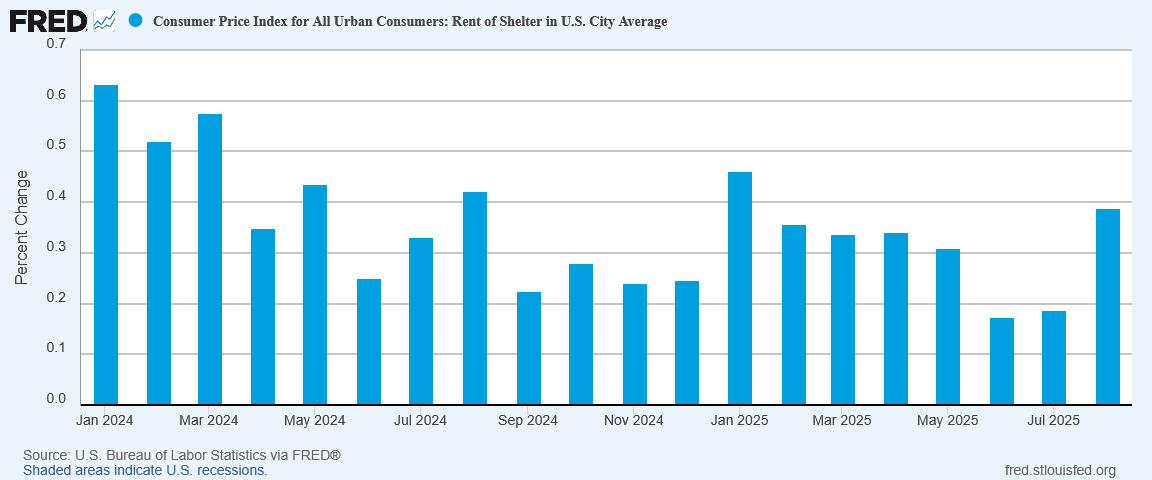
Monthly housing inflation rates more than doubled in August, rising to 0.38%.
Given that housing is not itself subject to tariffs, and given that housing tends to be a trailing inflation indicator, showing the impact of pricing pressures after they have passed, the one certainty we have about the uptick for inflation rates in housing prices is that it has nothing at all to do with tariffs or trade wars.
Food, shelter, and services are the primary drivers of August’s hotter than expected inflation print.
Producer Prices Printed Deflation For August
In order to make sure the inflation outlook for the fall is thoroughly muddled, Producer Prices—which for a change came out a day before the Consumer Price Index rather than a day after—printed outright deflation at both the headline and core levels.
The Producer Price Index for final demand edged down 0.1 percent in August, seasonally adjusted, the U.S. Bureau of Labor Statistics reported today. Final demand prices advanced 0.7 percent in July and 0.1 percent in June.
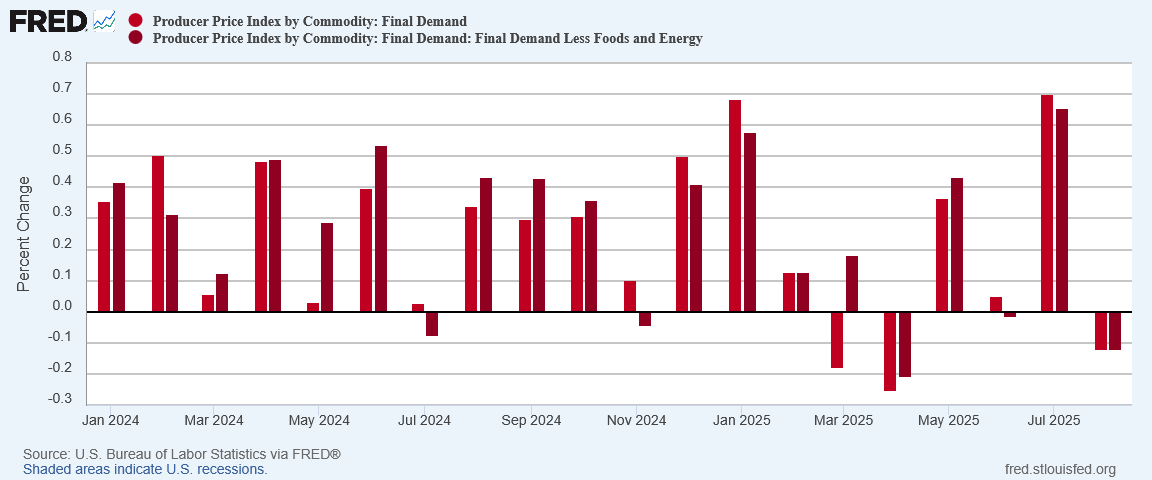
While consumer prices rose more than expected, producer prices actually fell by 0.1% for both the headline and core levels.
Year on year, the Producer Price Index erased most of July’s increase.
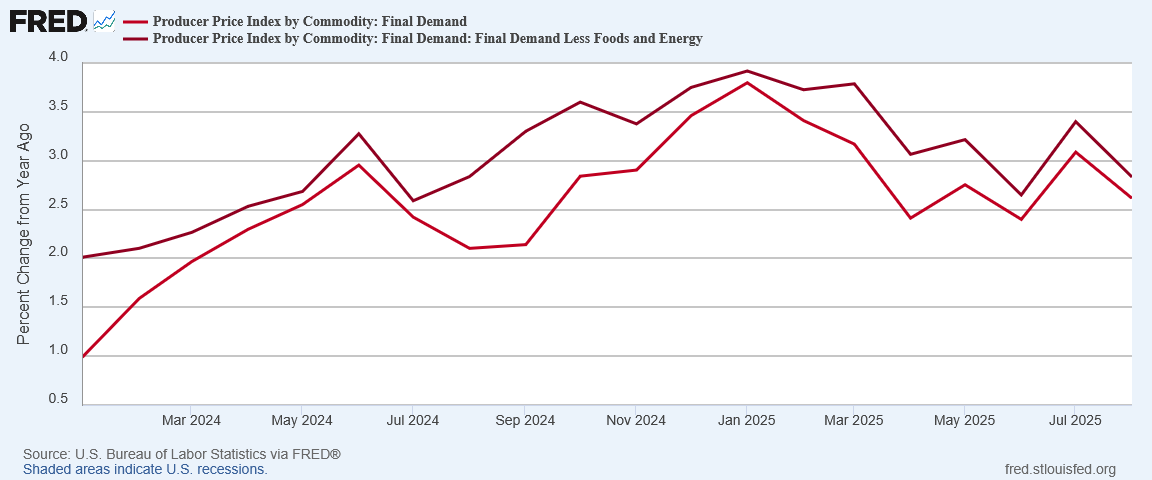
In most respects, the drop in producer prices mirrored the rise in consumer prices.
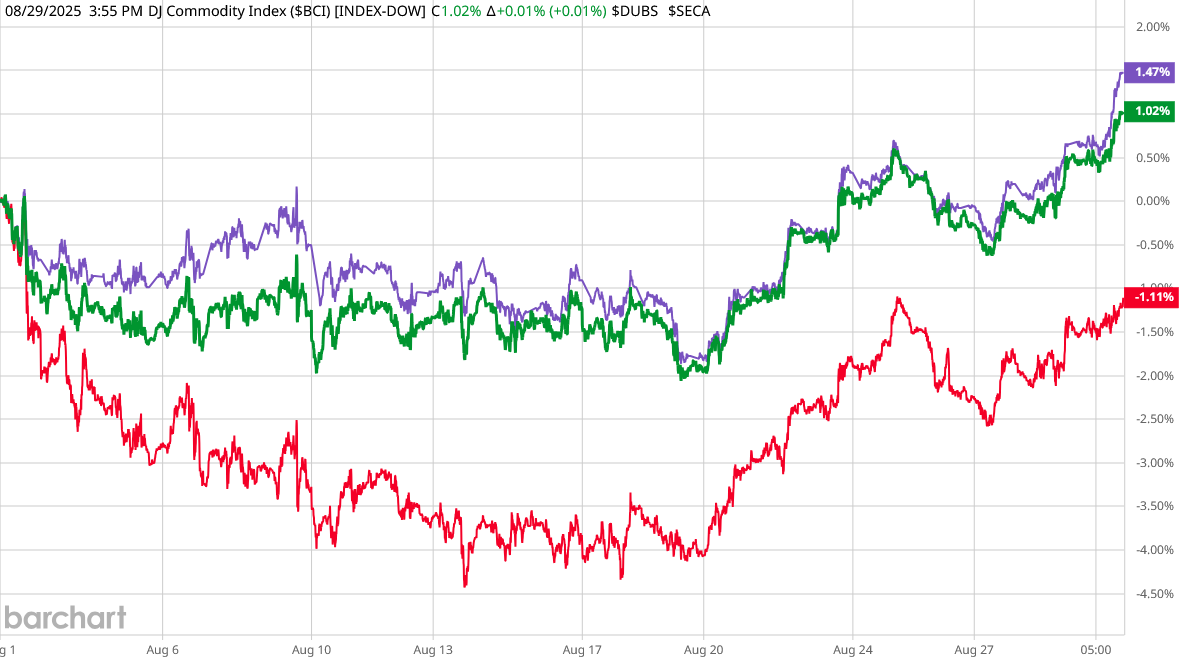
Producer price inflation for energy returned to deflation in August.
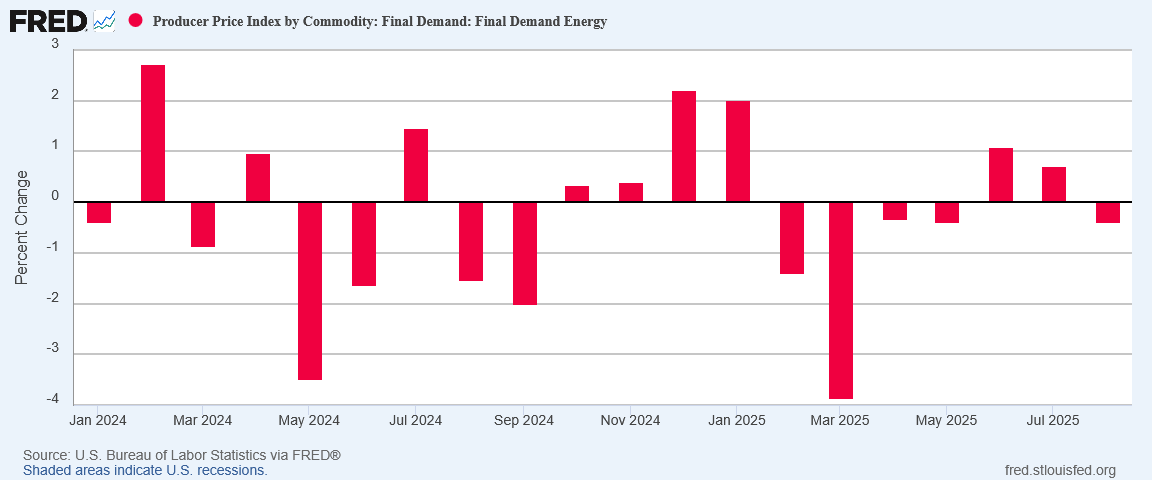
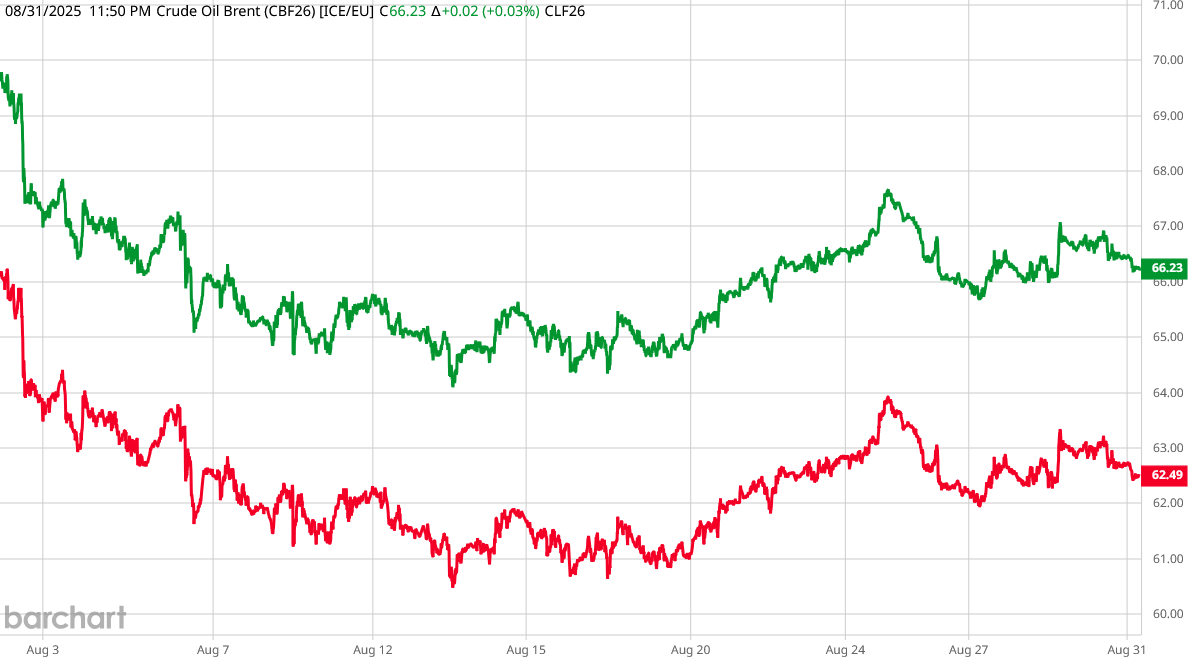
This is unsurprising, given the drop in oil prices throughout the month.
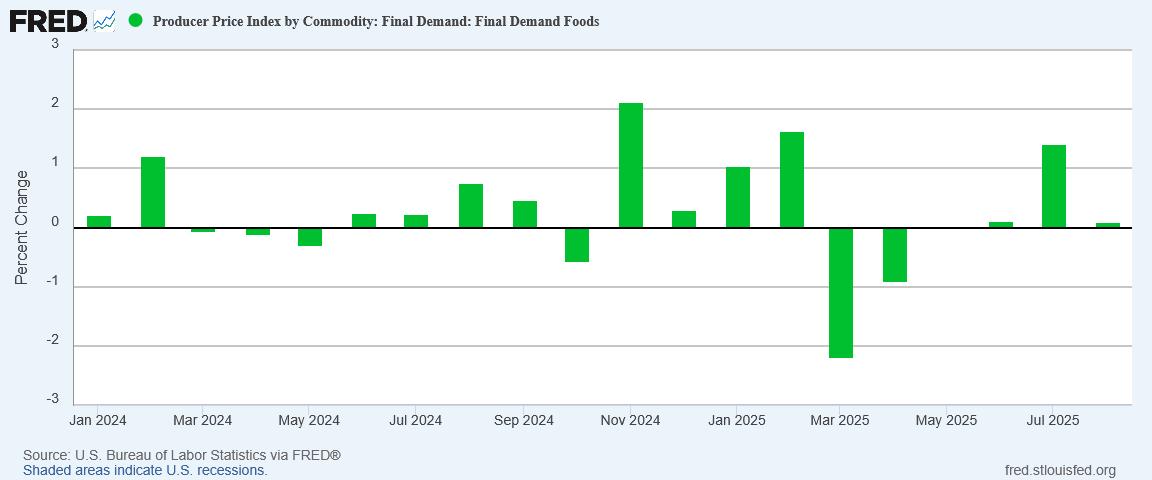
For food, producer prices barely stayed on the inflation side.
As was true for durable goods within the CPI, producer price inflation for final demand goods cooled in August.
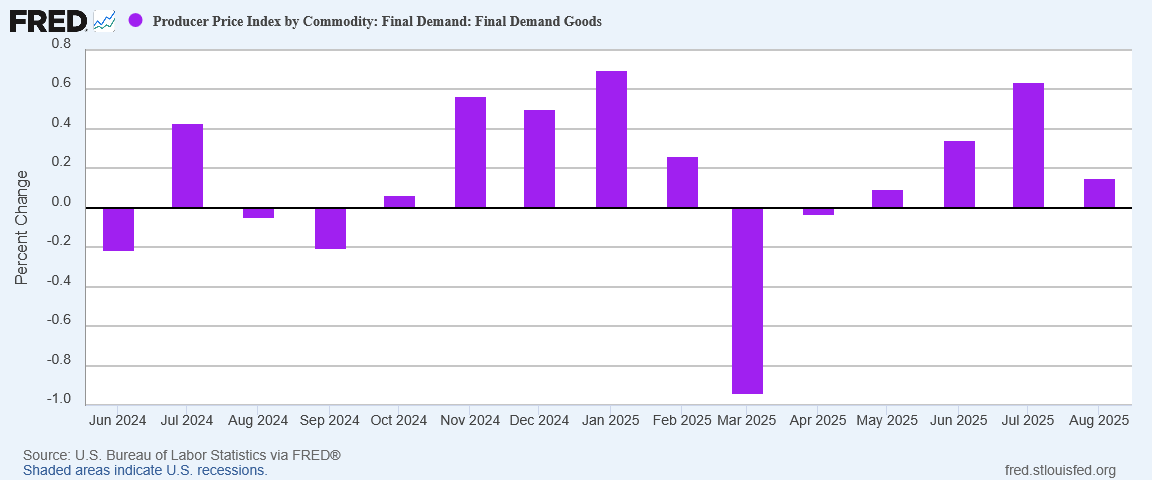
As with energy producer price inflation and oil, producer price inflation for final demand goods largely tracks with how commodities prices behaved in August.
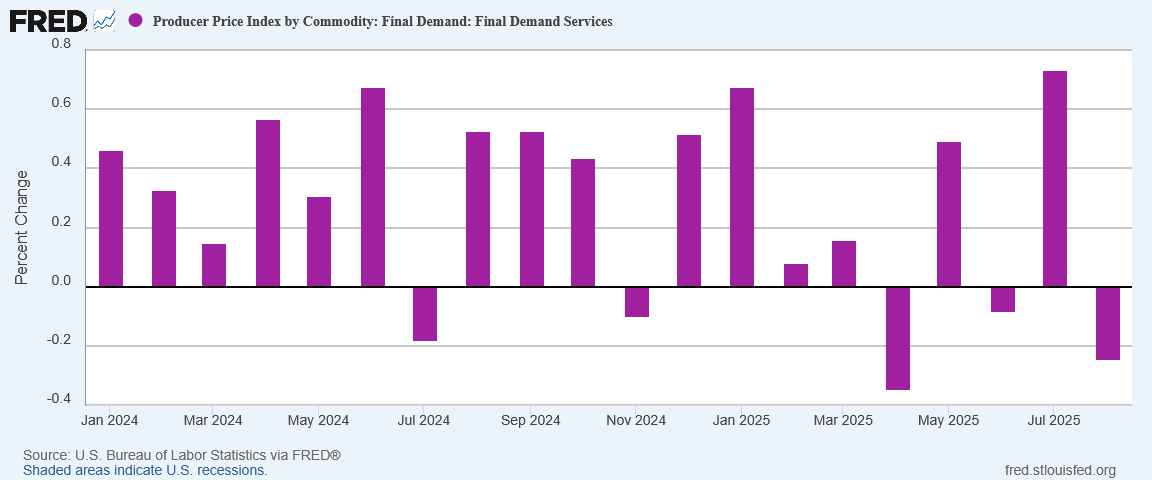
Meanwhile, among services, producer prices reversed from July’s surge to outright deflation in August.
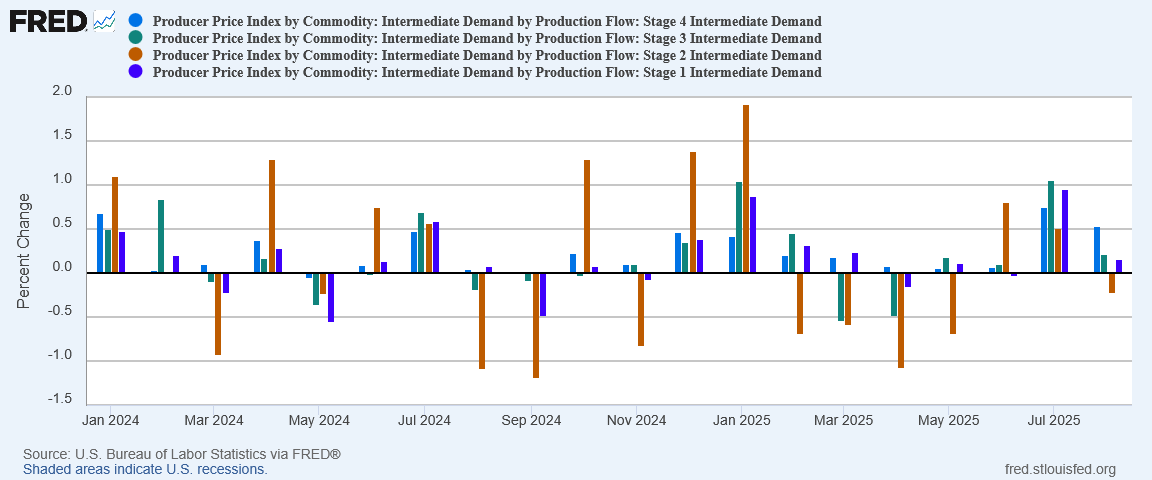
Even for intermediate demand, only Stage 4 intermediate demand notched any significant price increase, and even that Stage 4 was cooler in August than it had been in July.
Within producer prices, there is no sign of any inflationary pressure from tariffs because there is no inflationary pressure at all.
As the PPI is largely a precursor and predictor of the CPI, the drop in producer prices is a strong signal that consumer price inflation is not likely to continue to heat up during the fall months. That’s an awkward reality for the Federal Reserve, as the deflationary PPI negates any argument from the hot CPI print for holding the federal funds rate at its abnormally high level.
Coupled with last Friday’s weak jobs numbers, even though hotter than anticipated the Consumer Price Index along with the Producer Price Index are not showing the sort of major price increase that would warrant holding off yet again on trimming the federal funds rate.
Inflation, Deflation, Or Stagflation?
What are we supposed to make of producer prices and consumer prices diverging this way? How should we apprehend the highly variable rates of inflation among consumer prices?
Are prices set to rise in the autumn months or are they set to fall?
Rising prices across the board would be a sign of runaway inflation, which could become hyperinflation. Whatever signals are in the Consumer Price Index, a hyperinflation signal is not among them.
Falling producer prices across the board would be a sign of deflation setting into the economy. However, as producer prices are not falling across the board, we are not seeing a clear deflation signal either.
That leaves the third—and perhaps most ominous—choice: stagflation.
The typical stagflation scenario is when an economy experiences rising unemployment and rising inflation at the same time. As a general rule, employment tends to act as an inflationary pressure, pushing prices up, and so when employment falls at the same time inflation is rising, that signal that the economy is stagnating. “Stagnation” plus “inflation” gets us “stagflation.”
Inflation’s rise in recent months at the same time we are seeing weak job growth and rising joblessness is a warning sign the US economy is at risk of entering a stagflationary cycle.
However, if we expand our horizon just a bit, we can see that stagflation can occur whenever inflationary and deflationary forces collide in an economy. The collision of inflationary forces via the CPI and deflationary forces via the PPI may very well be a stagflationary signal as a result.
Similarly, inflation in services and deflation in goods may also be a stagflationary signal.
If we are seeing stagflationary signals emerging in the US economy, then things are not going at all well, and the US economy is far from being in a “golden age,” despite President Trump’s best efforts to push that narrative.
Does this mean that Donald Trump’s policies, his tariffs and trade wars, have failed miserably? Ultimately, it is too soon to tell. This was a point I made in response to a question asked on my last article about the weak BLS jobs print last week:

It took Ronald Reagan two years to get to an economy that was growing and putting people to work after the stagflation of the 1970s. Trump’s first grade on the economy is not going to come until right before the mid-terms next year.
Now is not the time to say whether Donald Trump’s policies are a success or a failure. At present we do not know that and cannot know that.
What we do know—what the CPI and PPI metrics reaffirm after last Friday’s weak jobs numbers—is that the US economy is currently in a parlous state, and is very likely at a crucial juncture. What takes place over the next few months both in terms of Trump’s economic policies and the geopolitical ramifications of world events, are likely to have an outsized influence on whether the US economy rebounds into prosperity or not.
We should not discount the possibility that Donald Trump, by the mid-terms next year, will be in a position much like Reagan in 1984, able to campaign for Congressional allies with a “Morning in America” theme. We also should not assume that outcome is a guaranteed, foregone conclusion.
Right now, today, the United States is not in a “golden age”. Donald Trump’s narrative is wrong about that. Right now, today, the US economy is flirting with stagflation and the prospect of another “lost decade” akin to the Obama years. The data makes that abundantly clear.
Tomorrow we will either enter that “lost decade” or we will see “Morning in America.” The data does not tell us which outcome is more likely. It certainly does not tell us which outcome we will get.
What the data tells is that we are not at the end of Trump’s efforts to implement Agenda 47. What the data tells us is that we are not even at the beginning of the end.
What the data tells us is that we quite possibly are at the end of the beginning. There is much more yet to be done before we declare either victory or defeat.
Thanx Pete
Grace and peace to you Amigo
Semper Fortis!
“Now is not the time to say whether Donald Trump’s policies are a success or a failure. At present we do not know that and cannot know that.”
So I realize this is an unfair question to ask and expect you to answer in a few sentences, Peter, but what is your sense of how Trump should respond to this data? Should he stay the course (for now), make a drastic change, or tweak a few policies? You’re the only man I know who is smart enough to answer, Magnificent Man.