


After January’s fairly upbeat Job Openings and Labor Turnover Summary report, the lingering question was whether it would last.
The JOLTS data also suggests that, contrary to what the ADP report showed for January, the jobs recession may be about to end, although any extrapolation along those lines must wait until we have the February data to compare to the February Employment Situation Summary especially. If the February JOLTS report mirrors that jobs data, then the jobs recession is in fact getting even worse.
Now the February report is out, and we have our answer. February’s JOLTS report shows the job recession getting worse, although the Bureau of Labor Statistics does its usual job of obfuscating that reality.
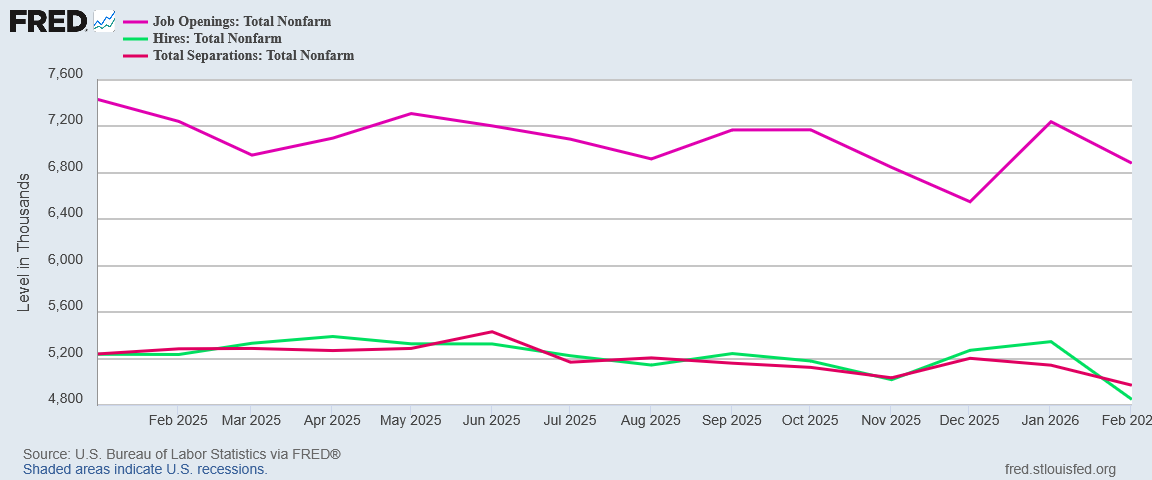
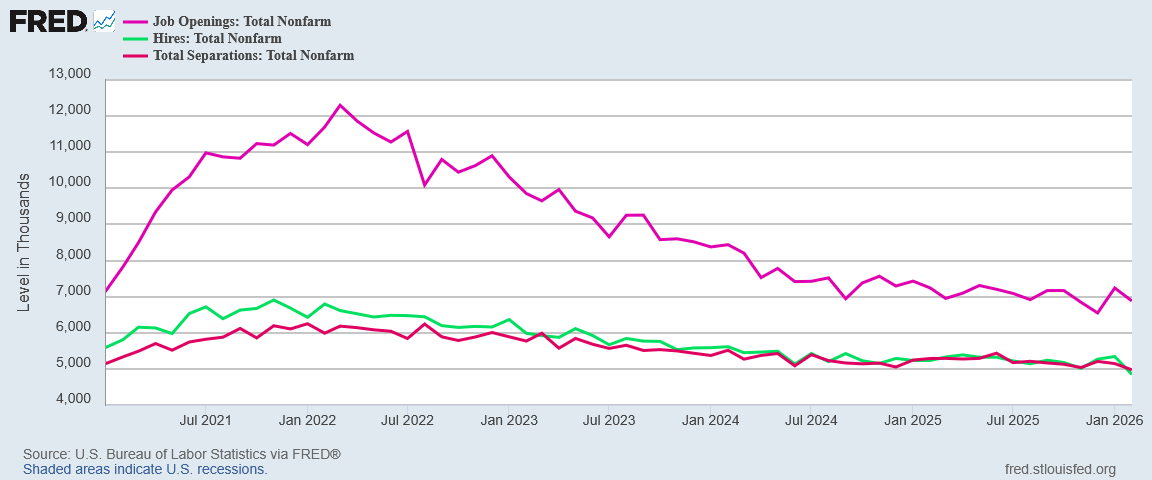
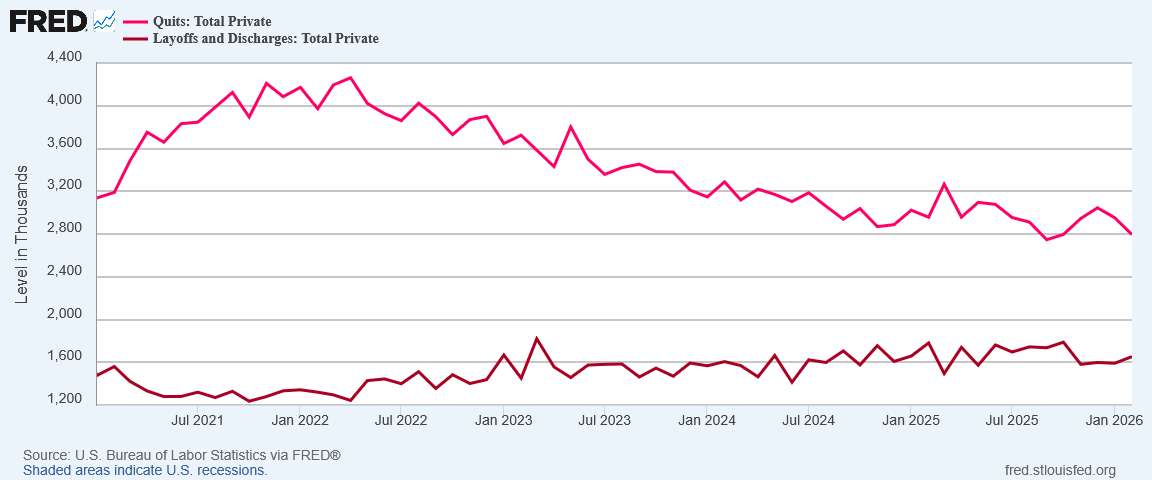
The number of job openings was little changed at 6.9 million in February, the U.S. Bureau of Labor Statistics reported today. Over the month, hires decreased to 4.8 million, and total separations changed little at 5.0 million. Within separations, quits (3.0 million) were little changed while layoffs and discharges (1.7 million) were unchanged.
What the report glosses over: job openings fell, and separations fell by less than hires.
February’s JOLTS data does an excellent job of confirming that February’s Employment Situation Summary was every bit as “fugly” as it appeared.
The jobs recession is in fact getting even worse.
Everything Down
The JOLTS report is, unlike many of the BLS data sets, is a marvel of simplicity. It revolves around the reported numbers of job openings, hires, and separations each month.
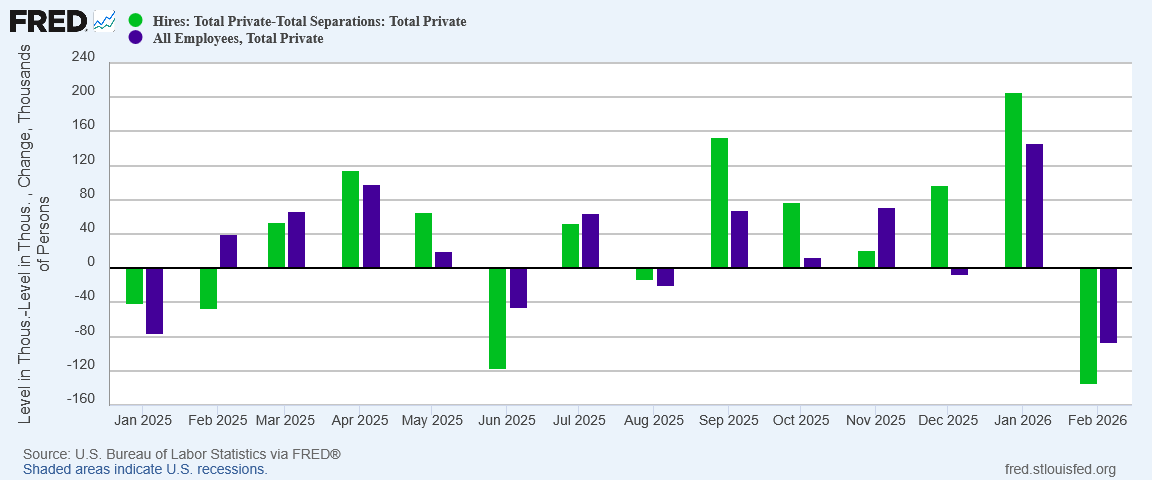
In February, all three base metrics dropped.
The drop in hiring was particularly dramatic, outpacing separations significantly.
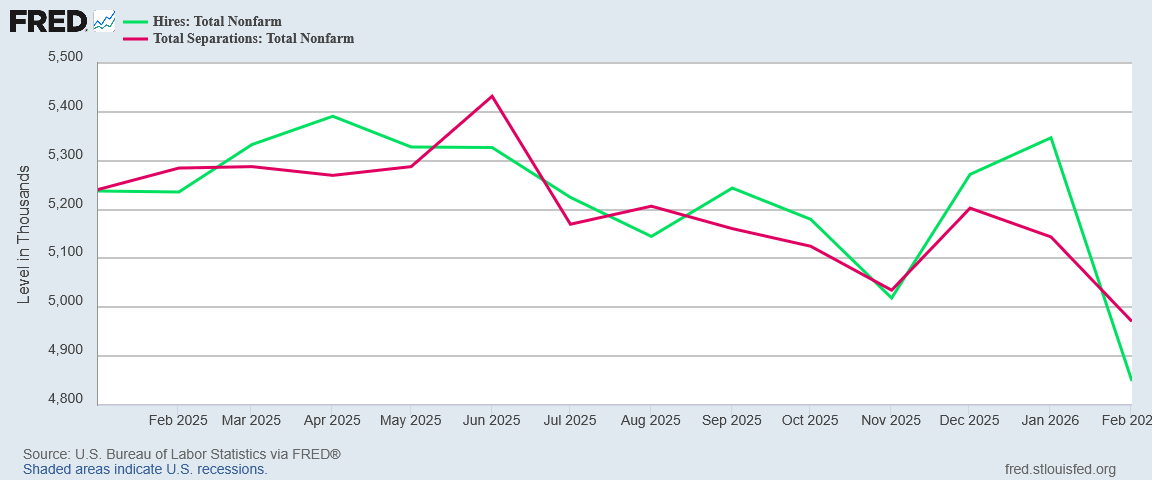
With hiring dipping below the level of separations, net hiring went negative (again).
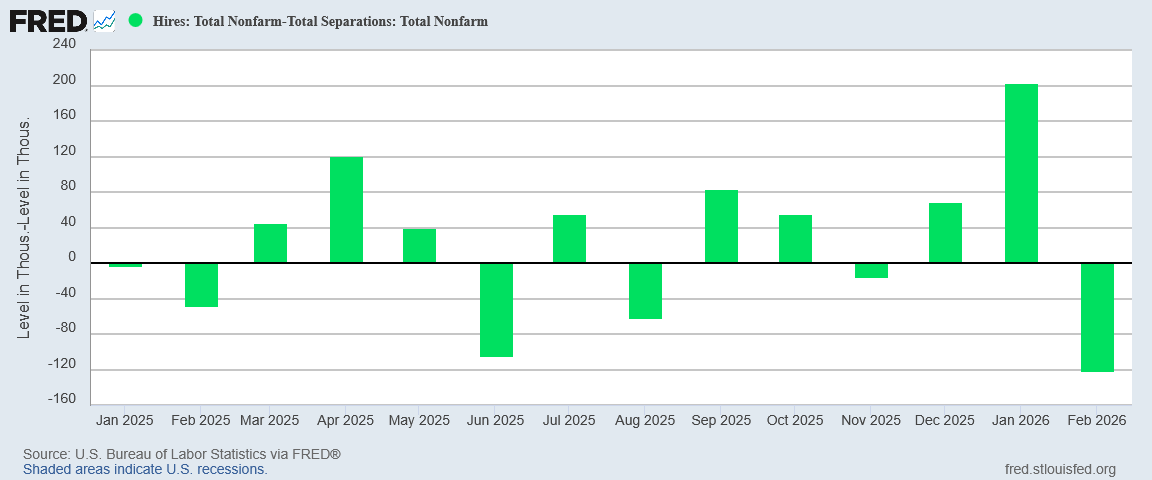
Even when we focus on the private sector, net hiring was still negative for the month.
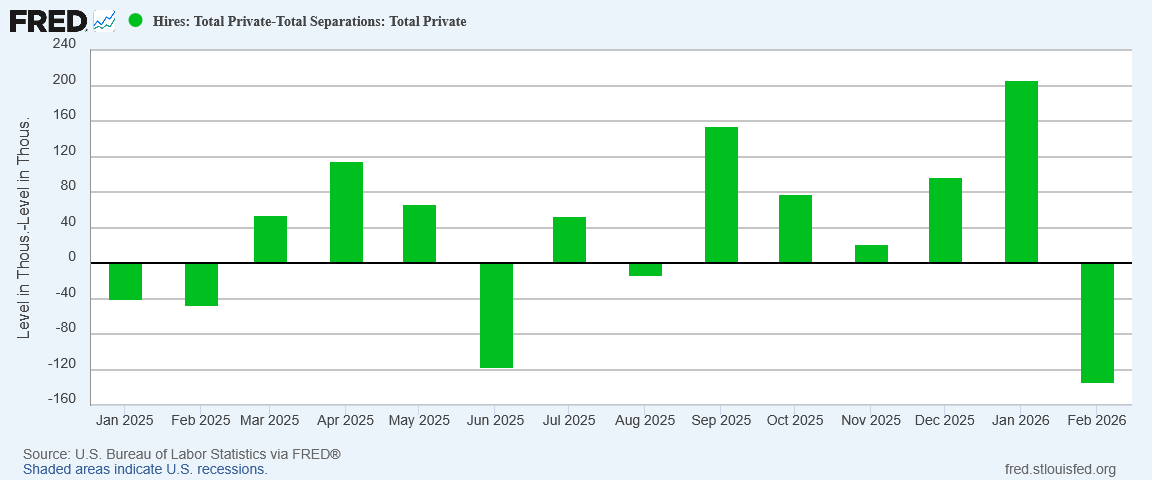
The decline was merely the latest downward shift in a trend of shrinking net hiring the dates back to 2021.
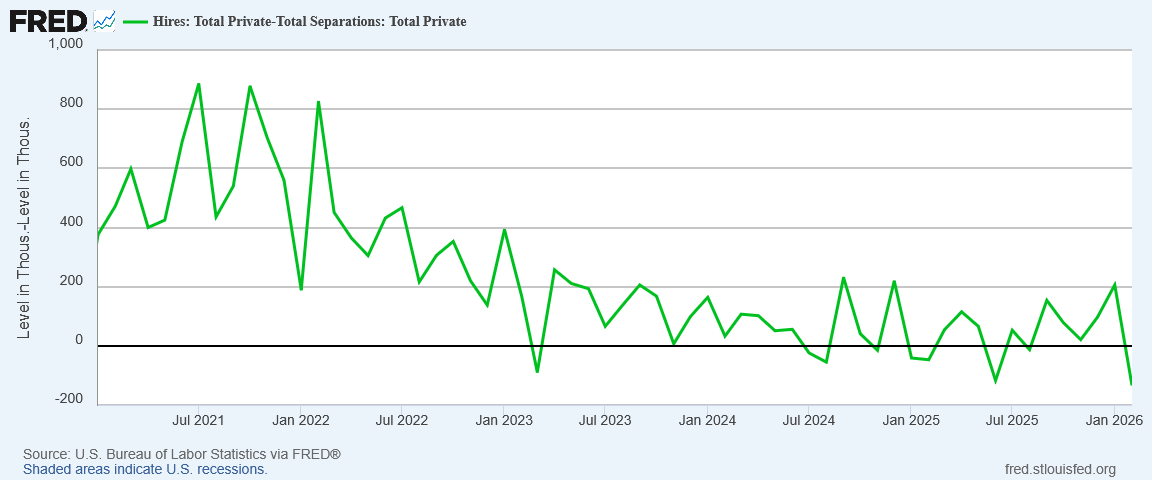
The United States has been hiring fewer and fewer people each month—which means creating fewer and fewer actual jobs—since before the 2022 hyperinflation cycle.
The net hiring data alone reduces recent corporate media claims about labor market “stability” to utter absurdity. Even corporate media outlets appeared to realize this, jettisoning the “stability” narrative from last week’s unemployment claims data for freshly minted concerns about the lack of labor market “churn”.
Listless hiring and labor hoarding mean the all-important “churn” needed for a healthy labor market and healthy economy has ground to a near-halt.
However, that labor market “churn” was decreasing has been self evident in the JOLTS data since 2021.
The steady decline in “quits”—voluntary separations—relative to layoffs and terminations has been another indication that labor markets were getting progressively softer, less healthy, and more toxic.
Media propaganda aside, Wall Street has known this, but still was caught off guard with the actual job openings figure coming in well below the Wall Street consensus forecast.
Simply put, February was a month where nearly everything was down on the JOLTS.
No Relief In Any Sector
Nor were there any bright spots to be found in the sector level data.
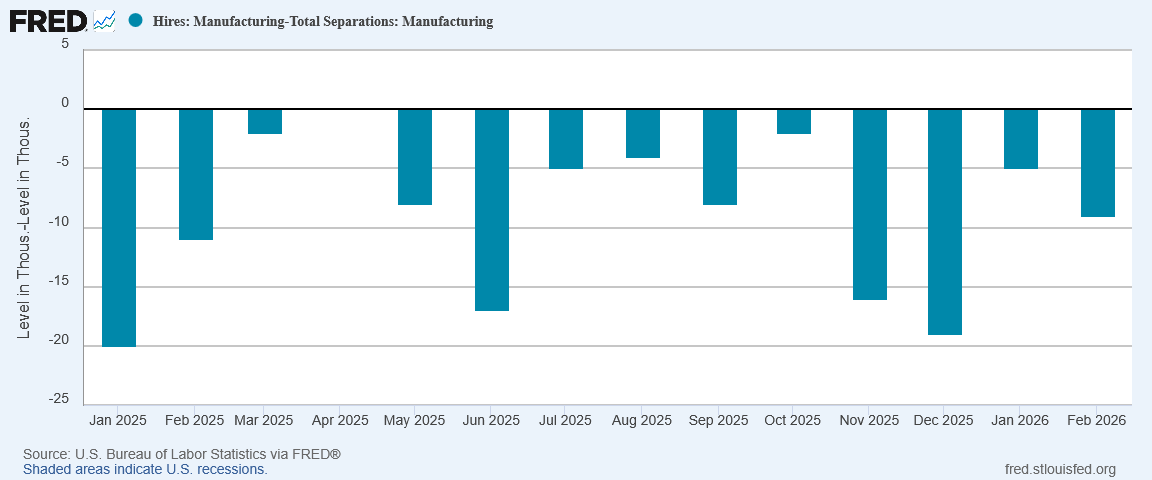
Manufacturing continued hemorrhaging jobs.
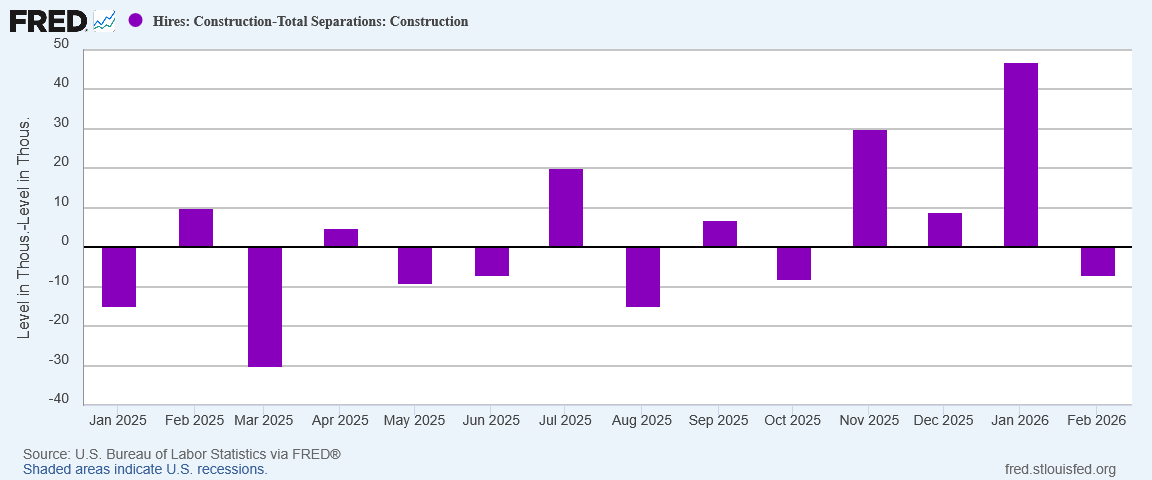
Construction, which had shown some hiring strength in recent months, reversed into job loss.
Among service positions, Trade, Transportation and Utilities led the downturn, with Professional and Business Services as well as Leisure and Hospitality also reversing into declines.


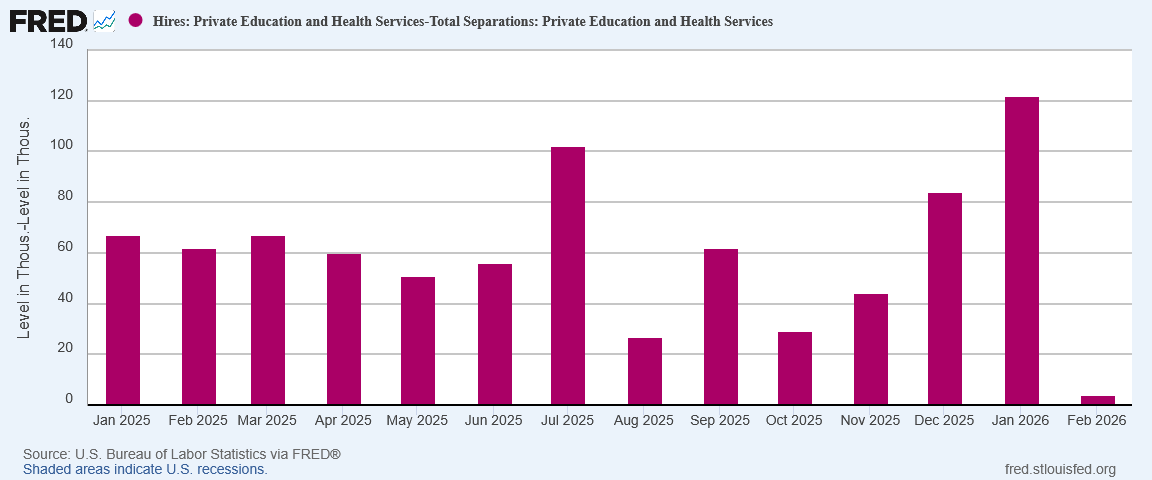
Even normally strong Healthcare abruptly weakened in February, barely showing any job growth at all.
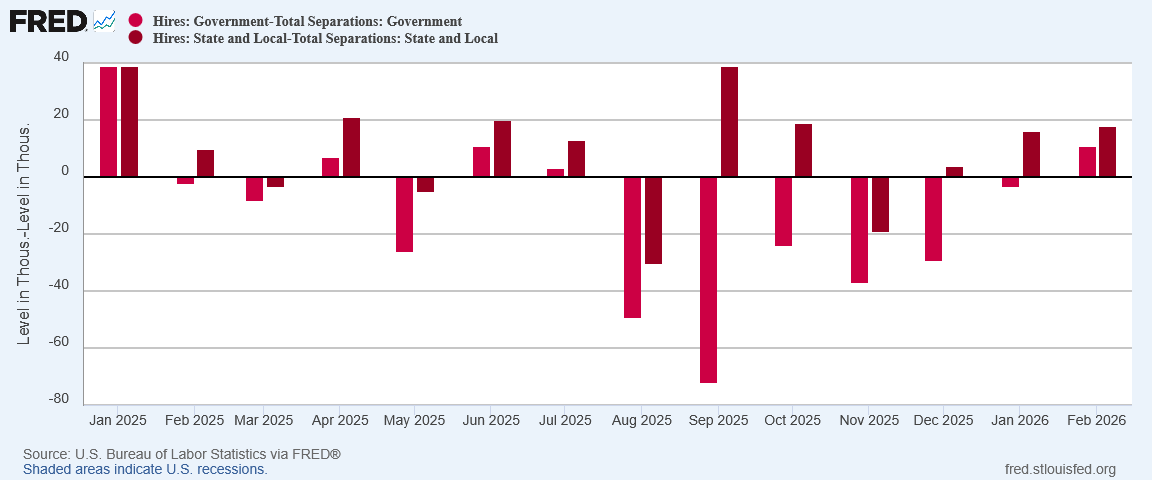
The one sector where employment grew significantly is the one sector many wish would never show any job growth: Government.
February was a month when we got none of the job growth we wanted and only some of the job growth we didn’t want. That is not a good outcome for any jobs report.
Confirms February Employment Situation Summary
Last month, I pointed out the February JOLTS report would present in one of two ways: the JOLTS data could track the ADP report, or it could track the BLS jobs report. For February, it again largely tracked the BLS jobs report.
While the JOLTS report tends moderate some of the volatility within the jobs data, the shifts up and down broadly align with the Employment Situation Summary.
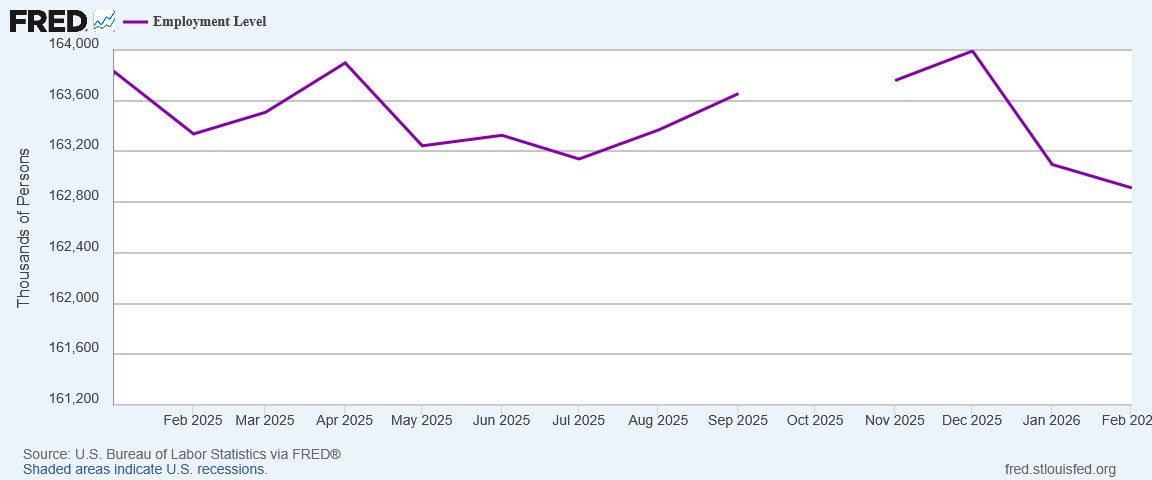
To a degree, we should expect this: both surveys are measurements of what should be the same underlying data—i.e, employees. Still, confirmation of the Employment Situation Summary data is not at all comforting, given the decline in overall employment that report has printed since the start of 2025.
As if to add insult to injury, corporate media also took pains to point out that the hiring rate on the February JOLTS was the worst since the COVID Pandemic Panic—and of course it was all President Trump’s fault (even though most of the decline from peak hiring in 2022 happened under Joe Biden).
Economist Heather Long of the Navy Federal Credit Union, came close to using the term I have been using for over a year—“jobs recession”—describing the lack of job creation as a “hiring recession.”
“This is a hiring recession,” Long wrote in a social media post. “And Americans are feeling it. There were notable hiring pullbacks in February in hospitality and construction. Bottom line: The job market was already frozen before the war in Iran began. It’s worrying that a ‘no hire, no fire’ situation could turn into a ‘no hire, start to fire’ job market quickly if there isn’t a resolution soon.”
The term “jobs recession” has gained some traction among the presumed “experts”, as Moody’s Chief Economist Mark Zandi embraced the term last December. Whether labeled “jobs recession” or “hiring recession”, even the mainstream economists who have ignored the softening jobs data for the past few years are coming around to the reality that data is describing toxic and increasingly dysfunctional jobs markets increasingly vulnerable to employment shocks and dislocations.
Without hiring to compensate, if there is any uptick in layoffs and terminations, the impact on labor markets will be extremely negative. The labor market “churn” corporate media correctly laments is missing provides a valuable buffer which mitigates much of the impact of any increases in forced labor separations.
In every aspect, the February JOLTS data confirmed the worst parts of the February BLS jobs report. The JOLTS data confirmed what many people already know just from their own experiences: job markets in the United States are high on suckage and low on actual jobs.
Prelude To Stagflation?
One thesis for which I get some pushback is my estimation of the potential for a stagflationary episode in the US economy.

I am convinced there is a significant stagflation risk that is becoming more pronounced with major global events such as the war with Iran producing major economic dislocations worldwide. However, with “official” unemployment still fairly low, there is a tendency among mainstream “experts” and those who blindly accept their pronouncements to simply follow Fed Chair Jay Powell’s lead and ignore those stagflation risks for the US. Official employment is low, inflation is as of last month still low (that is about to change), so why worry?
That perspective presumes that unemployment is really as low as the “official” metric claims. As I have argued many times, the real unemployment rate is likely quite a bit higher, which we can see even if we add back just those not in the labor force but who want a job now.
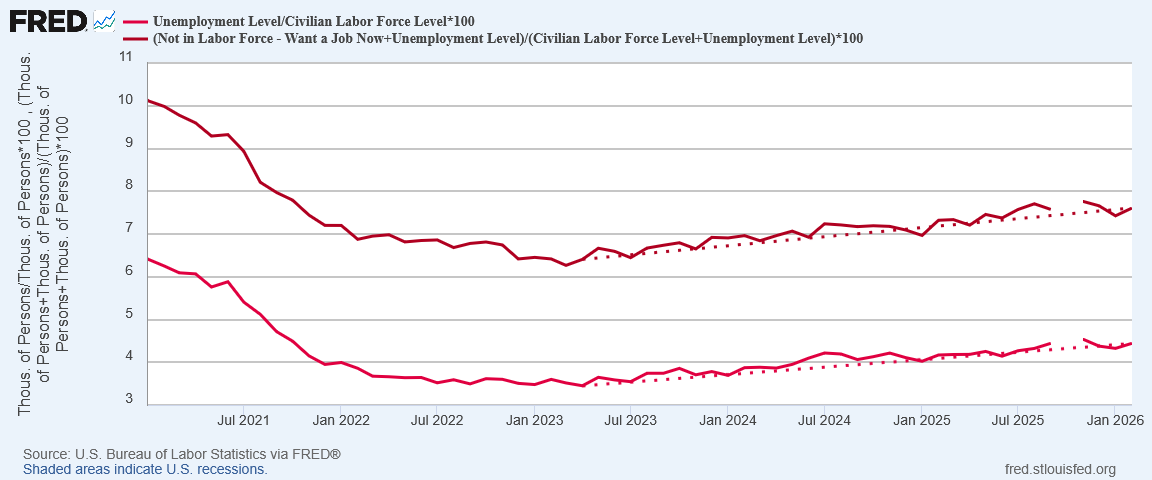
Even with the decline in separations on the JOLTS report, the long term trend for joblessness in this country is rising.
Rising joblessness should be a major red flag, particularly at this juncture. With soaring oil prices, rising and elevated joblessness is a deflation indicator that sets the stage for stagflation. The missing ingredient is an inflationary price shock—which we may already have received as a result of the war with Iran.
Soft labor markets and some very nasty oil price shocks are what gave us stagflation in the 1970s.
We have soft labor markets. We are about to have a very nasty oil price shock.
Will we have a repeat of 1970s stagflation?
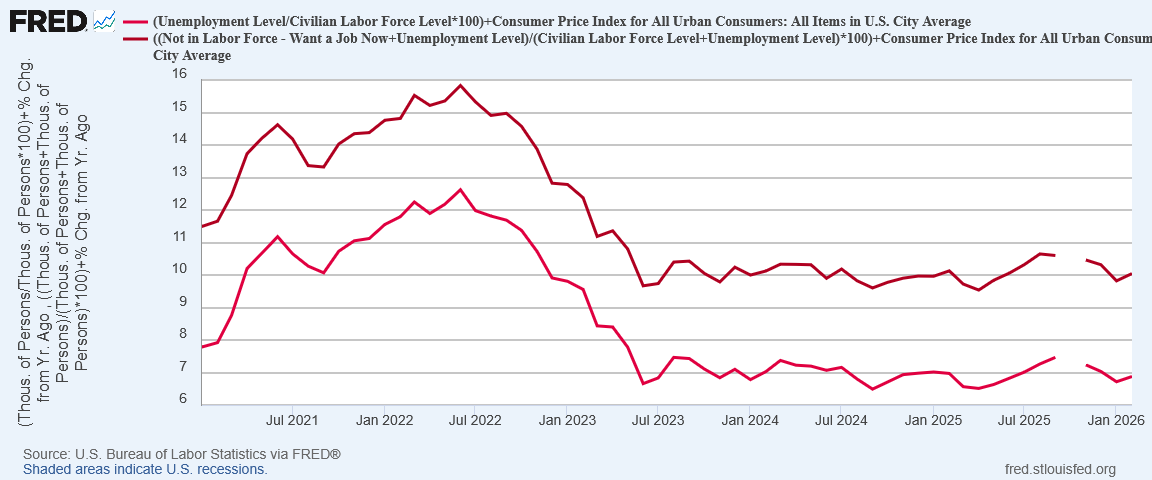
Already, if we start with “real” unemployment and add in existing year on year inflation, we get a “misery index” value that is at the same level as it was using the official unemployment rate back in 1973.
We know that there will be a burst of energy price inflation for March and most likely for April as well. Given the magnitude of recent spikes in energy prices, that much is inevitable. Nor is there any assurance the price spikes will be confined to energy, as energy consumption permeates the whole of every economy worldwide.
That burst of inflation means the March misery index values will be higher than they are now—not “may be”, but “will be”. That outcome is all but guaranteed. April will not be any better and potentially will be even worse.
If the March BLS jobs numbers show the US economy shedding jobs across the board, pushing real unemployment higher, the misery index will rise on that as well.
While we are not right this moment in a stagflationary cycle, we do not need very large pulses of either inflation or unemployment to move us into data ranges very close to the levels of the 1970s, when “stagflation” became a word. We are considerably closer to that level of economic dysfunction than many of the economic “experts” on Wall Street or in the Washington bureaucracy are willing to admit.
We have soft labor markets. We are about to have a very nasty oil price shock.
The fundamental predicates are likely to be met with the March data.
If oil prices quickly return to their pre-war levels, the stagflation risk in the economy will quickly fade as well.
If oil prices do not quickly return to their pre-war levels, the stagflation risk in the economy morphs into a stagflation certainty.
The February Employment Situation Summary showed us yet again that the jobs markets in this country are deteriorating and declining.
The February JOLTS data shows us the Employment Situation Summary data is not exaggerating just how tight and toxic US job markets are.
Add to that a large burst of consumer price inflation and the outcome starts to look very much like the stagflation we saw in the 1970s.
We are already there. We are at the same misery index levels that marked the start of stagflation in the 1970s. The question now is not whether we will reach that threshold, but how far past it will we go, and for how long?
I think you’re right, Peter. I’ll bet Trump agrees with you - he can see the writing on the wall. My hope is that this economic reality, and its political consequences, will compel him to finish this war quickly and decisively, so that he can get back to his overarching plan of MAGA. There are some encouraging signs that the war could be over within a few weeks - let’s hope!