Flu Season Is Coming. Fortunately, So Is The Data
There Are Alternatives To The Pandemic Panic Propaganda Of The Corporate Media
With the 2022-2023 flu season “officially” about to begin1, the first flu season with the COVID-19 “pandemic” over for all practical purposes2, a review of the syndromic surveillance capacities within the United States is in order. Lost in the hysteria of the Pandemic Panic Narrative was the reality that the United States has for years had a regular method of reporting and tracking Influenza-Like Illnesses (ILI).
With the COVID-19 pandemic in the rear-view mirror of history, a return to the syndromic surveillance methods is now an absolute imperative.
COVID Testing Was Never Necessary, And Never As Effective As Syndromic Surveillance
One point needs to be brought to the foreground straight away, to illustrate the relevance and importance of syndromic surveillance: Despite the media’s obsession with mass diagnostic testing for COVID-19, that methodology was never optimal for disease tracking, and was a demonstrated failure as a surveillance tool as early as the spring of 2020.
This was the case even before media reports emerged documenting the potential of COVID-19 PCR tests, with their abnormally high cycle thresholds, to have a false positivity rate as high as 90%.
The PCR test amplifies genetic matter from the virus in cycles; the fewer cycles required, the greater the amount of virus, or viral load, in the sample. The greater the viral load, the more likely the patient is to be contagious.
This number of amplification cycles needed to find the virus, called the cycle threshold, is never included in the results sent to doctors and coronavirus patients, although it could tell them how infectious the patients are.
In three sets of testing data that include cycle thresholds, compiled by officials in Massachusetts, New York and Nevada, up to 90 percent of people testing positive carried barely any virus, a review by The Times found.
While the data does not provide any good explanation as to why public health officials and various “experts” abandoned the established syndromic surveillance systems for COVID-19, it is worth noting that even Eric Feigl-Ding, the Twitterverse’ Drama Queen of the Pandemic Panic Narrative, was compelled to utilize syndromic surveillance data when his beloved testing regimes failed to provide the data he wanted.
Note the date on Feigl-Ding’s Tweet: March 16, 2020. That is at least how long the “experts” have realized the existing syndromic surveillance data could track even COVID-19.
Fortunately, most if not all of the same syndromic surveillance systems still exist, are still in use, and still make their data publicly accessible. One never need rely on corporate media to know the state of infectious respiratory disease in a community.
The CDC’s Nationwide Surveillance System
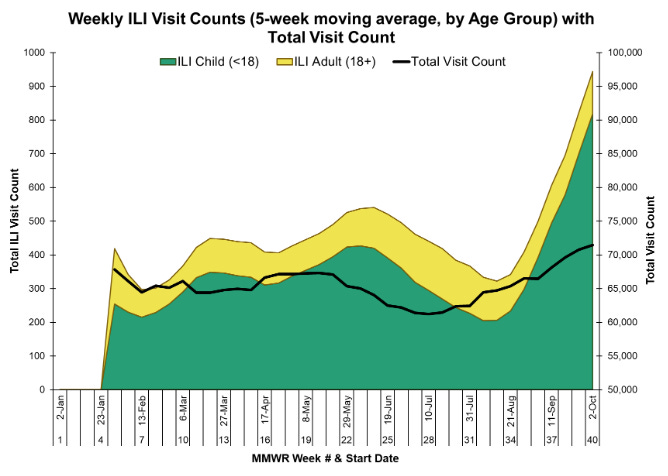
Believe it or not, before COVID-19 the CDC was actually able to put together a reasonably useful weekly surveillance report detailing the extent of Influenza-Like Illnesses in the United States known as the FluView system.
The FluView system has two main features: 1) The Weekly U.S. Influenza Surveillance Report (FluView), and 2) FluView Interactive, which gives the user interactive graphical tools to parse the available data on ILI, for questions and analytics not addresses by the weekly report.
The surveillance report is a fairly comprehensive survey of the reported data for a particular week. In addition to providing a breakdown of diagnostic test data on influenza, including the variants and lineages being identified, the report also includes summary data on hospitalizations (although current hospitalization data from the FluServe-NET program will not be incorporated for a few weeks yet).
One point the CDC’s weekly report brings to light is how rarely influenza-like symptoms are actually attributed to influenza. In the current reporting week, only 3.3% of all influenza tests were positive for either influenza A or B.
An important nuance to the influenza testing data—as a rule people only get tested when they are sick enough to go to the doctor or emergency room. Thus, only 3.3% of symptomatic patients during the current reporting week actually had influenza.
Imagine how anemic the Pandmic Panic Narrative would have sounded had the “experts” and the media not abandoned the very useful data from the surveillance report.
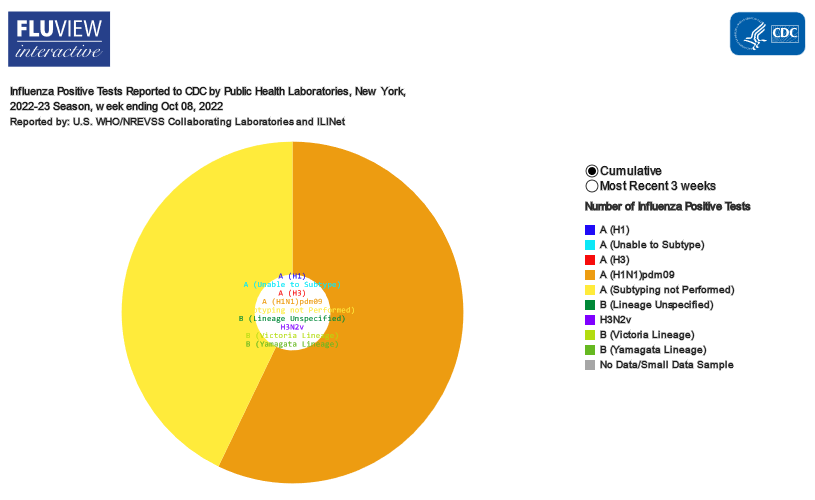
FluView Interactive is a dashboard that lets users zero in on specific data sets and queries, such as cumulative test totals for a particular state.
Aggregate data is also downloadable from FluView Interactive for those wanting to do their own charting and analysis.
While the FluView system itself—as is true of all reporting systems—is only as good as the data going into the system, it still provides a useful overview of infectious respiratory disease not just on a national level but also at a state level as well. The data is of sufficient quality that one can make reasonable assessments about individual risk levels and take appropriate preventative steps.
State Surveillance Reports
In addition to the CDC’s FluView system, all states and a number of major cities have their own surveillance systems for tracking infectious respiratory disease.
New York State, for example has their NYS Flu Tracker, an ILI dashboard that provides county-by-county ILI data for the entire state.
While New York State will not begin providing data for the upcoming flu season until the end of October, the tracker is available now, just with last year’s data.
Texas, through its Department State Health Services, provides a weekly Influenza Surveillance Activity Report. The Texas report began tracking for the 2022-2023 flu season as of last week (reports typically lag a week, and so the current report on the Texas site is the latest report, which is from the first week of the “official” infuenza season. As of this writing, there is one report available for the 2022-2023 season, that for the first week.
While the layout of the report is of course different from the NYS Flu Tracker report, it nevertheless is still a comprehensive assessment of the current state of infectious respiratory disease in the state, including historical comparison to prior seasons.
One can quickly see whether current disease data indicates that this flu season is more or less severe than previous seasons, giving a perspective that has been noticeably lacking in COVID reporting.
In addition to the reporting by state departments of health, influenza-like illnesses are reported by a number of cities around the country.
The Houston Health Department, for example, publishes its own weekly reports during the cold and flu season. Like many reporting agencies, it does not maintain these data sets all year round (thus the Houston site only advertises one single report as of this writing).
Aside from formatting differences, the Houston Health Department publishes the same data and analytics as the state-level reports and the CDC FluView report.
Public health bureaucracies being the dense and obscure entities that they are, a bit of searching may be required to find the influenza report for your city. However, most major metropolitan cities and counties should have this information generated on a weekly basis.
Knowledge Is Strength
It is far too soon to tell if this year’s flu season will be severe, mild, or somewhere in between. It is far too soon if COVID-19 will amplify this year’s flu season. Whether the season is severe or mild, whether COVID-19 is a factor or not, however, what is certain is that the empirical data will yield a better assessment of how much illness is in your community. The data is out there. The data can be assessed and interrogated, not just to make prudent personal assessments of risk to decide what precautions to take, but also to know if what is being reported about the levels of disease in your community makes sense—as so often was not the case with COVID-19.
Knowledge is always the greatest strength people can ever have. Facts and data are always the best weapons against propaganda. A replay of the Pandemic Panic Narrative is impossible if people pause, look at the facts, look at the data, and know the reality of the situation for themselves, without trusting the propagandistic corporate media.
Data is where truth is found. Narrative is not. Always get the data if you want to know the truth about anything.
Many states and jurisdictions begin tracking ILI data around the first week in November, while other jurisdictions have October as the tail end of the previous flu season. Thus, while the systems are already in place, regular reporting may not have started in some states as of yet.
Despite even the President bluntly stating that the COVID-19 pandemic is “over”, HHS Secretary, as had been widely expected, renewed the Public Health Emergency Declaration on October 13. In that “official” context, one could argue that there is still a pandemic, although that does not appear to be the prevailing public sentiment.


