Good News! July Saw Even Fewer Fake Job Openings
The Fed Needed A Good Fake Job Openings Report And The BLS Delivered
The Federal Reserve got some welcome fake news on the job front with the release of the July Job Openings and Labor Turnover Summary Report. The made-up seasonally adjusted job openings number declined for the third straight month, slipping below 9 million for the first time since March 2021.
The number of job openings edged down to 8.8 million on the last business day of July, the U.S. Bureau of Labor Statistics reported today. Over the month, the number of hires and total separations changed little at 5.8 million and 5.5 million, respectively. Within separations, quits (3.5 million) decreased, while layoffs and discharges (1.6 million) changed little. This release includes estimates of the number and rate of job openings, hires, and separations for the total nonfarm sector, by industry, and by establishment size class.
Not only was this exactly what the “experts” hoped would happen, but the drop even managed to exceed the “experts” lofty expectations.
“This is where we wanted to go; we’ve got job openings heading downward, but in a calm, cool and collected manner,” Rachel Sederberg, senior economist with labor market research and analytics firm Lightcast, told CNN.
Economists expected openings would drop to 9.465 million, according to Refinitiv consensus estimates.
That the reported number of job openings is once again completely bogus is a reality the “experts” choose not to consider. Why question it when it’s what the Fed needs to claim its failed inflation strategy is working?
There is no doubt, however, that the job openings number is almost entirely fictional, as are any “improvements” in that number. The trends within the data set as well as the Bureau of Labor Statistics’ penchant for revisions after the fact make that clear.
That the job openings number is largely a work of fiction is, of course, a theme my regular readers have seen more than once.
At this point, it is no longer a surprise that the total number of non-farm job openings in the US still greatly exceeds any semblance of the historical norm—a phenomenon made more improbable by the lack of any similar increase in hiring.
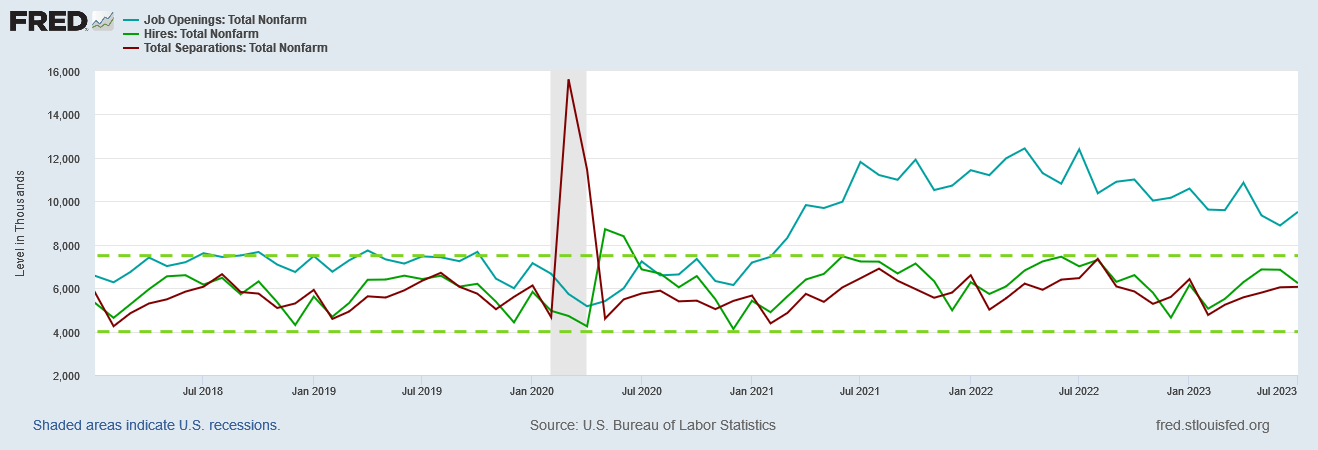
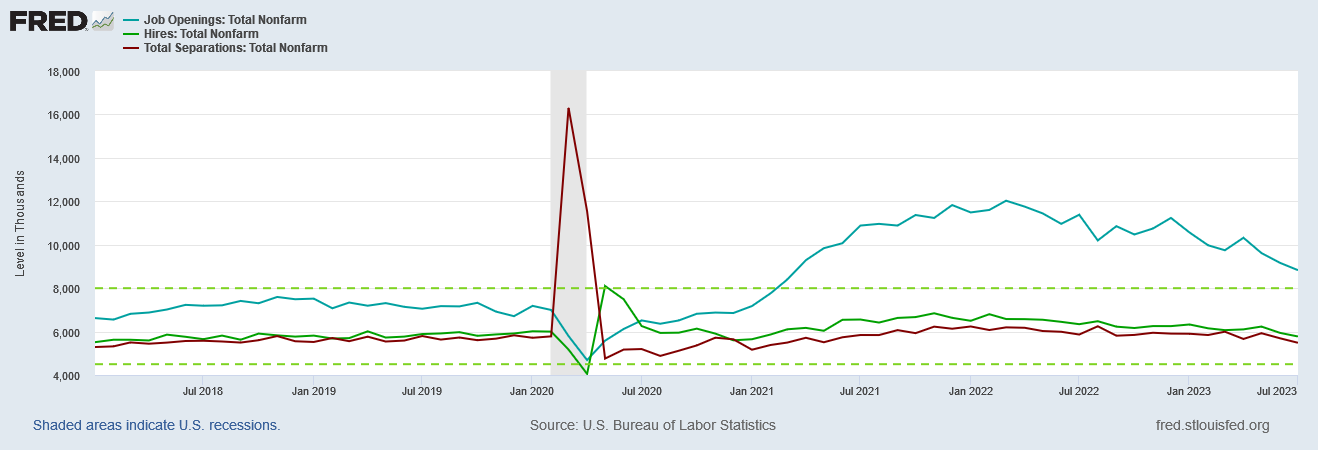
Outside of the Pandemic Panic Recession, and prior to 2021, job openings as well has total hires and total separations primarily fluctuated within the range 4,000,000 to 7,500,000 jobs. It was only after 2020, and after the 2020 Pandemic Panic Recession, that job openings surged upward—but job hires did not. Neither did separations fall below that range.
This pattern has not changed. In fact, on an unadjusted basis, the number of reported job openings in July actually rose.
The unadjusted total number of hires did decline, while the number of separations rose.
More job openings with fewer people being hired to fill those job openings while more people are leaving jobs (and thus creating some of those job openings) is the exact opposite of what the corporate media and the “experts” are saying is happening—and this is not a positive turn of events but a negative one. “Positive” would be more people being hired and fewer people being separated.
The seasonally adjusted numbers, of course, look a bit more palatable (imagine that!).
Through the magic of “seasonal adjustments”, the increase in job openings became a decrease, and the third such decrease in a row. Hiring declined, but so did separations, presumably keeping the net effect positive.
That the seasonally adjusted numbers are more sanitized and show all the “right” trends by itself calls into question the validity of the seasonal adjustment factors being used. Seasonal adjustment factors are a valid statistical method for isolating longer term trends from transient cyclical fluctuations (or “seasonality”), but when the seasonal adjustments obscure significant shifts in the unadjusted data, it is necessary to question the validity of the adjustment factors being used—a valid methodology is no guarantor the discrete factors are themselves valid.
When we look back at the historical data from recent jobs reports, we see further reason to question things: the numbers keep being “revised” downward.
There is a wealth of data in the FRED system for assessing the jobs outlook in this country, but the regular FRED data carries an important caveat: the BLS quite often revises historical data, and the FRED charts don’t convey the impact of these revisions. The regular FRED charts are always net of such revisions.
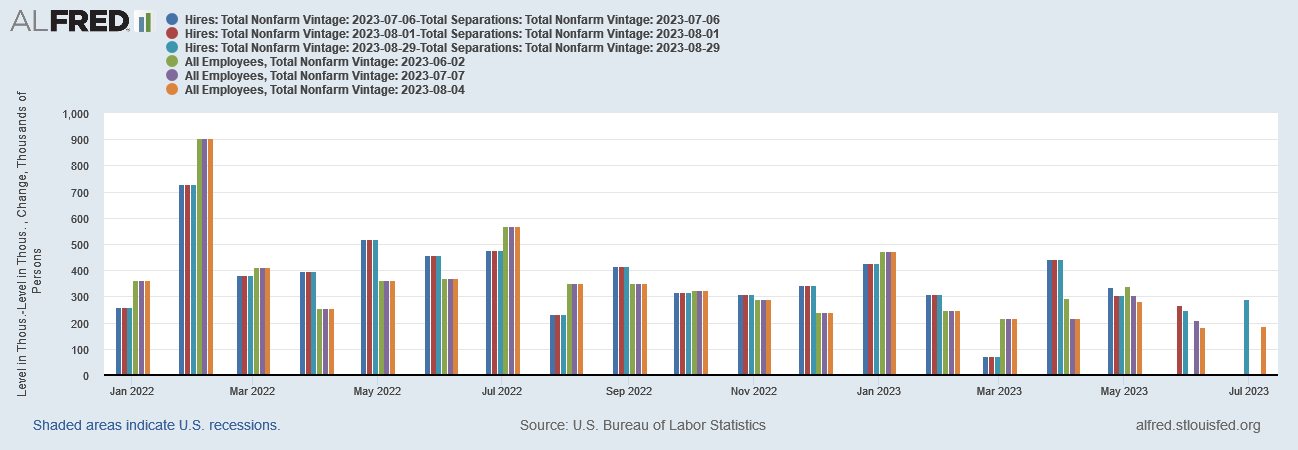
However, there is a companion system to the FRED system, ALFRED, which archives each month’s data set prior to revisions. This allows us to establish the magnitude and direction of the BLS’ routine revisions to the historical data.
When we look at the past few months archival data on job openings, we see that the BLS has routinely revised the job openings number downward.
This suggests that the 8.8 million job openings reported for July is almost certainly overstated, and will be “corrected” next month with little fanfare.
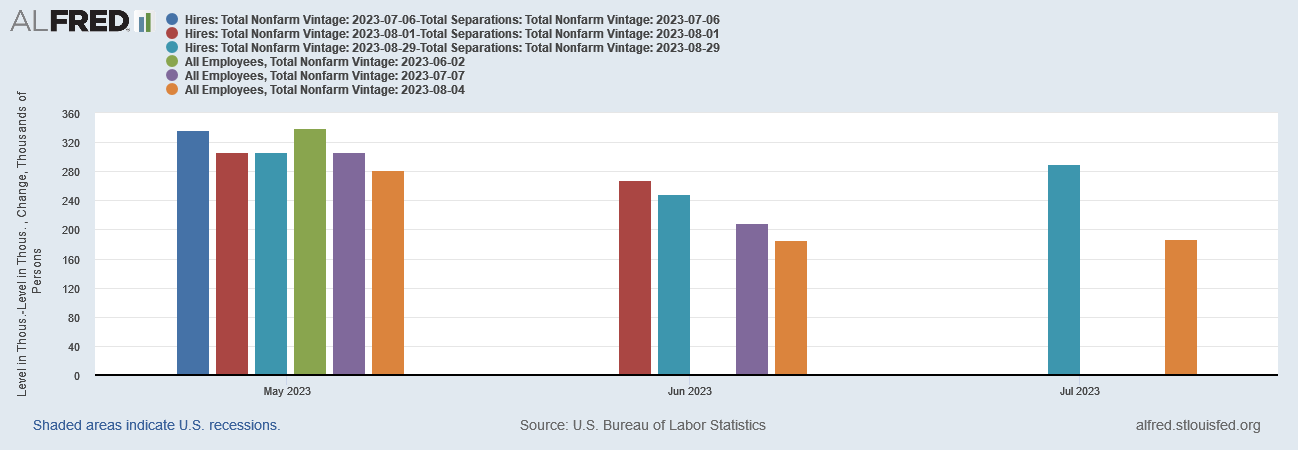
But it’s not merely job openings that are adjusted this way. Hires and separations are also routinely revised, with the effect that the net hires—total hires less total separations—is also revised down every month.
We see the same pattern played out with the monthly Employment Situation Summary: the reported number of jobs “created” each month in the following month manages to shrink somewhat.
In other words, each month the BLS routinely overstates the employment situation, and routinely tries to correct themselves after the fact. However, there is one important difference between the JOLTS revisions and the Employment Situation Summary revisions: the Employment Situation Summary revisions are disclosed at the end of each month’s report.
The change in total nonfarm payroll employment for May was revised down by 25,000, from +306,000 to +281,000, and the change for June was revised down by 24,000, from +209,000 to +185,000. With these revisions, employment in May and June combined is 49,000 lower than previously reported. (Monthly revisions result from additional reports received from businesses and government agencies since the last published estimates and from the recalculation of seasonal factors.)
No such disclosure is in the JOLTS report, even though ALFRED shows that revisions are being made each and every month.
There are other aspects within the current data set which call the seasonally adjusted data into question.
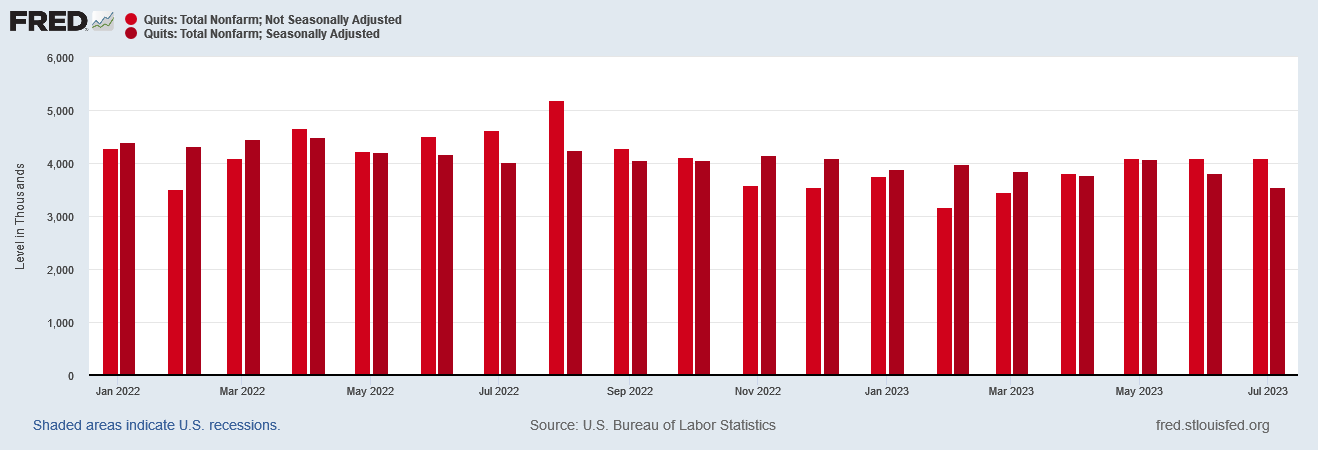
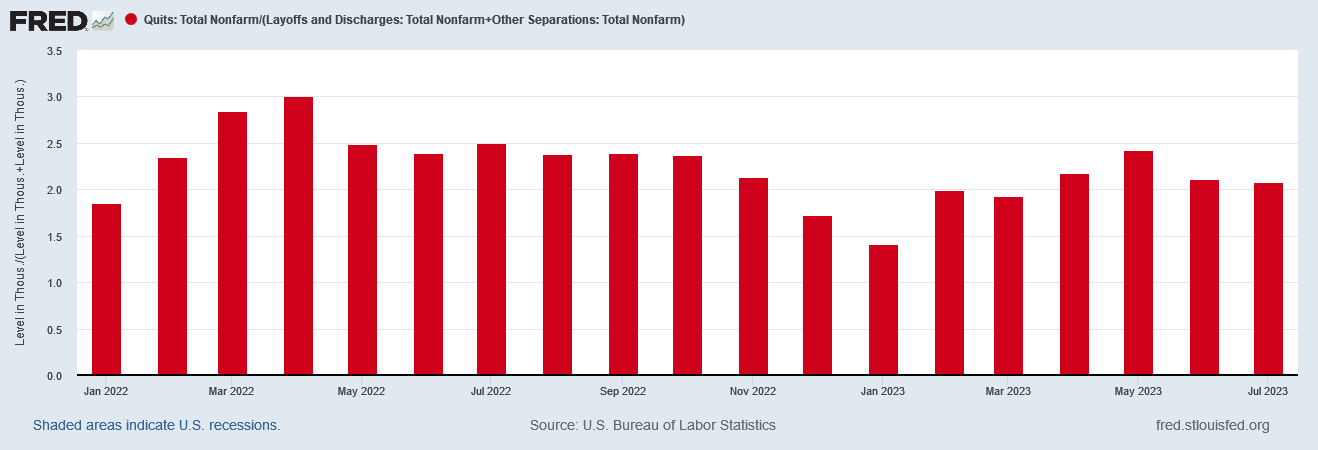
One item is the Quits data. While the seasonally adjusted numbers show a marked drop in the number of people who quit their jobs, and a downward trend over the past three months, the unadjusted data shows the number of quits to be almost unchanged month to month.
With the number of quits having been reported as increasing during the prior three months, it begs the question of how there can be a seasonal variance which can produce the recent downward trend. If there is little fluctuation month to month in the unadjusted data, that should have a moderating influence on the seasonal adjustment factors, and the seasonally adjusted data should show a similar plateau over the past three months. That it does not invites us to interrogate the data further, with particular attention paid to the use of seasonal factors.
We also need to pay attention to the fact that quits (unadjusted) are still running more than double all other forms of separation.
This is extremely relevant because the corporate media, seizing on the seasonally adjusted data, reported almost the exact opposite:
In addition, a smaller number of workers quit their jobs, businesses hired fewer workers and layoffs nudged higher as the US job market settles into a calmer, more balanced state.
While “the Great Resignation” has receded significantly from its peak in April of 2022, the ratio of quits to other forms of separation is still significantly higher than it was in the pre-pandemic era.
As with the number of job openings, to have such a magnitude shift and leave it unremarked automatically invites skeptical interrogation of the data. We should not be taking these numbers at face value.
Comparing the JOLTS data to the Employment Situation Summary highlights further reasons for concern over the data.
During the same period the seasonally adjusted JOLTS data shows a downward trend in separations, the Employment Situation data shows a decrease in the seasonally adjusted number of workers not in the labor force. At the same time, the unadjusted data on both reports show an increase in separation and an increase in the number of workers not in the labor force.
The Employment Situation Summary and the JOLTS report are thus being “inaccurate” in the same direction at the same time, suggesting that many of those who are separated from their job exit the labor force altogether. That is a worrisome pattern to see.
That we see parallels between the Employment Situation Summary and the JOLTS report takes on added significance when we consider that the Employment Situation Summary has been overstating the number of jobs created, most recently by at least 306,000.
The number of workers on payrolls will likely be revised down by 306,000 for March of this year, according to the Bureau of Labor Statistics’ preliminary benchmark revision. The downward adjustment was smaller than some economists expected.
These revisions are fundamentally routine, as the BLS benchmark announcement indicates.
Each year, the Current Employment Statistics (CES) survey employment estimates are benchmarked to comprehensive counts of employment for the month of March. These counts are derived from state unemployment insurance (UI) tax records that nearly all employers are required to file. For National CES employment series, the annual benchmark revisions over the last 10 years have averaged plus or minus one-tenth of one percent of total nonfarm employment. The preliminary estimate of the benchmark revision indicates a downward adjustment to March 2023 total nonfarm employment of −306,000 (−0.2 percent).
Furthermore, the Philadelphia Federal Reserve each quarter calculates the error margin for a previous quarter’s jobs data (the Philly Fed runs approximately two quarters behind, as a rule). For the second quarter of 2022, for example, the Philly Fed assessed the total number of jobs created was a mere 10,500.
In the aggregate, 10,500 net new jobs were added during the period rather than the 1,121,500 jobs estimated by the sum of the states; the U.S. CES estimated net growth of 1,047,000 jobs for the period.
In the fourth quarter of 2022, the Philly Fed again called out the BLS’ Current Employment Statistics for overstating job growth in the US.
For 2022 Q4, payroll jobs in the 50 states and the District of Columbia rose 0.3 percent, after adjusting for QCEW data.
• Based on the current CES sum of states, payroll jobs grew 1.7 percent.
• Based on the U.S. CES, payroll jobs grew 2.2 percent.
There can be little doubt, therefore, that the BLS has a tendency to overstate its jobs numbers to a significant degree. The variance between the unadjusted and seasonally adjusted hires and separations data within the JOLTS report suggests that July of 2023 (and thus the third quarter of 2023) might well be another one of those periods.
Even after accounting for overstatements and subsequent revisions, the broad trend within the jobs data reported by the BLS is the same: job growth has been steadily declining in the US since 2021.
We see this in the current data sets net of all revisions, both when we net the hires and separations from the JOLTS report and in the change in payroll jobs from the Employment Situation Summary.
We see the same broad trend in the archival data as well, which shows the revisions between vintage series within the data set.
Thus the “cooling” trend in the labor market that the corporate media would have us believe is of fairly recent origin is in reality the actual long term macro trend throughout Dementia Joe’s Reign of Error.
The data that both Dementia Joe’s regime and the Federal Reserve use to trumpet their own successes chart a reality that is diametrically at odds with their preferred narratives. In terms of job creation, or lack thereof, the trend presented by the data has been fewer jobs and less net hiring, and this has been the case since at least early 2021. Whether one is evaluating the jobs creation track record of Bidenomics or that of the Fed’s inflation fighting strategy, the end result for workers is the same: fewer and fewer jobs, with fewer and fewer workers filling them. These are not good trends.
The one truth we see when we look closely at the BLS’ jobs data is that the corporate media, the BLS, and the “experts” either do not know what they are talking about when it comes to jobs or they are flat out lying. There’s no third alternative available.





Several people I know in their 50’s are being fired or laid off. The companies are folding their departments and not rehiring. Magnify that through out the country. Does the government fiddle unemployment and those receiving benefits too? Hmmm. 🤔. Let me think about that. I’m sure you have posted on that subject before. What a mess!!
The ministry of truth