How To Get A Strong Jobs Number: Lou Costello Labor Math
The BLS Once Again Lives Down To Expectations
The anodyne bureaucratic language of the Employment Situation Summary always sounds innocuous and innocent, even (especially?) when it almost certainly is neither. The May report is no exception.
Total nonfarm payroll employment increased by 339,000 in May, and the unemployment rate rose by 0.3 percentage point to 3.7 percent, the U.S. Bureau of Labor Statistics reported today. Job gains occurred in professional and business services, government, health care, construction, transportation and warehousing, and social assistance.
339,000 jobs! Woohoo! Love that strong economy!
Wait…339,000 jobs and a 0.3% rise in the unemployment rate? Um….isn’t the point of new jobs that there would be fewer people unemployed? More jobs means more people with jobs means fewer people without jobs. I’m sure that’s how it’s supposed to work.
And then reality set in….
If 339,000 jobs had been created, one has to marvel at how many people must have entered the labor force to also add three tenths of a percentage point to the unemployment rate—the key word here being, of course, “if”. If 339,000 jobs have not been created then we are staring at yet another pristine masterwork of the Bureau of Labor Statistics greatest talent: Lou Costello Labor Math.
When all else fails, just cook the books.
Of course, the corporate media dutifully plays its part in the monthly charade, quick to talk up the numbers and how they beat “expectations”.
Nonfarm payrolls increased by 339,000 jobs last month, the Labor Department said in its closely watched employment report on Friday. Data for April was revised up to show payrolls rising by 294,000 jobs instead of 253,000 as previously reported.
Economists polled by Reuters had forecast payrolls increasing by 190,000.
In other words, the headline jobs number came in at 178 percent of forecast. Oh, and unemployment also climbed.
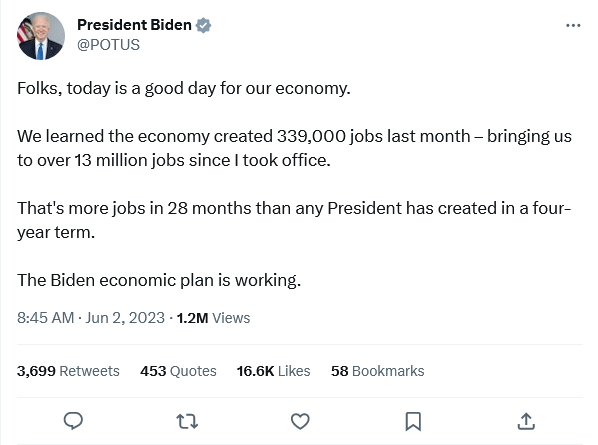
Dementia Joe’s handlers couldn’t resist the opportunity to chime in:
So how did they pull off this economic miracle? By lying, naturally. When you look at the rest of the numbers there’s no other plausible way.
Especially when the percentage of workers not in the labor force more or less held the same, according to the report.
The labor force participation rate held at 62.6 percent in May, and the employment-population ratio, at 60.3 percent, was little changed. (See table A-1.) The number of persons employed part time for economic reasons, at 3.7 million, changed little in May. These individuals, who would have preferred full-time employment, were working part time because their hours had been reduced or they were unable to find full-time jobs. (See table A-8.) The number of persons not in the labor force who currently want a job was 5.5 million in May, little different from the prior month. These individuals were not counted as unemployed because they were not actively looking for work during the 4 weeks preceding the survey or were unavailable to take a job. (See table A-1.)
To recap: Same number of workers not in the labor force. Same number of workers in the unemployment line. 339,000 workers found jobs. That is by any metric an amazing set of statistics. That is, by any metric, perhaps a little too amazing.
One sign that there might be something off in the reported numbers: The raw unadjusted number are almost three times as large.
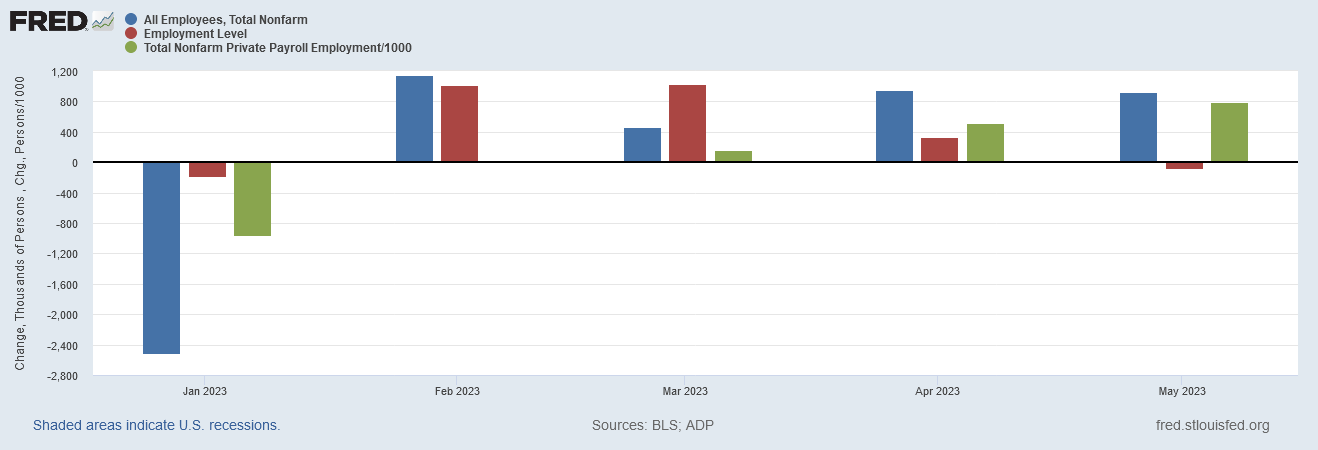
On an unadjusted basis, in May there were 920,000 new jobs created according to the Establishment Survey.
On an unadjusted basis, in May there were 790,000 new jobs created, according to the ADP National Employment Report.
On an unadjusted basis, in May there were 73,000 jobs lost, according to the Household Survey, the second of the two surveys reported monthly in the Employment Situation Summary.
Not exactly the same story as the seasonally adjusted numbers.
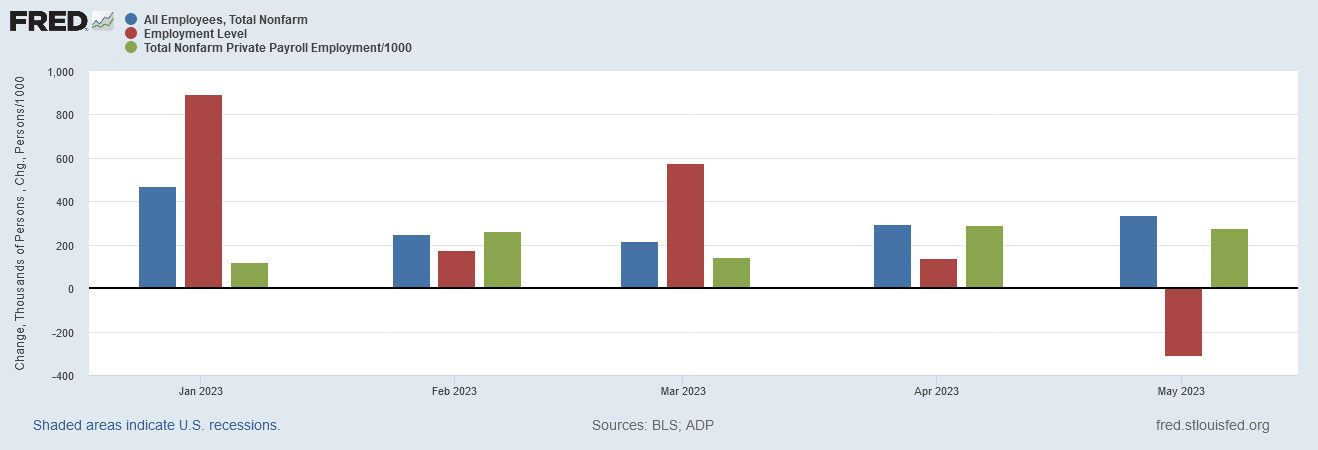
On a seasonally adjusted basis, in May there were 339,000 new jobs created according to the Establishment Survey.
On a seasonally adjusted basis, in May there were 278,000 new jobs created according to the ADP National Employment Report.
On a seasonally adjusted basis, in May there were 310,000 jobs lost according to the Household Survey.
How could one survey show job loss and the others show job creation?
The easy answer: Lou Costello Labor Math. For new readers who might not understand the reference, I’m referring to the classic Abbott and Costello routine where Lou Costello adds 7 13 times to get 28.
Once you watch that, the BLS report makes perfect sense.
When you use Lou Costello’s principles of math, it makes sense that a net loss of 310,000 jobs in the Household Survey, comprised of a loss of 23,000 full time jobs and a loss of 220,000 part time jobs, could produce a jobs gain of 339,000 jobs on a seasonally adjusted basis.
It makes sense that the employment levels—total employment, full time work, and part time work—in the Household Survey could in May be at 120.6%, 117.7%, and 137.2% of their April, 2020, levels, while the jobs in the US per the Establishment Survey rose by 19.7%.
It makes sense that Dementia Joe would be bragging about creating mostly part time work, acting as if that is enough to feed, clothe, and shelter one’s family.
It makes sense that, in the same month as all this, the total number of unemployed workers rose by 440,000.
It makes sense that, in those 440,000 newly unemployed, 318,000 lost their jobs. It makes sense that, to arrive at that 440,000 newly unemployed, 25,000 fewer workers quit their jobs and 23,000 fewer workers entered the workforce without finding a job.
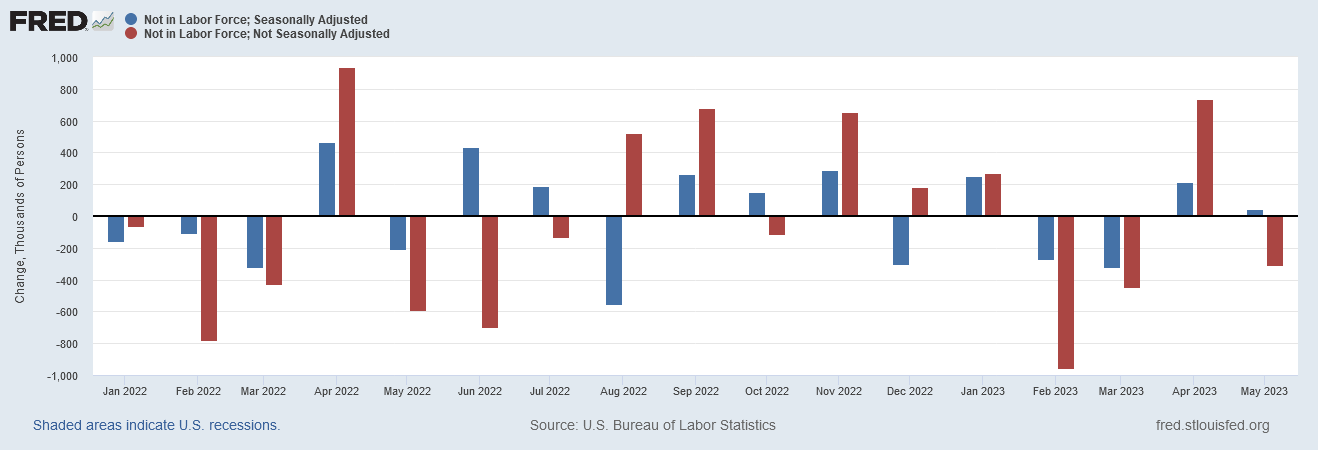
It makes sense that the seasonally adjusted cohort of workers not in the labor force could rise by 45,000 workers, with the unadjusted cohort not in the labor force falling by 306,000 workers, in the same month that a seasonally adjusted 339,000 new jobs were created.
Lou Costello Labor Math explains it all. Just add up the numbers however you like to get the results that you want.
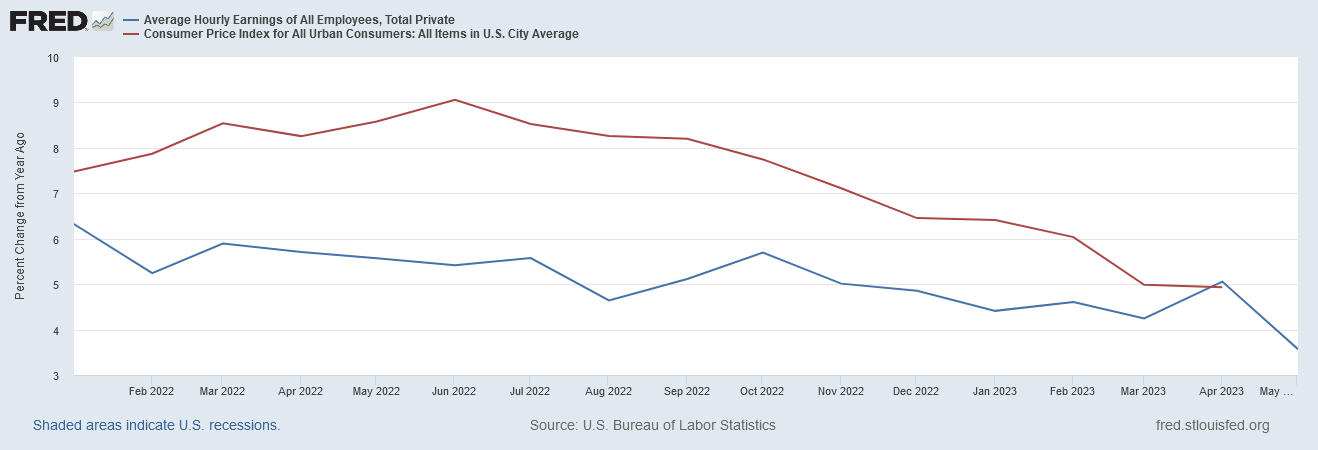
Of course, what Lou Costello Labor Math cannot hide—and what Dementia Joe’s handlers wisely did not tweet about on his behalf—is how the the increases in average worker pay each month have been below the inflation level for that month every month since at least the beginning of 2022.
On earnings, the unadjusted percentages are better, but only just.
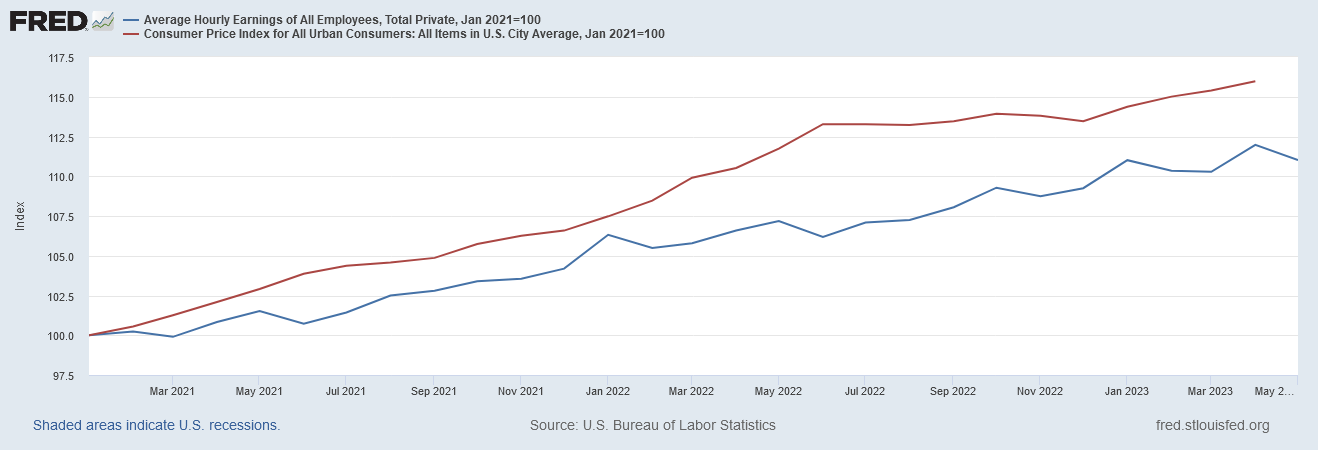
Nor can Lou Costello Labor Math obscure the fact that, from January 2021 to April of 2023, unadjusted average pay rose a total of 12% while unadjusted consumer price inflation rose a total of 16%—putting workers that much deeper in the hole during Dementia Joe’s Reign of Error.
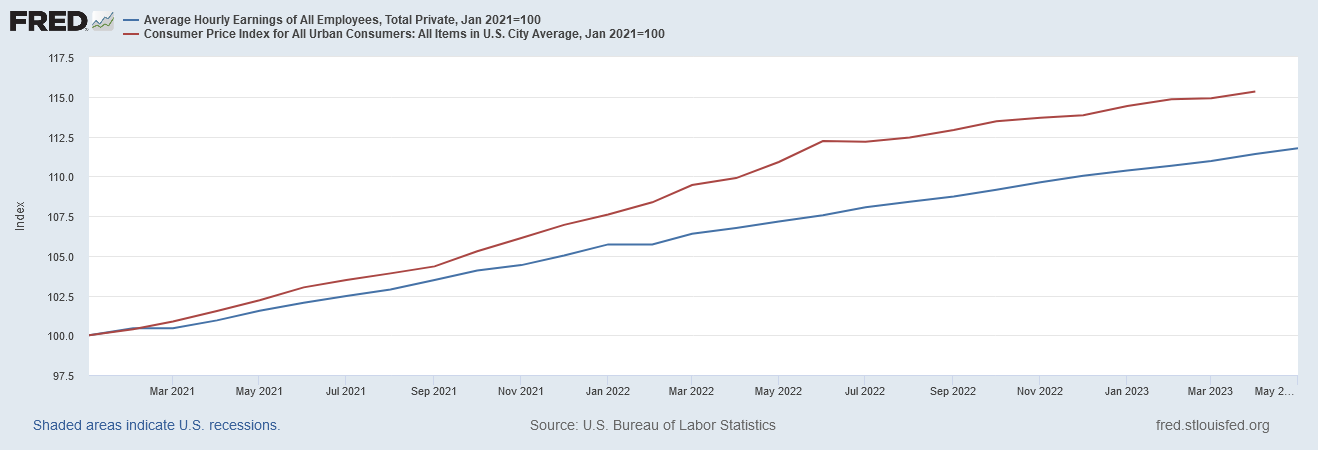
The seasonally adjusted indexed values aren’t any better: 11.4% pay gains vs 15.3% inflation gains since January 2021.
That part of the jobs report the corporate media and the demented regime in the White House hope you’ll be too busy laughing at the absurdity of their jobs claims to notice the long, deep, and ongoing screw job workers are getting on their pay rate because of uncontrolled inflation.
As a vaudeville sketch, Lou Costello Labor Math would be as funny as the Abbot and Costello original.
Unfortunately, the Employment Situation Summary is not a vaudeville sketch (although it would be interesting to see some comic turn it into one!). The Employment Situation Summary is what the economic “experts” at the Federal Reserve will use as part of their determination if the economy is too healthy and too strong for either its own or our own good.
The Employment Situation Summary will be used by the Federal Reserve as “Exhibit A” on why the federal funds rate should be either raised, left the same, or lowered.
With the Federal Reserve using garbage data, how can it hope to make anything but a garbage decision?
As a vaudeville sketch, Lou Costello Labor Math would have everyone laughing hysterically.
As a report on the state of job markets in this economy, Lou Costello Labor Math has no one laughing.





"How do I do new math with an old math mind?"
-Linus (Peanuts)
Not challenging, Bud -- literally just thinking: would the fact that May is also the month for most college graduations have any effect on the wonky numbers?