Inflation: Hours Rather Than Prices
Food Price Inflation Shows Us The Real Impact On Consumers' Wallets
I want to give a shout out to Stacy Cole, as her comment about understanding economic through her wallet was the inspiration for this little exploration of food prices.
The tarrif issue keeps coming up with Kamala supporters. They ask me if I'm prepared to be dirt poor. “Do you have difficulty buying gas or groceries now? Well, get ready to not be able to afford anything.” Since I only understand economics via my wallet, I really don't have an educated response. I think Trump will be flexible in his decisions and do what appears to be in the best interest of everyone's wallet, but do they have a point?
Ultimately, everyone’s understanding of economic issues comes down to their “wallet” (more accurately with the debit and credit cards in the wallet), and the choices made with the cash therein.
However, the part of that understanding which frequently goes unremarked is how money comes to be in the wallet—namely, wages.
This is the essential understanding we must have about inflation. Prices are not themselves the issue, but how much of our labor a particular price signifies.
Let’s look at some average food prices, and consider what rising prices means to the average paycheck.
One point we need to understand about prices is that they are always relative. It matters less that a price increases and more that it changes relative to other prices.
The price against which the relative changes in consumer prices—e.g., food prices—matter most is the price of labor. In other words, consumer price inflation hurts because it rises disproportionately to what we earn by working.
A quick thought experiment shows this to be the case: If we start with a weekly paycheck of $1,000, and a weekly food budget of $100, we’re spending 10% of weekly earnings on food. If both food prices and earnings rise by 8% we’re still spending 10% of weekly earnings on food.
However, if food prices rise by 8% and weekly earnings do not increase, we’re suddenly spending 10.8% of the weekly paycheck on food.
If we assume that $1,000 paycheck represents a constant amount of labor, if consumer prices go up and labor prices do not, we are compelled to work a correspondingly greater amount just to purchase the same goods in the same quantities.
Even if we had a Weimar-style hyperinflation level of 100%, so long as wages and prices rise by the same percentage, the net impact of inflation remains effectively nil.
As anyone who has earned a paycheck and bought groceries understands, wages and prices never rise by the same degree in the same time frame, which is why we have to consider “real” wages and not merely nominal wages. To have an even somewhat realistic gauge of how much paycheck we have for spending on various items, we must factor out the impact of inflation on prices.
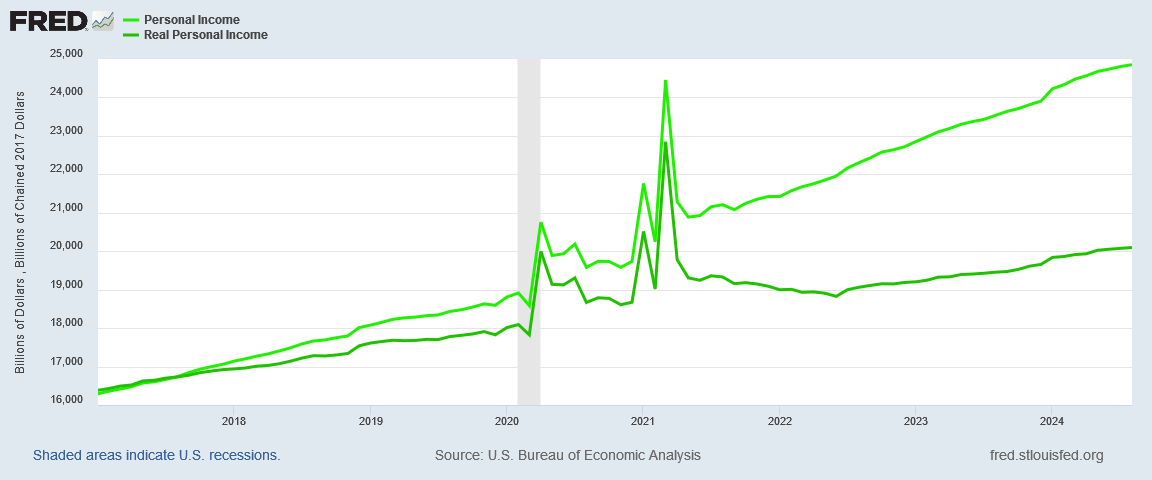
Over time, that impact can be quite significant, as even a simple comparison of nominal vs real personal incomes can show.
One does not need a PhD in economics to understand that inflation is always effectively a reduction in income at all levels.
When we look at the consumer price indices, we are evaluating a proxy for the prices of a wide array of consumer goods and services. If we are looking at the Consumer Price subindex for food, we are looking at a proxy for food prices.
However, there is a caveat we always have to apply when looking at price indices: your mileage will vary. Price indices attempt to consolidate pricing behavior of a vast number of goods and services into a single metric, and so there will necessarily be some deviation between any price index and observable empirical reality.
If we are considering individual goods and services, however, we are not restricted to a price index. We can interrogate price levels more or less directly.
Let’s do that.
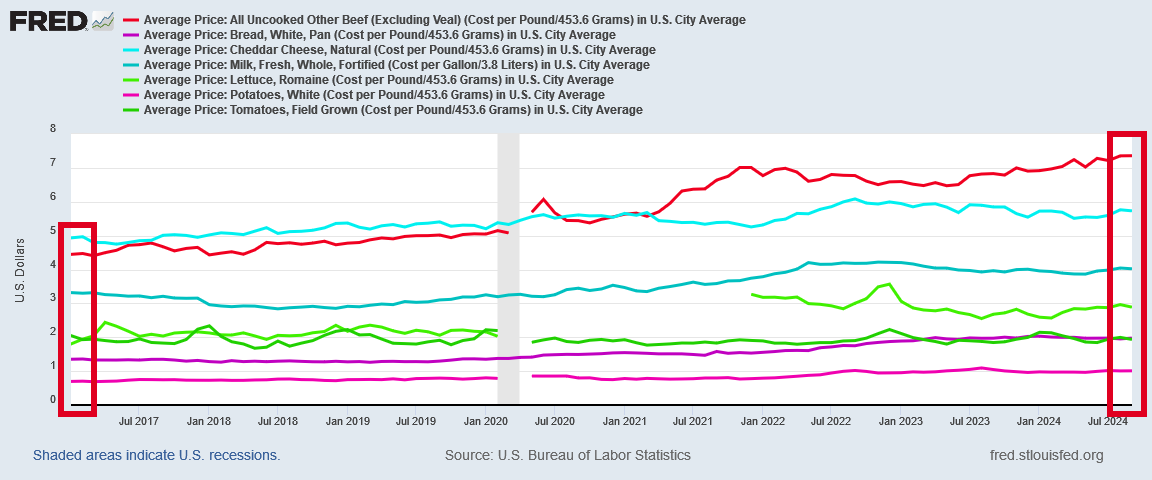
We begin with a set of average prices for certain foods:
Beef
Bread
Cheese
Milk
Lettuce
Potatoes
Tomatoes
Still, we can see how the average prices for each has varied over the past several months and years.
Straight away we see the distorting effects of inflation over time, with the prices as of September being spread across a wider price range than in January of 2017.
Remember, inflation is first and foremost a distortion.
If we index all these prices, we get somewhat clearer sense of how some prices have increased overall, and not just relative to each other.
Note also that the major price increases after 2021, during the (Biden-)Harris Administration.
If we reindex the prices to January of 2021, we can see this more clearly.
This many price elements crammed together can obscure some of the actual price shifts, so let’s examine some of the individual food times separately.
We’ll begin with the price of beef.
A further caveat: the prices used here are the average prices nationwide as compiled by the Bureau of Labor Statistics. In individual markets and individual stores one is certain to see different prices than what is shown here.
As the chart shows, the price of beef has risen significantly since 2017, and in particular in the years following the COVID Pandemic Panic in 2020.
Obviously, rising beef prices impacts the consumer, but recall what I showed earlier about the relative impact of rising prices to rising wages—and wages themselves have been rising.
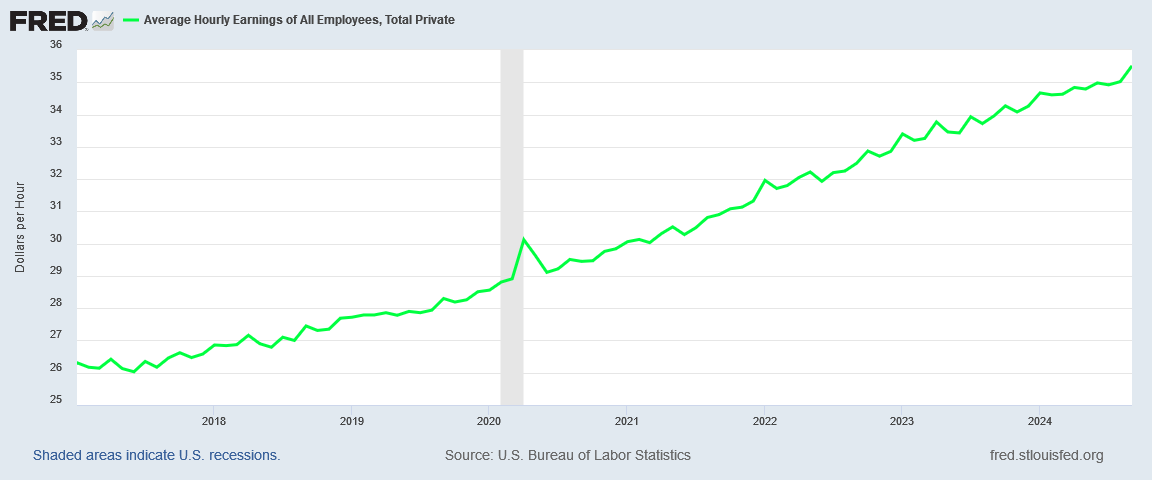
How can we objectively assess rising beef prices against a rising hourly wage? As it turns out, rather easily.
With beef prices given in dollars per pound, and wages given in dollar per hour, if we divide the price of beef by the average wage, we get the fraction of an hour one hypothetically would have to work to pay for a single pound of beef1. We can also think of this as the “labor cost” for beef.
Whereas in January 2017, one had to work 0.169 hours to pay for a pound of beef, by September of 2024 the amount of labor necessary had risen to 0.207 hours.
A quick indexing of these labor values to January 2017 allows us to see more clearly just how much more labor a pound of beef requires over time.
By January 2021, a pound of beef required someone to work 10.1% longer than in January 2017, and in September 2024, that same pound of beef required 22.6% more labor to pay for it than in January 2017.
This is where the consumer price inflation rubber hits the proverbial road. Not only are people paying more per pound of beef, but they are having to work longer to earn the equivalent of the price of beef.
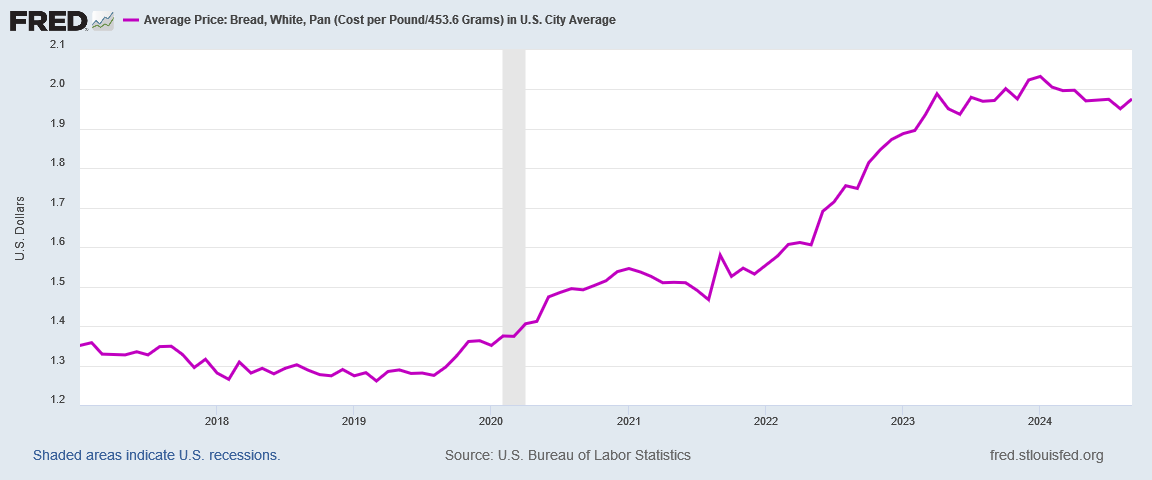
We see similar effects when we look at the price of bread.
The price of a pound of bread showed an even more dramatic inflation surge after COVID than the price of beef, even just looking at the nominal prices.
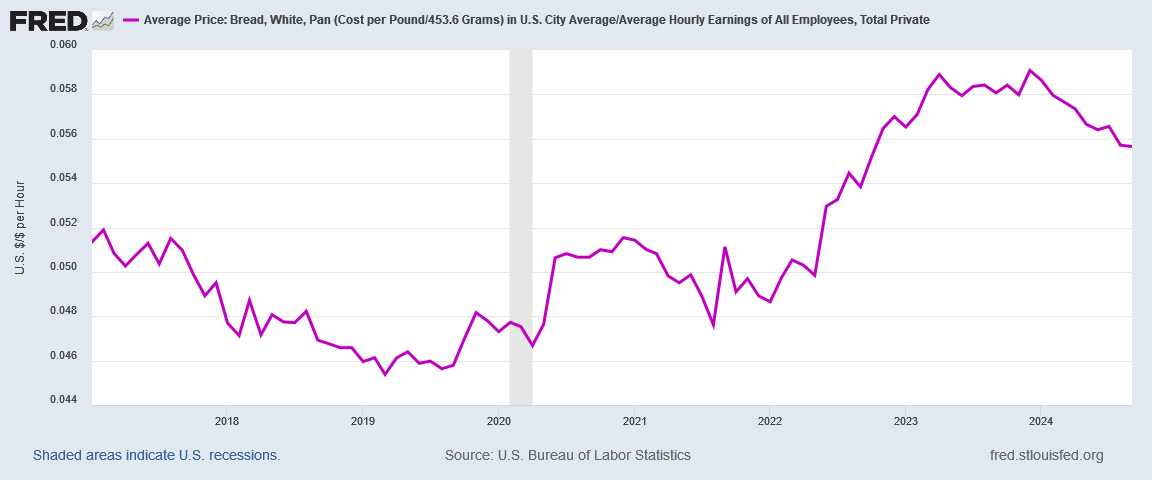
However, when we factor in wages as we did for beef, we can see the true pricing impact of that inflation.
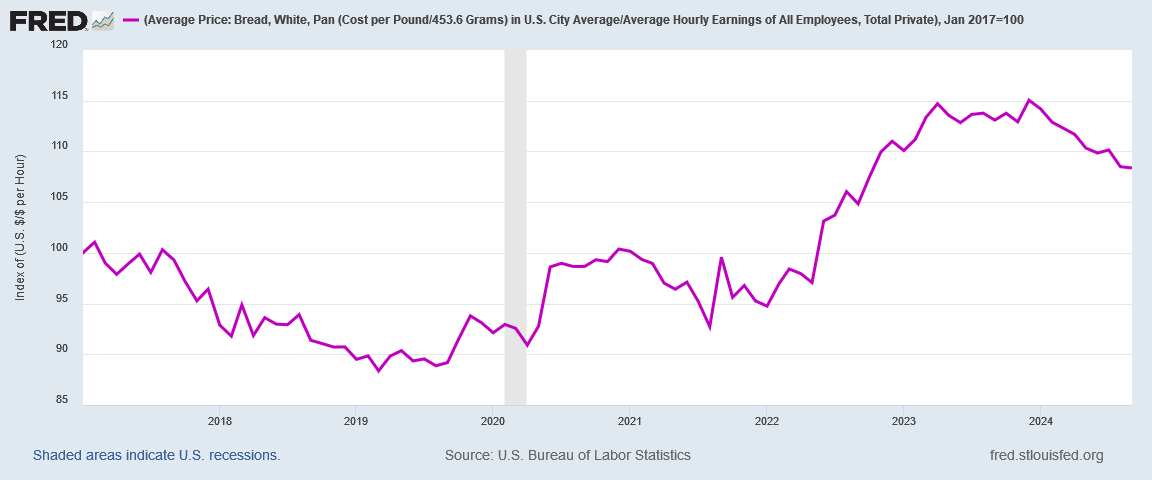
By the time of the COVID Pandemic Panic, a person had to work less to pay for a pound of bread, but by September 2024, that had changed completely, and a person had to work significantly more—and indexing lets us see just how much more.
By January 2021, this “labor cost” of bread was almost exactly the same as in January 2017, but by September of 2024, it had risen by 8.4%, and during the latter half of 2023, that labor cost was as much as 15% of that for Janaury 2017.
Imagine having to work 15% more hours just to be able to buy the same amount of bread. Imagine having to do that when just a couple years before that one could work as much as 12% less for that bread.
When we look at the price of milk, we can see how not all inflation is created equal. As with other foods, the price of milk has risen in recent years.
However, when we factor in an average hourly wage, the hours per gallon “labor cost” of milk has risen along a significantly different trajectory from beef or bread.
Overall, the labor cost of milk has actually fallen, and that is despite an inflationary spike during 2022. Indexing once again we can assess the relative shifts up and down to this labor cost for milk.
At its worst, the labor cost of milk was 3.6% more than in January 2017—which is the least obnoxious increase in labor cost we’ve seen so far. Even with inflation as bad as it has been, by September, 2024, one was able to work 10.6% less to afford the same gallon of milk as in 2017.
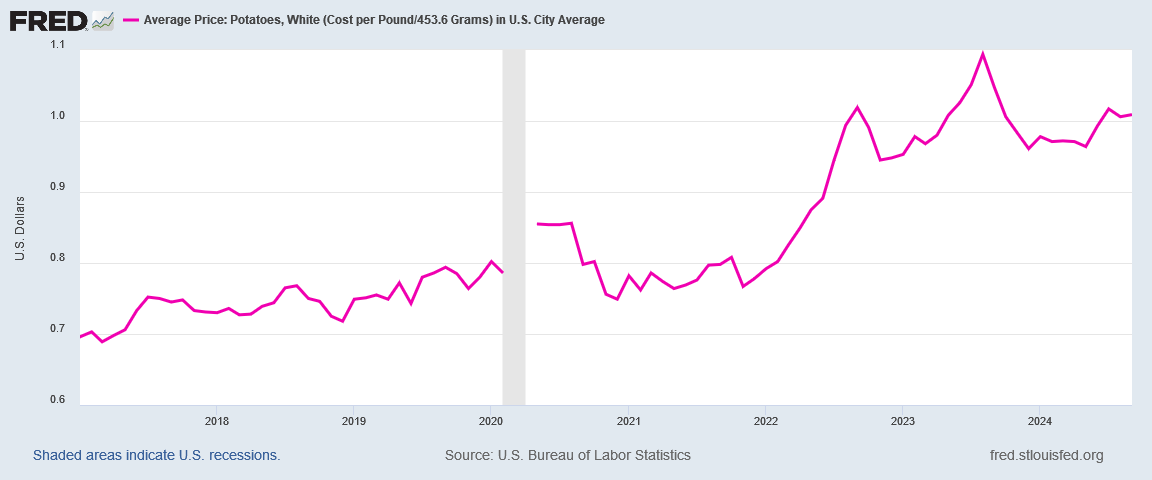
Potatoes show a similar up-and-down labor cost trajectory, even though the nominal price has risen significantly since 2017.
However, the timing and magnitude of that rise is such that the labor cost has shifted along a significantly different curve.
However, as we can see when we index the labor cost, by September 2024 one still has to work 7.4% more for a pound of potatoes than in January 2017.
This is what consumer price inflation “really is”—the amount of labor one must exchange for food, for shelter, for clothing, and ultimately for anything.
Moreover, when we consider the costs in terms how much labor we must exchange for various goods and services, we completely eliminate any concern about how to calculate the “real” price or the “real” wage, for the units of time and quantity are the same today as they were in 2017: we have the same number of hours in a day and in a week as in 2017, and a pound of beef or bread or potatoes is the same amount of food today as in 2017.
While the individual amounts of hours may seem small, whatever we spend on one item, whether we measure dollars or hours, is not available to be spent on any other item. Whatever we must do for food we cannot then repurpose for anything else.
Accordingly, these labor costs are all cumulative. They add up. We add the 22.6% increase in labor cost for beef to the 8.4% increase for bread, subtract the 10.6% decrease for milk, then add in the 7.4% increase for potatoes, and we find that the labor cost for your basic cheeseburger and fries (or steak and potatoes) is 36.8% since 2017 just on the fundamentals alone.
Or, to look at it another way: if one works a full forty hours per week, one would have to increase the workweek to 54.72 hours just to be expending the same proportion of the paycheck on cheeseburgers and steaks.
A third perspective: if one had not gotten a raise since 2017, one would need a 36.8% raise to be able to eat just as well as in 2017—which makes the large wage hikes sought by the longshoremen in their brief strike at the beginning of October look far less extravagant.
In every scenario, however, what we are confronting is not merely an increase in prices but a distortion of prices.
If wages rose the same as consumer prices in every period we would not be cognizant of inflation, for we would be required to expend the same amount of labor to pay for food, for shelter, and for any other goods or services we were of a mind to purchase.
If the price of chicken rose by the same amount as the price of beef, we would not feel economic pressure to consume more of the one meat and less of the other. If the price of meat in general rose by the same amount as the price of other foods, we would not feel economic pressure to alter eating habits to consume less meat.
If all prices, including that for labor, rose by the same amount and fell by the same amount over the same time frames, we would not spend nearly as much effort attempting to quantify and comprehend inflation.
As is all too obvious, prices do not rise and fall by the same amount as other prices. Consumer prices do not rise and fall by the same amount as labor prices, and the price of beef does not rise and fall by the same amount as the price of milk.
Because prices do not rise and fall in unison, inflation invariably ends up compelling us to devote more of our scarce labor towards certain goods and services, and that leaves less of our scarce labor with which to secure other goods and services. Even if there is still overall increase in economic output, the composition of that output is changed by inflation. It is hard to view such changes as a net positive when they are effectively being forced on the economy by the distortions of inflation.
As I have said before, inflation means consumers pay more and buy less. Inflation also means that workers work more and consume less.












This post provides some helpful perspective. Also need to recognize the inherent difficulties in measuring consumer prices over time. BLS tells us that they base prices on a sample of places people actually purchase goods. So, for example, as the neighborhood grocer is replaced by Costco, prices appear to decrease because Costco is on average cheaper than the neighborhood grocer. But the difficulty the consumer faces, having to travel a longer distance to make purchases, isn't recognized.
Similarly, over here in wokeville, we now have to pay an extra fee to get bags for our groceries. BLS tells us that this fee isn't included in the Consumer Price Index, and in fact cannot be because BLS cannot know how many bags will be needed.
Everyone should read this. EVERYONE.