Is Inflation Still Everywhere A Monetary Phenomenon?
Why Raising Rates Further Will Not Bring Down Inflation
Probably no economist has been more impactful on American economic thought than Nobel laureate Milton Friedman. His monetarist views rival those of Maynard Keynes for their lasting impact and influence.
In particular, Friedman is noted for his views on inflation as a consequence of money supply mismanagement1.
Inflation is always and everywhere a monetary phenomenon.
This is the principle behind the Fed’s dogged insistence that the solution to inflation is to keep raising interest rates until something breaks.
How does this principle stand up under scrutiny? Let’s find out.
Before we examine the data on inflation and the money supply, we must first make note of how Friedman defined inflation2.
By inflation, I shall mean a steady and sustained rise in prices
This, of course, is merely a succinct phrasing of the classic and accepted view of inflation which we use today3.
Inflation is a rise in prices, which can be translated as the decline of purchasing power over time. The rate at which purchasing power drops can be reflected in the average price increase of a basket of selected goods and services over some period of time. The rise in prices, which is often expressed as a percentage, means that a unit of currency effectively buys less than it did in prior periods. Inflation can be contrasted with deflation, which occurs when prices decline and purchasing power increases.
Within this accepted view of inflation there is an implicit presumption that the rate of monetary growth correlates to the rate of inflation. From that presumption it necessarily follows that the way to reduce inflation is to reduce the rate of monetary growth by tinkering with interest rates. Accordingly, the monetary policy of the Federal Reserve is built around interest rate manipulation in order to control money supply growth, and thus, inflation4.
A country’s financial regulator shoulders the important responsibility of keeping inflation in check. It is done by implementing measures through monetary policy, which refers to the actions of a central bank or other committees that determine the size and rate of growth of the money supply.
In the U.S., the Fed's monetary policy goals include moderate long-term interest rates, price stability, and maximum employment. Each of these goals is intended to promote a stable financial environment. The Federal Reserve clearly communicates long-term inflation goals in order to keep a steady long-term rate of inflation, which is thought to be beneficial to the economy.
However, we run into problems when we examine the rates of growth in the money supply vs the rate of inflation—particularly as measured by the Consumer Price Index, that being the most widely accepted price level metric in the United States, and, therefore, the most widely accepted measure of inflation5. Simply put, the rate of money growth in the US does not track with the rate of inflation in the US, nor has it extending as far back as 1900.
When we look at the percentage year on year changes in the Consumer Price Index from 1960 onward we see inflation has been quite a bit more colorful than a simple and mundane “steady and sustained rise(s) in prices”. If we consider the timeline, we immediately recognize seminal events such as the oil embargoes of the 1970s, Saddam Hussein’s 1990 invasion of Kuwait, and, of course, the Great Financial Crisis in 2007-2009.
Straight away we can see, just from the history of major world events that played a role in moving inflation up and down, that price movements are catalyzed by a wide variety of factors. This alone might appear to contradict Friedman’s thesis that inflation is a monetary phenomenon. Indeed, if we consider inflation alongside changes in the growth rate for the money supply—the accepted chief villain when it came to inflation—we immediately see significant structural problems between the data and accepted view of the relationship between money and inflation.
When we overlay percentage year on year growth rates for the monetary base6 in the US, we get this.
Given the surge in base money supply during and immediately after the Great Financial Crisis and accompanying recession, without a corresponding uptick in inflation, we are faced with a challenge reconciling the data to the accepted monetary view of inflation present at the Federal Reserve. In this accepted wisdom, as money supply growth increases, prices generally increase; as money supply growth declines, prices generally fall.
Only, as we can see, they don’t.
Nor does price growth follow money supply growth when we overlay M17 money supply data.
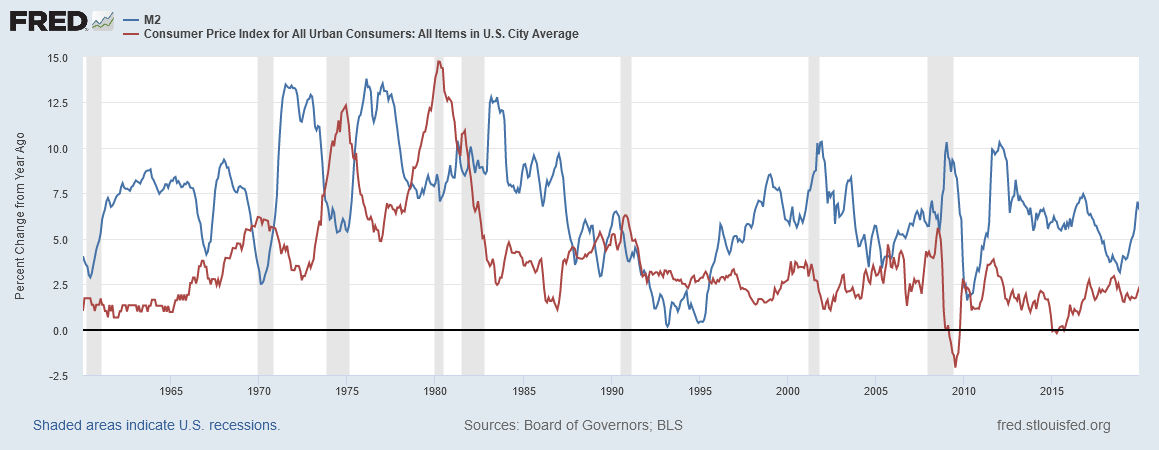
We see the same problem again when we overlay M28 money supply data.
The correlation between each of these money supply growth metrics and consumer price inflation is, at best, tenuous. Prices simply have not risen and fallen in concert with changes in the money supply.
We confirm this by calculating the correlation coefficients for the various money supply metrics vs consumer price inflation for the period 1960-20199.
Low positive correlations and negative correlations challenge the presumption that money supply growth ties to price growth. This accepted view of inflation and money supply growth requires a reasonably strong positive correlation, and we do not see it when we compare the data on money supply growth with inflation.
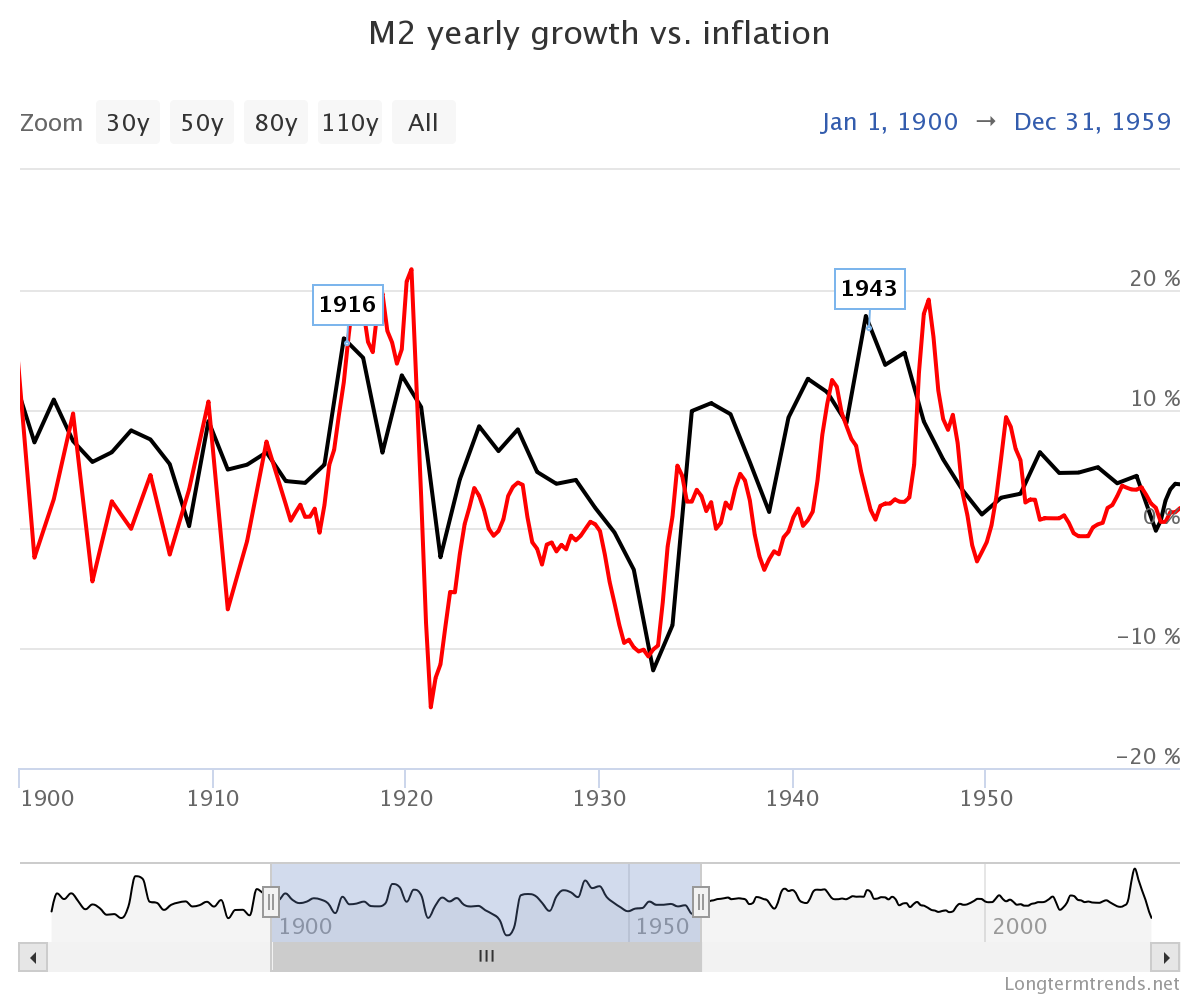
Nor is this a particularly new phenomenon. If we look at the growth rate of the M2 money supply in the United States vs the consumer price inflation rate between 1900 and 1959 (prior to the data available from the Federal Reserve FRED system, assembled courtesy of Longtermtrends), while there is a somewhat stronger correlation between the M2 and inflation, it is still rather problematic.
The correlation appears to be stronger if we focus on the period prior to WW2 (i.e., 1900 to 1939).
However, from 1940 to 1959, the relationship between money supply growth and inflation breaks down considerably.
If we calculate the correlation coefficients for these periods, we see that the pre-war period does have a stronger correlation between money supply growth and inflation than the post-war period, or the overall period from 1900 through 1959, but even in the pre-war period the strength of the correlation left a lot of room for factors besides money supply growth to weigh in on inflation.
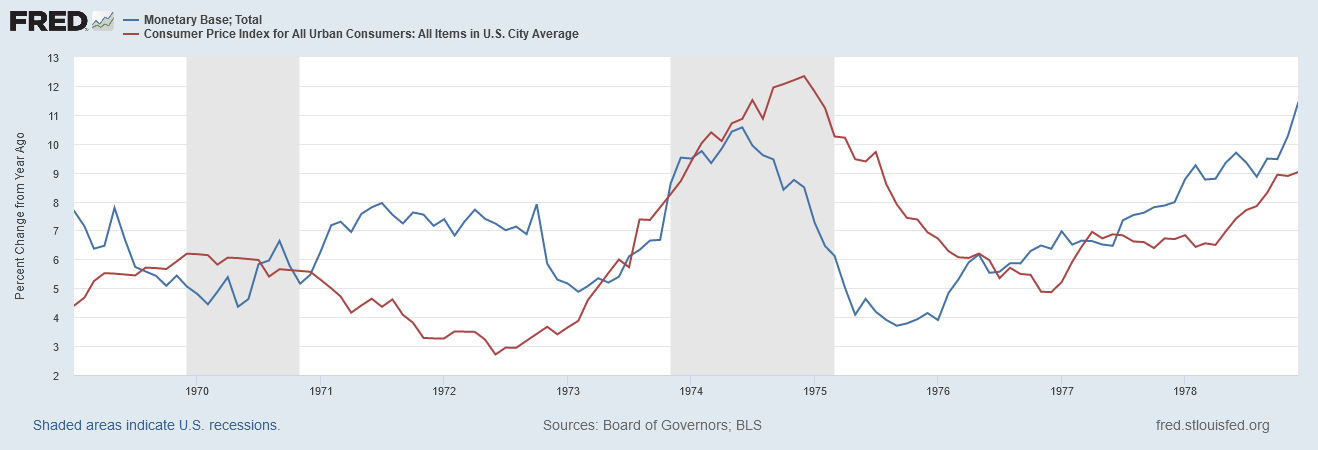
Nor does the correlation conundrum get any better when we look at the decade just before the Volcker Recessions of the early 80s. If we compare the growth rate of the monetary base, the M1 money supply, and the M2 money supply, to the consumer price inflation rate between 1969 and 1978, a very problematic relationship between money supply growth and inflation is presented.
For the M1 and M2 money supply, the correlation between money supply growth and inflation was actually negative during this period.
Moving forward a decade doesn’t help much either. Repeating the same comparisons for monetary base, M1, and M2 against consumer price inflation from 1979 through 1988 gives us equally problematic graphs and correlation coefficients.
As much as Volcker’s efforts to restrain the pace of money supply growth are credited with reining in the hyperinflation of the 1970s, there is simply no indication in the historical data that this is the case. The correlations that view of Volcker’s interest rate hikes demands simply are not found in the historical data.
To apprehend where the accepted wisdom of the Federal Reserve goes off the rails, we need to recall Friedman's observations of the experience of India with inflation during the 1950s10:
There is one interesting feature about the above figures worth noting. In both periods, the price movement was larger than the discrepancy between the movement in money and the movement in real output. In order to simplify the comparison, let us stick for the moment to the money supply as defined by the Reserve Bank, namely, currency plus demand deposits. In the first Five Year Plan period, it rose by 11 per cent, real output rose by 18 per cent and the difference is 7 per cent. This is the amount of decline in prices that would have occurred if people had continued to hold the same amount of money expressed in terms of their income throughout the period. While this difference is 7 per cent, prices in fact—and again to keep the discussion simple I shall stick to just one index number, the implicit price-index—fell by 12 per cent, or by more than the 7 per cent decline in the stock of money relative to output. In the second Five Year Plan period, money supply rose by 33 per cent, output by 21 per cent; the difference is 12 per cent. Prices, according to the implicit price index, rose by 17 per cent and by much more according to the other indices. In other words, movements in the velocity of money circulation exaggerated the effect of the behaviour of the stock of money itself.
Put simply, Friedman discounted any notion of a direct correlation between growth rates of inflation vs money supply. By including the influence of money velocity—a factor the Federal Reserve completely ignores—Friedman eliminated the possibility that any strong correlation could be found between money supply growth and inflation.
Which is exactly what the data shows.
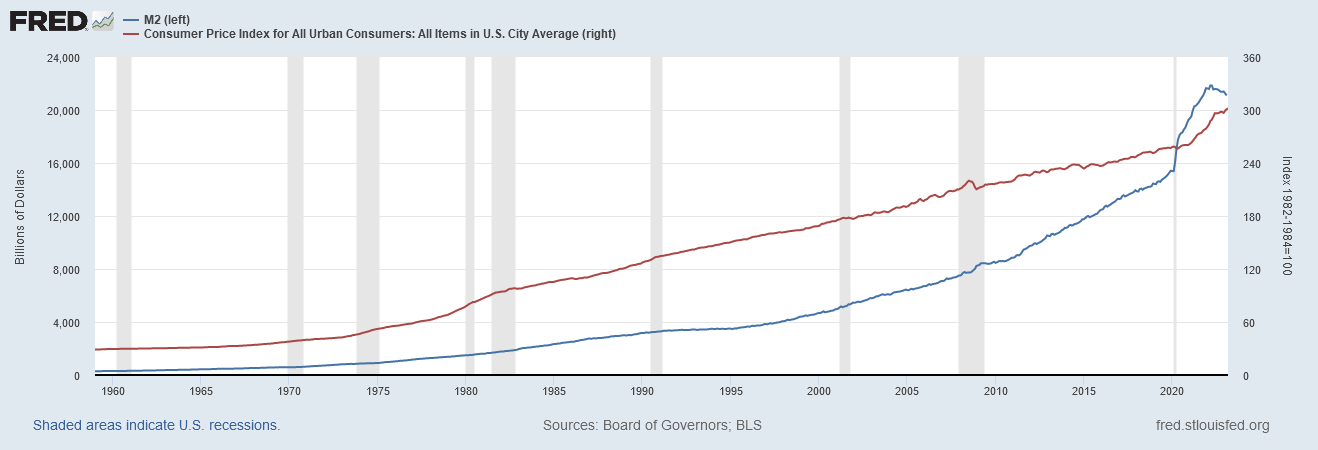
On the other hand, if we compare the broad M2 money supply with the Consumer Price Index itself, we see a relatively strong correlation.
We see stronger correlations with the Consumer Price Index for both the monetary base and the M1 money supply metrics as well.
This is the relationship between money supply and prices Friedman asserts is controlling. The supply of money in an economy defines the price level in that economy.
However, this is not the relationship Jay Powell and the economists at the Federal Reserve infer. Rather, their monetary policies presume a relationship between money supply growth and inflation, which is not the case and which Friedman does not assert to be the case. Indeed, owing to the concurrent influence of money velocity, it is not possible to establish a clear correlation between money supply growth and inflation. Velocity becomes a confounding factor that invariably disrupts all such calculations.
We know that the Fed’s view of inflation is tied to money supply growth, for the simple reason that Volcker’s plan of attack in 1979 was to target the growth of money in the US, in the stated hope that reducing money supply growth would bring down consumer price inflation11.
“By emphasizing the supply of reserves and constraining the growth of the money supply through the reserve mechanism, we think we can get firmer control over the growth in money supply in a shorter period of time,” Volcker told the assembled reporters. “But the other side of the coin is in supplying the reserve in that manner, the daily rate in the market…is apt to fluctuate over a wider range than had been the practice in recent years” (Federal Reserve Bank of St. Louis 1979a).
As a result of the new focus and the restrictive targets set for the money supply, the federal funds rate reached a record high of 20 percent in late 1980. Inflation peaked at 11.6 percent in March of the same year. Meanwhile, the new policy was also pushing the economy into a severe recession where, amid high interest rates, the jobless rate continued to rise and businesses experienced liquidity problems. Volcker had warned that such an outcome was possible soon after the October 6, 1979, FOMC meeting, telling an ABC News program that “some difficult adjustments may lie ahead,” (Federal Reserve Bank of St. Louis 1979b). With the economy now facing a recession, it is perhaps not surprising that the Fed came under widespread public criticism.
To target then constrain money supply growth, Volcker pushed interest rates up, with the idea that would restrain inflation. However, as I have detailed previously, the rise and fall of both interest rates and inflation during Volcker’s tenure as Fed Chair do not support his thesis.
In fact, when we set the Consumer Price Index and various US Treasury interest rates to a common baseline index, we see that the general downward trend in interest rates since the 1980s has had little or no impact to the trend in the CPI.
One reason why Volcker’s rate hikes did not have the expected impact is the simple fact that, despite his stated intentions, Volcker’s approach did not exert a consistent constraint on money supply growth.
The monetary base rate of growth rose during the first Volcker Recession before declining in between the two recessions, and then began rising at the start of the second Volcker Recession, continuing to rise until 1987. The M1 rate of growth had been trending down before the first Volcker Recession, dropped significantly before rising in between the two recessions, dropped sharply at the start of the second recession before rising and, overall trending up also through 1986. The M2 rate of growth trended up throughout both recessions before beginning a downward trend in 1984.
Overall, the rates of money supply growth for all three metrics had been declining for at least a year prior to Volcker’s first interest rate hike in October of 1979. A sustained decline in the growth rate of the money supply across all three metrics would not happen until 1987.
That was not the effect Volcker was intending to create in money supply growth. His actions added no new constraints or inhibitions on money supply growth.
In essence, Volcker was wrong twice. He was wrong that raising interest rates would reliably constrain money supply growth and he was wrong that constraining money supply growth would reduce inflation.
Ironically, Friedman himself predicted Volcker’s essential failure some 10 years prior, in a 1967 presentation where he highlighted two things monetary policy cannot do12:
From the infinite world of negation, I have selected two limitations of monetary policy to discuss: (1) It cannot peg interest rates for more than very limited periods; (2) It cannot peg the rate of unemployment for more than very limited periods
Interest rate manipulations are, in Friedman’s view, ultimately counterproductive. Certainly Jay Powell’s frustrations with his extended program of interest rate manipulations offers a strong confirmation that Friedman is correct in this.
Another proof of the impotence of raising interest rates against inflation can be found in the relative intransigence of core consumer price inflation (the CPI less food and energy) in the face of repeated interest rate hikes over the past year.
If we examine consumer price inflation from the beginning of 2021 onward, we see that core inflation largely plateaued around 6% just before the Fed started raising rates in March of last year. Headline inflation, with the far more volatile food and energy components included, continued to climb and then began declining, and has since come down almost by half.
With core inflation having ticked up a notch in March of this year, we can see that the Fed’s year-long interest rate hike campaign has had little influence on core inflation, which has remained within a band around 6% ± 0.5% throughout the Fed’s period of raising the federal funds rate. If interest rates truly had a constraining effect on inflation, this plateau should not have happened; even if one wished to impute a lag effect between an interest rate hike and its ultimate influence on inflation, there still should not be a plateau such as we see.
Interest rates haven’t brought inflation down because interest rates can’t bring inflation down. They didn’t in the 1980s and they aren’t now. Interest rates just don’t do that. As both current and historical data shows, there isn’t a strong correlation between interest rates and inflation. Contrary to Volcker’s thinking—contrary, therefore, to Jay Powell’s thinking today—and very much in line with Friedman’s thinking, the correlation is between prices and money supply, not the rates of change in each.
Inflation is still very much a monetary phenomenon—and that is exactly why the Fed’s interest rate strategy was always doomed to fail.
Friedman, M. “Inflation: Causes and Consequences. First Lecture.” Dollars and Deficits, Prentice Hall, 1968, pp. 21–46. Retrieved online from https://miltonfriedman.hoover.org/internal/media/dispatcher/271018/full
ibid.
Fernando, J. “Inflation: What It Is, How It Can Be Controlled, and Extreme Examples”, Investopedia. 14 Mar. 2023, https://www.investopedia.com/terms/i/inflation.asp.
ibid.
While proponents of the ShadowStats alternative measures of inflation argue with conviction that the CPI systematically understates actual consumer price inflation in the US, the mechanics of economist John Williams’s recalculation of price levels and inflation explicitly addresses changes in how the CPI is calculated since the mid-1980s, and in particular since structural changes in the CPI from the mid-1990s. As I demonstrate in this article, the non-alignment between money supply growth and inflation predates those changes, and thus we cannot resolve the seeming discrepancies by relying on Williams’s alternative inflation metrics.
The monetary base: the sum of currency in circulation and reserve balances (deposits held by banks and other depository institutions in their accounts at the Federal Reserve).
M1: the sum of currency held by the public and transaction deposits at depository institutions (which are financial institutions that obtain their funds mainly through deposits from the public, such as commercial banks, savings and loan associations, savings banks, and credit unions).
M2: M1 plus savings deposits, small-denomination time deposits (those issued in amounts of less than $100,000), and retail money market mutual fund shares. Data on monetary aggregates are reported in the Federal Reserve's H.3 statistical release ("Aggregate Reserves of Depository Institutions and the Monetary Base") and H.6 statistical release ("Money Stock Measures").
Correlation coefficients were calculated using the statistical functions of LibreOffice Calc 7.4.0.3 (x64).
Friedman, M. “Inflation: Causes and Consequences. First Lecture.” Dollars and Deficits, Prentice Hall, 1968, pp. 21–46. Retrieved online from https://miltonfriedman.hoover.org/internal/media/dispatcher/271018/full
Medley, B. Volcker’s Announcement of Anti-Inflation Measures. 22 Nov. 2013, https://www.federalreservehistory.org/essays/anti-inflation-measures.
Friedman, M. “The Role Of Monetary Policy.” American Economic Review, vol. 58, no. 1, 1968, pp. 1–17.











Good topic, and you’ve raised aspects of money supply vs money supply growth that I haven’t considered before. So, a confounding mystery to me is how have the quantitative easing since 2009 and the weirdness of spending like drunken sailors (and calling it Modern Monetary Theory) affected the relationship between interest rates and monetary policy?