

May PPI: Stagflation Or Just Inflation?
What Is The Producer Price Index Trying To Tell Us?

What should we make of the May Producer Price Index Summary? Is the data warning that we are heading into a perfect storm of stagflation and economic pain?
The May PPI report presents the latest indicator that not only is inflation rising in this country, but also that it is likely to continue to rise for at least a few months more.
At a minimum, the risks of a fresh hyperinflation cycle are growing, given that producer price inflation rose significantly in May.
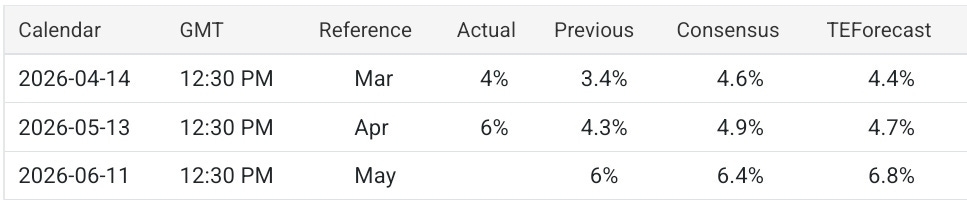
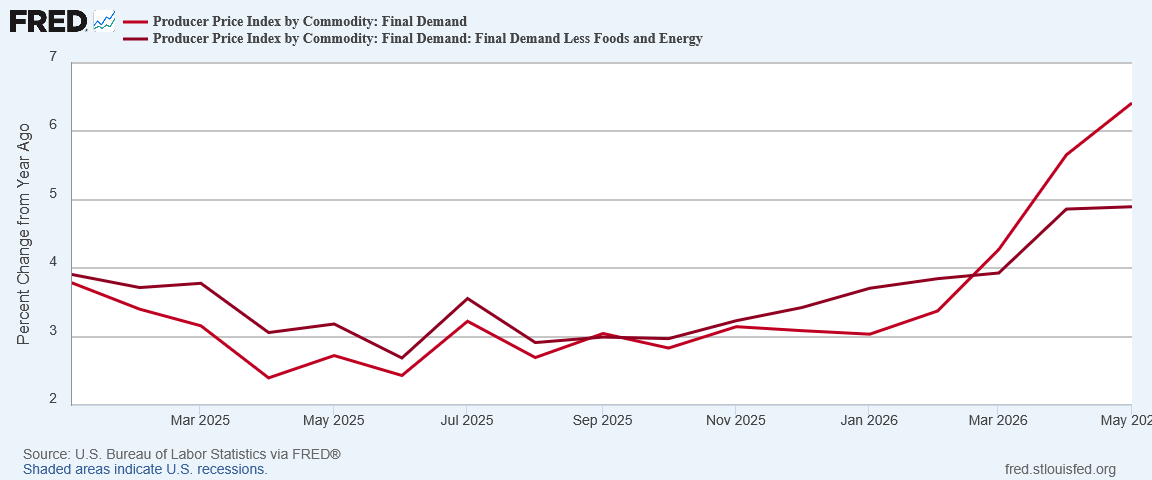
The Producer Price Index for final demand rose 1.1 percent in May, seasonally adjusted, the U.S. Bureau of Labor Statistics reported today. Final demand prices advanced 1.1 percent in April and 0.7 percent in March. (See table A.) On an unadjusted basis, the index for final demand increased 6.5 percent for the 12 months ended in May, the largest 12-month rise since moving up 7.4 percent in November 2022.
Not only was the 6.5% increase the largest year on year increase since the 2022 hyperinflation cycle, it was also above Wall Street’s projections (although it printed below the Trading Economics forecast).
Of course, there is no real mystery behind the inflation surge: the immediate cause is the disruption of Persian Gulf oil flows by Iran’s illegal closure of the Strait of Hormuz. While the cause is known, however, the ultimate consequence is much less certain.
If the Strait remains closed for a number of months, oil prices are projected to rise much higher, injecting 1970s-style stagflation into virtually all the world’s economies.
If there is a peace deal with Iran and a reopening of the Strait, Persian Gulf oil flows might begin to recover, and stagflation might be avoided.
The key word in both scenarios: “if”. The Producer Price Index is telling us that more inflation and possibly stagflation is on the way. It is not telling us just yet how bad either one will be.
The Month To Month Rise Was Unexpected
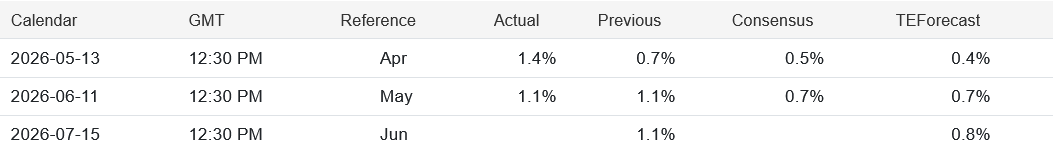
Wall Street and corporate media were caught off guard not by the rise in producer price inflation year on year, which printed just 0.1pp above projection, but by the month on month gain of 1.1%.
Wall Street had been expecting a month on month rise of 0.7%.
Clearly, Wall Street was disappointed.
The miss was large enough that CNBC found that to be the most notable aspect of the PPI report itself.
The producer price index, a measure of final demand costs, increased a seasonally adjusted 1.1% on the month, putting the 12-month wholesale inflation rate at 6.5%. Economists surveyed by Dow Jones had been looking for a monthly move of 0.7%.
CNN was similarly impressed by the month on month figure.
To their credit, corporate media remained largely factual in their reporting of the PPI, a departure from their gaslighting and foolishness over the CPI report a day earlier.

A long-held presumption with some historical validity is that the Producer Price Index gives visibility into what consumer price inflation is going to do over the next few months. A larger-than-expected rise in the PPI to 6.5% year on year indicates that consumer price inflation itself is highly likely to rise even more from 4.2% year on year over the summer at least.
How much more inflation are we likely to see? The data is far less clear on that point.
Headline PPI Inflation, Core PPI Disinflation
In a repeat of the May CPI print, the month on month inflation figure for headline PPI increased slightly, while the month on month figure for core PPI decreased.
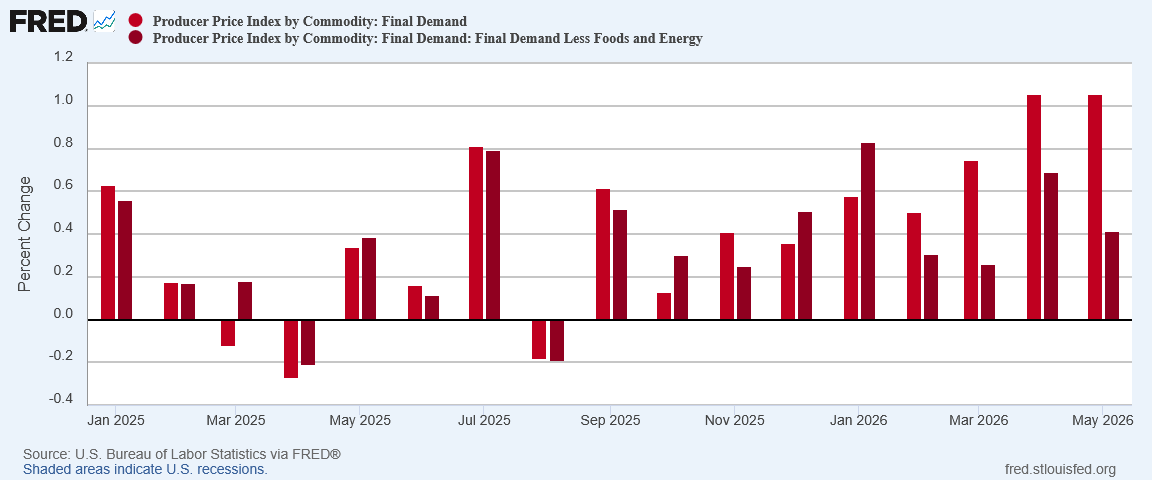
Even the year on year print showed a different trend for the core figure than the headline figure.
Core PPI showed disinflation month on month, and almost no change year on year.
While headline inflation did rise month on month, we should also note that the increase was marginal. When we look at the Producer Price Index itself, we see the headline PPI increasing April to May in very close to linear fashion, but core PPI slowing noticeably.
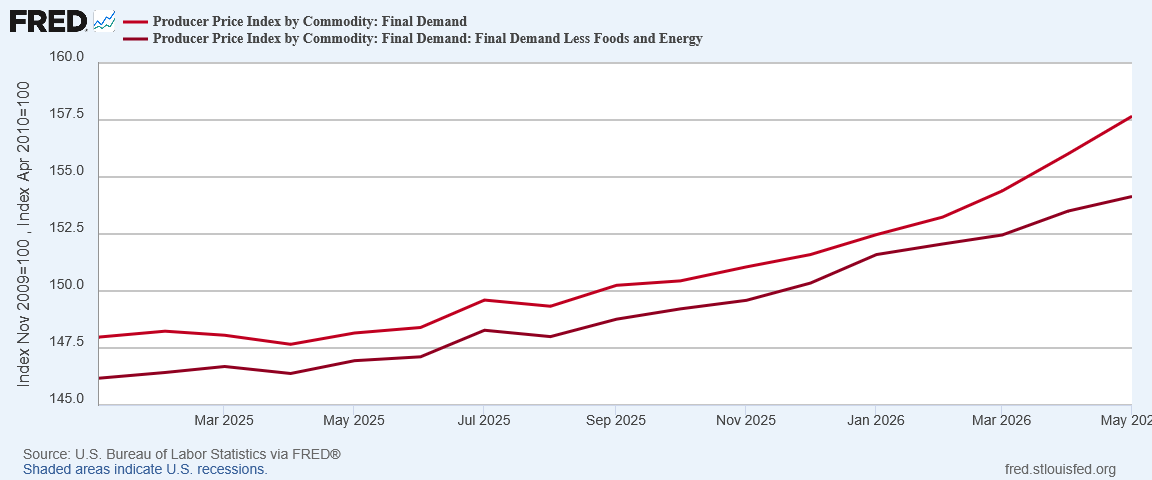
Indeed core PPI and headline PPI have been diverging since January, and the spread between the two indices is larger now than it has been since President Trump took office in January 2025.
The signature difference between the headline and core data, of course, is the inclusion of energy data in the headline index, and the exclusion of it from the core index.
Arguably, we are seeing headline inflation continuing as it has been for the past few months, but core inflation continuing print slower and lower numbers each month.
Is that a forecast for more energy price inflation but with very little contagion affect? That is certainly one interpretation, and a plausible one.
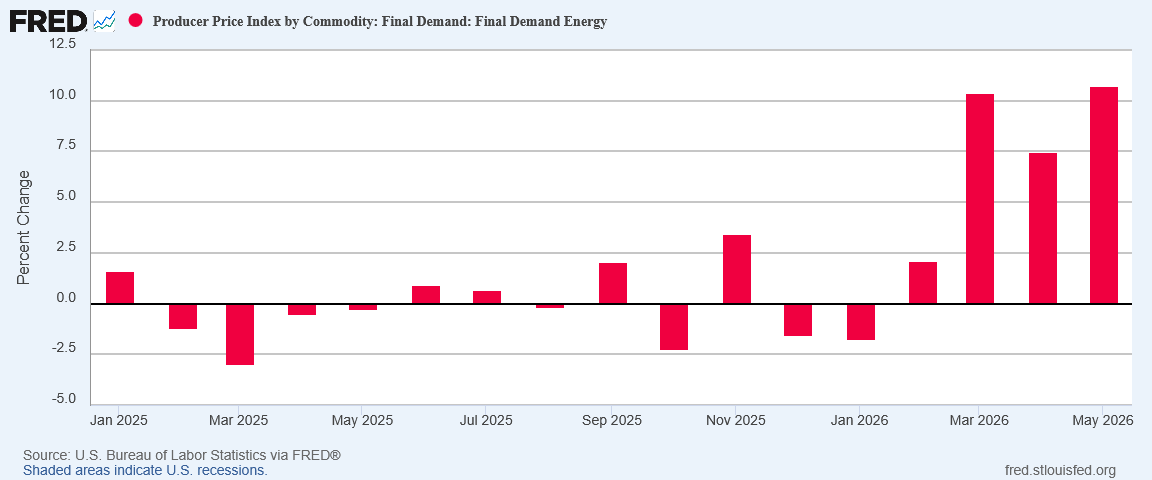
No Surprise Here: More Energy Price Inflation
That energy price inflation increased within the PPI is hardly surprising.
Somewhat surprising, however, was the continued deflation for unprocessed fuel.
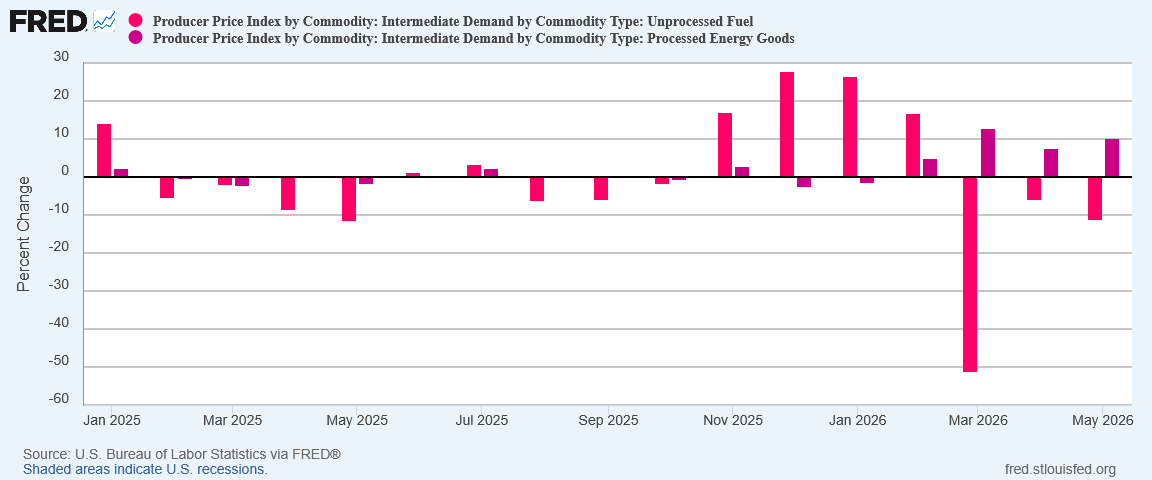
Meanwhile, processed fuels felt some price pressure and moved up.
Even more surprising is that retail fuel costs declined in May.
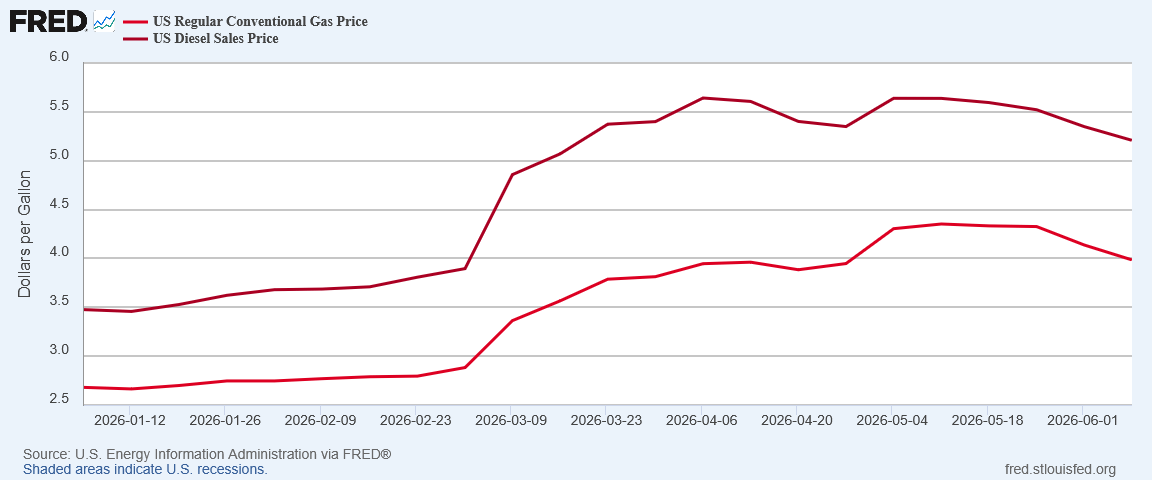
This is in line with the behavior of benchmark oil prices, which, as I noticed in discussing the CPI report, also declined in May.
Yet if oil prices declined, and retail fuel prices declined, what is pushing energy prices up?
Goods Prices Once Again Driven By Energy
Goods prices rose substantially in May, pushed up to 2.8% month on month.
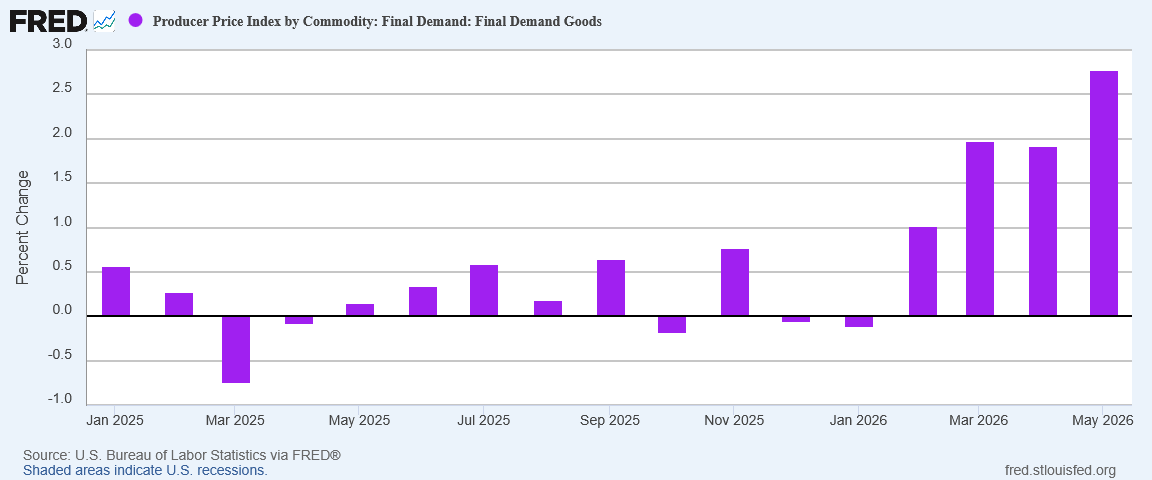
However, just as with the CPI print, there’s no mystery as to the cause—energy price inflation. Putting goods and energy side by side makes that self-evident.
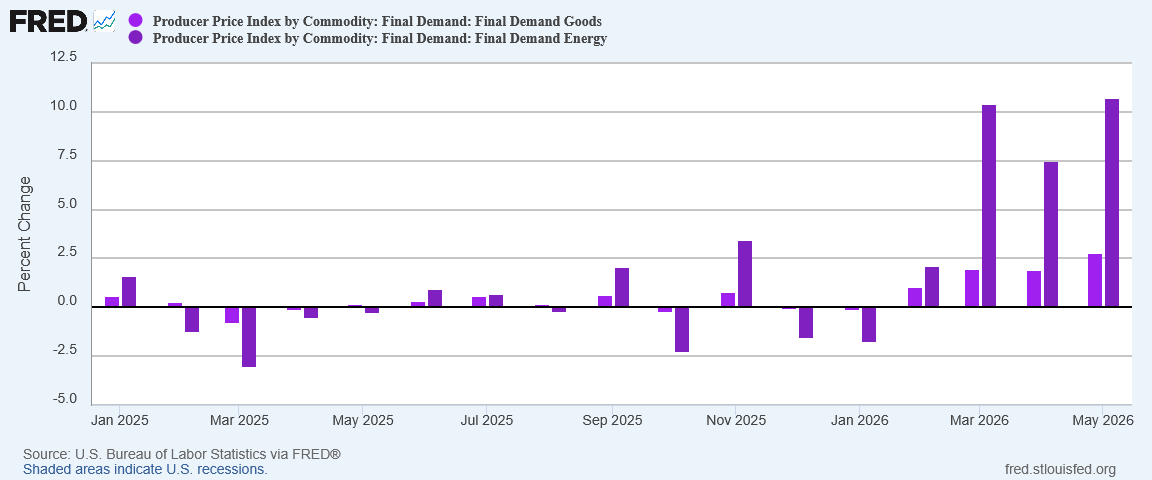
If we strip food and energy prices out from goods prices, we see a much smaller increase.
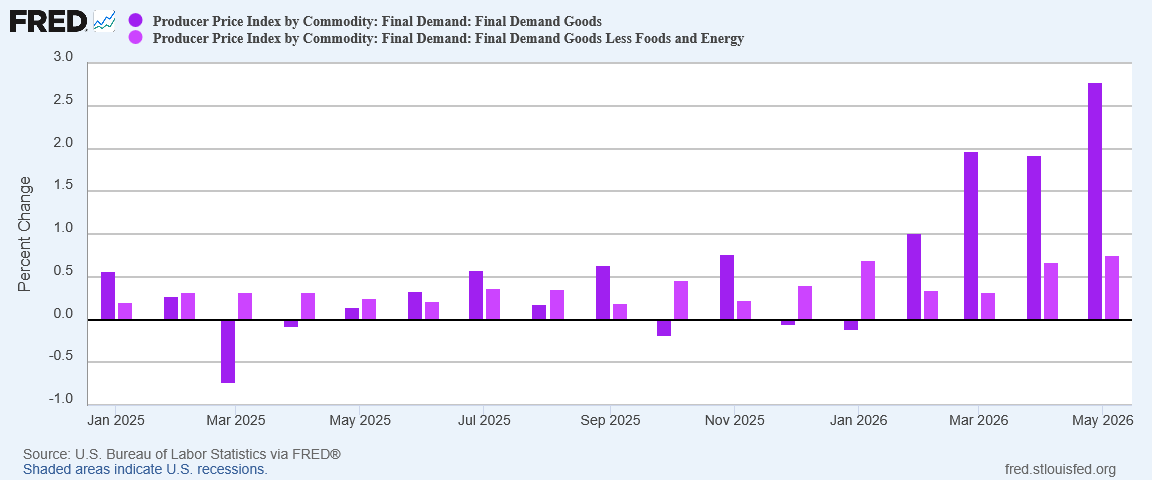
Just as with the CPI, the PPI is signaling inflation for energy goods, but not for other types of goods. The potentials of a contagion effect, where inflation spreads throughout the economy, do not appear to be on the horizon just yet.
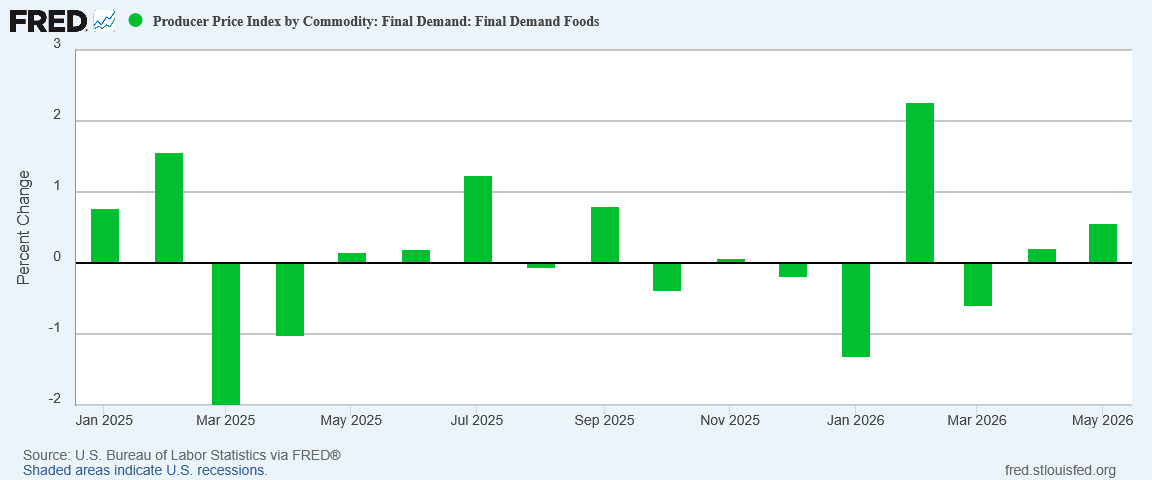
Food Price Inflation Coming?
We should note that food price inflation itself did rise somewhat, although the primary increase within the PPI has been due to energy prices.
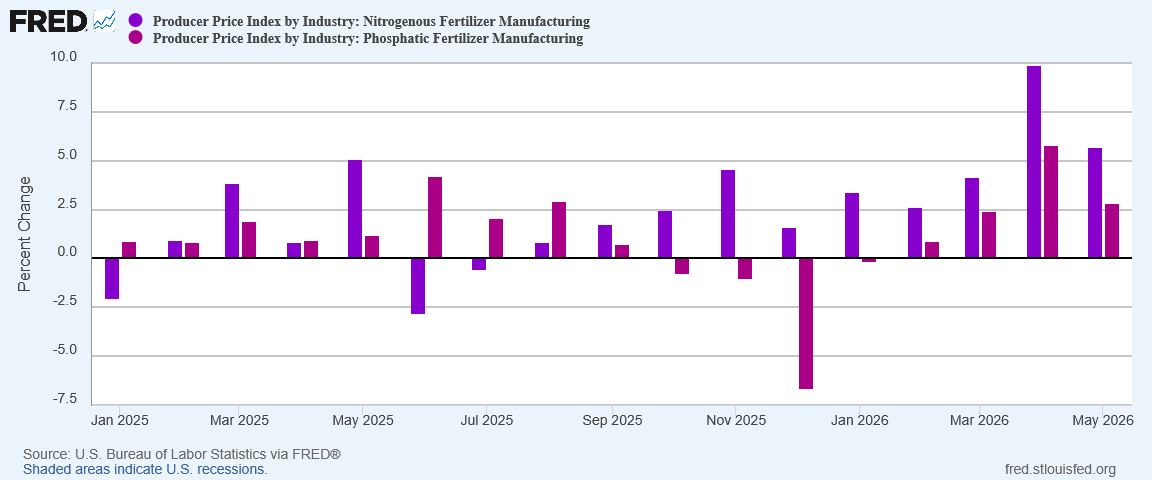
The lack of food price inflation may not last, however. Nitrogenous fertilizer prices have been rising since early 2025.
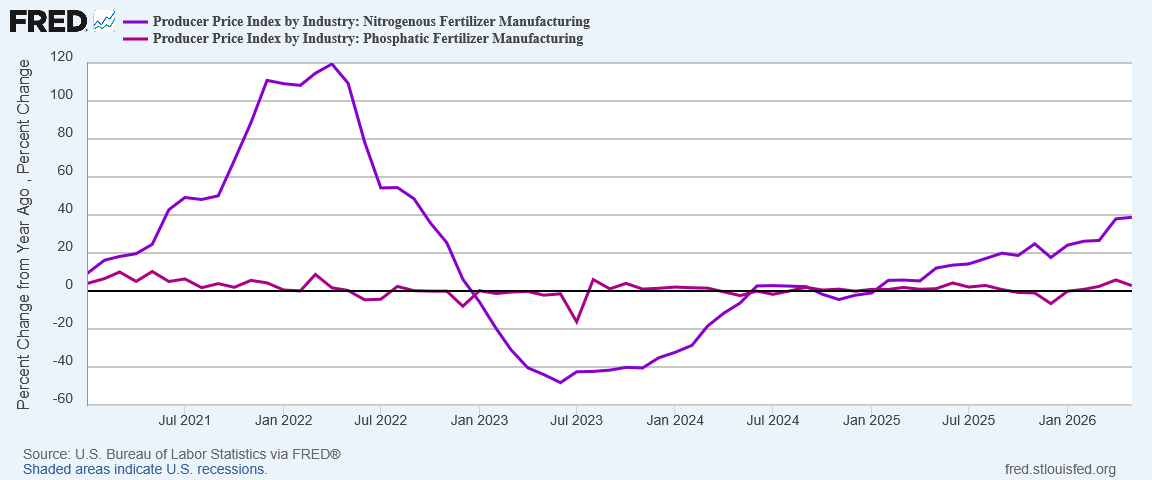
While month on month May’s increase was not as large as April’s, we are still watching fertilizer become more and more expensive over time.
Fertilizer is essential to high crop yields, obviously. If fertilizer prices increase enough to impact fertilizer usage in agriculture, we can reasonably expect food prices to rise some time thereafter, as harvests come in.
Rising nitrogenous fertilizer prices indicates that at least some food price inflation will begin to show up in the not too distant future. It might not be a whole lot but some food price inflation is coming.
Intermediate Demand Rising
The one ominous data within the Producer Price Index Summary remains the intermediate demand data set.
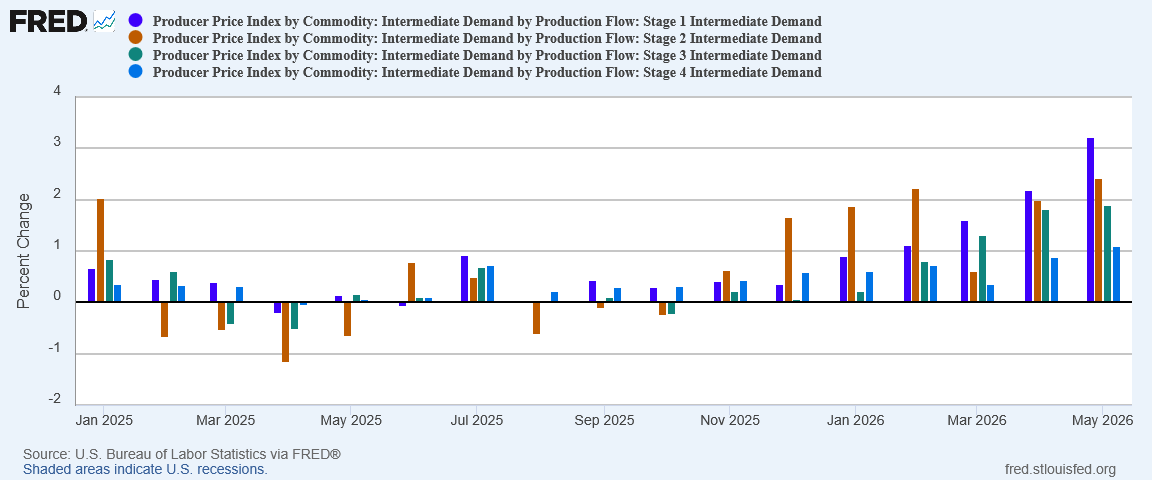
Producer price inflation for Stage 1 Intermediate Demand in particular has been rising steadily since last fall. Stages 2 and 3 have been right behind.
This is producer price inflation within the supply chain. Rising inflation within Intermediate Demand indicates that goods which are used to produce other goods are becoming more costly. Eventually, these inflationary price pressures have to result in higher prices for items.
Rising inflation within Intermediate Demand is a forecast that goods prices are poised to increase. They may not increase next month or the month after, but increased costs of inputs eventually will result in higher prices for various items.
Will It Be Stagflation?
The Producer Price Index Summary is telling us that there will be quite a bit more inflation, and specifically energy price inflation. Consumer price inflation is not done rising.
Will it simply be inflation, perhaps hyperinflation? Will it be stagflation?
The PPI is not going to answer that for us, because it can’t. To answer that question we have to look outside the data, at the underlying drivers of that data.
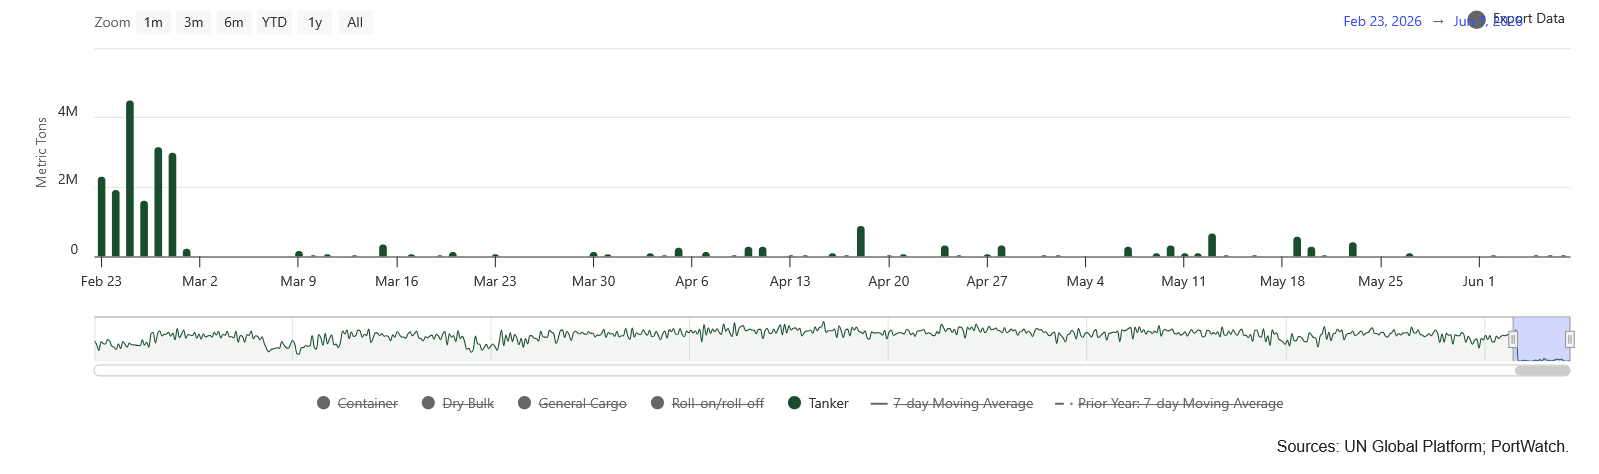
It is already well established that the catalyst for recent increases in both producer price and consumer price inflation has been the disruption of Persian Gulf oil flows. That disruption is ongoing, as IMF Portwatch data on oil volumes moving through the Strait shows.
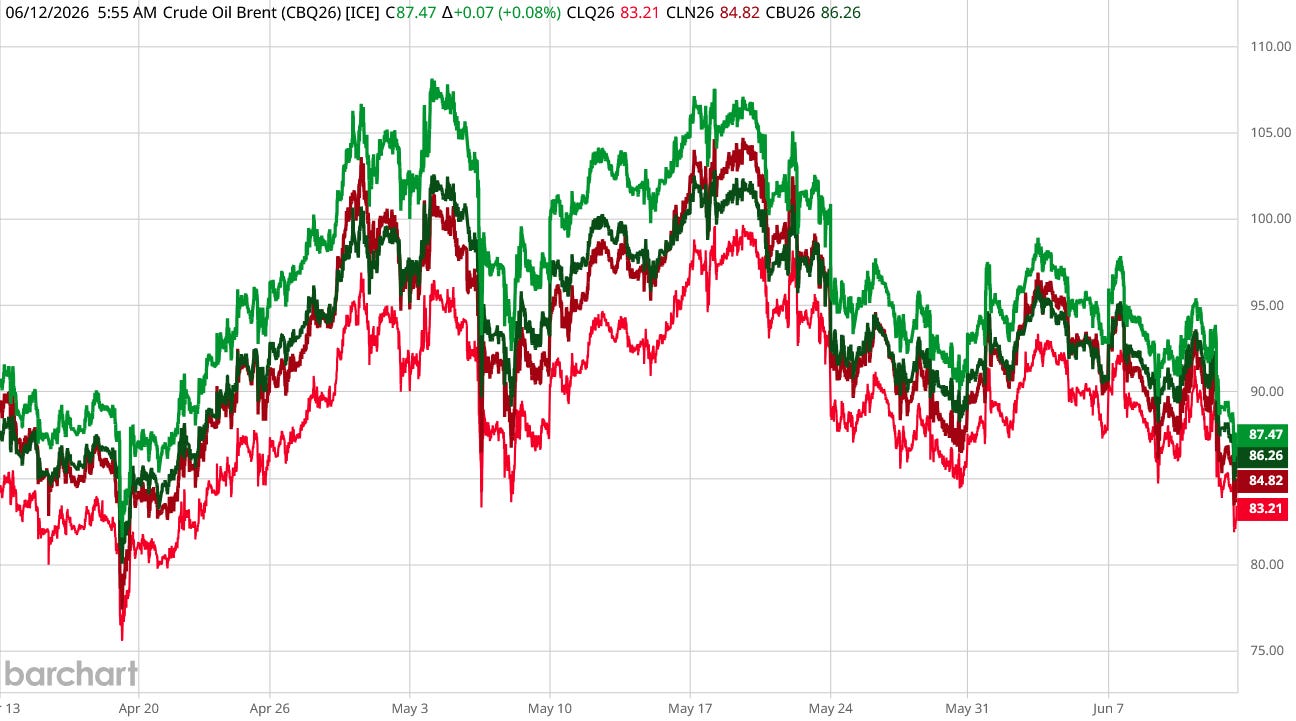
Despite the loss of some 20% of global oil supply, oil prices have stabilized and even moved down slightly since the start of the “ceasefire” around April 13.
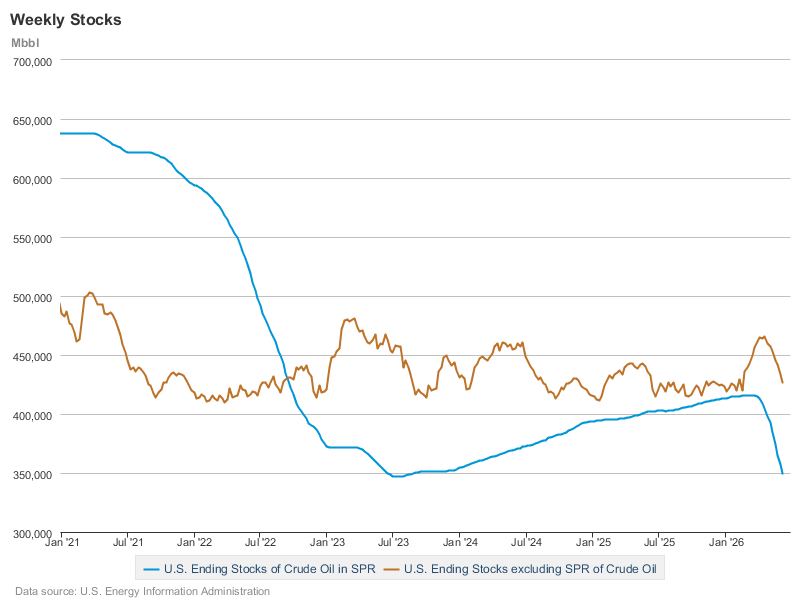
Arguably, this decline in benchmark crude oil prices is due in part to the releases by multiple nations from their strategic petroleum reserves. We can see, for example, that US oil inventories, both commercial and the SPR, have dropped near lows last seen during and after the 2022 hyperinflation cycle.
At the same time, China has reduced its imports of oil to a 10-year low.
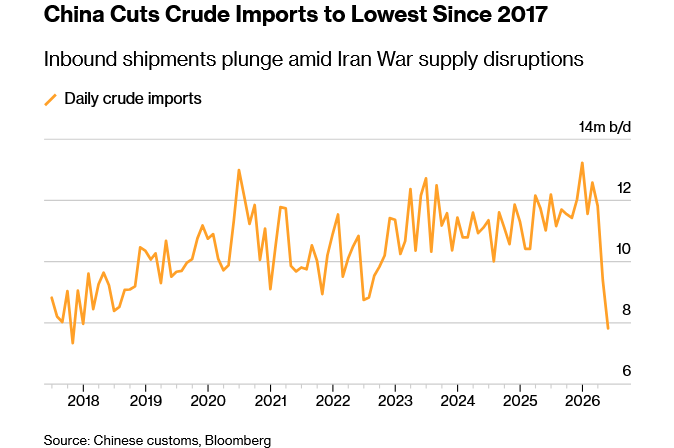
Some of China’s import reductions were inevitable; a large portion of China’s oil imports come from the Persian Gulf and are now cut off. What is notable, however, is that China is not replacing Persian Gulf oil imports with imports from other regions. Instead, China is leveraging its own internal oil reserves to satiate its demand for oil.
The world’s biggest crude importer has leaned on export curbs, refinery run cuts and drawdowns from its massive inventories to cope with the impact of the loss of most Persian Gulf barrels. This has helped ease pressure on global prices, with analysts estimating China’s imports could remain subdued for months to come.
In terms of physical oil volumes, the global economy has managed to replace Persian Gulf oil with reserves held around the world. That immediately begs a simple question: when will those reserves be exhausted?
Some assessments indicate the answer is “soon”, as reserves reach floor thresholds which limit or prevent further releases.
America’s releases have brought relief beyond its shores. Many SPR barrels have made their way from salt caverns in Texas and Louisiana, through commodity traders to buyers in Europe, Asia and Latin America. Yet most analysts expect the pace of deliveries to slow in the coming weeks, from 1.4m to below 1m b/d. Pressure is dropping in the caverns, which risk damage if it gets too low. Bayou Choctaw, the smallest site, is nearly depleted, says Kevin Book of ClearView Energy Partners, a consultancy; others cannot pump more fast enough because of limited pipeline capacity. And the entire SPR has a statutory floor of 150m barrels, just 90m barrels below the level at the end of the current release.
Strategic reserves are finite quantities of stored oil by definition. Once they are depleted they are gone. When the world is no longer able to replace Persian Gulf oil with reserves, if the Strait is still closed and Persian Gulf oil flows are still blocked, the resulting oil supply shock will both drive up oil prices and compel destruction of oil demand.
As I have discussed at length previously, this is a stagflation scenario.

When prices rise because of an abrupt drop in supply—a supply shock, in other words—price stabilization will only be achieved when demand drops to align with the diminished supply.
Organically, the price increases achieve this demand destruction by driving marginal consumers and marginal consumption out of the marketplace. Central bank interest rate manipulations seek to achieve similar results by constraining and restricting consumption and demand by raising the cost of capital. Regardless of how the demand destruction is achieved, demand destruction is necessary to bring physical supply and physical demand back into equilibrium.
Note that when demand is reduced, an economy slips into recession.
Bringing this back to the May Producer Price Index, is the data signalling inflation or stagflation? Given the overall economic and geopolitical backdrop of ongoing war with Iran and continued closure of the Strait of Hormuz, the prognosis leans heavily towards stagflation.
This could change. As of this writing, President Trump is touting a deal that has presumably been reached with the Khamenei regime in Tehran. Current reporting is that the deal includes reopening the Strait.
If the Strait reopens, much of the stagflation scenario can potentially be averted. It will take time for oil flows to return to normal, and depending on what has happened to Persian Gulf oil production—in particular how many wells have been shut in—some production may not come back for a period of months or even years.
That would be an inflation scenario. Prices would rise in the short term, stabilize, and potentially even come down in the long term.
If the Strait does not reopen, the stagflation scenario is simply a matter of time before oil reserves are depleted and oil prices start rising.
The May Producer Price Index Summary is telling us that higher prices will come throughout the summer, that at least some inflation is already “baked in” to the economy.
Whether that inflation turns into stagflation depends entirely on whether there is peace with Iran and a reopening of the Strait of Hormuz.
2022 seems to keep popping up in comparisons and bonds provided zero stability in 2022 with huge losses - the retired without pensions like us will struggle - we’re forced early retired and sequence of returns risk is blazing it’s headlights through your honest and factual analysis. if we do end up similarly or worse than 2022, we brace and hope for a quick recovery. I am sad for the small businesses who can’t absorb or afford these increasing energy costs . Thank you for such a comprehensive explanation.
Given what I’ve heard about the fanaticism within the upper ranks of the IRGC, I don’t trust that they would adhere to any terms of a peace agreement. I suspect they will say they do, then attack the West within a few months. Peter, any thoughts you’d like to share at this point?