


I want to know what dictionary the Bureau of Labor Statistics uses for its definitions.
Whatever dictionary it is, it isn’t Merriam-Webster1, and it has a strange notion of what “unchanged” means, which is how we get the lede paragraph in the July Job Openings and Labor Turnover Summary report.

The number of job openings was little changed at 7.2 million in July, the U.S. Bureau of Labor Statistics reported today. Over the month, both hires and total separations were unchanged at 5.3 million. Within separations, both quits (3.2 million) and layoffs and discharges (1.8 million) were unchanged.
If that phrasing sounds familiar, it’s because this is how the BLS presents the JOLTS data almost every month. No matter what the shifts, the numbers are always either “little changed” or “unchanged”.
Merriam-Webster predictably defines “unchanged” as “not changed”. If there is no change, then the numbers for July should be the same as they were for June.
Is that really the case? Let’s peel back the layers of the onion and see what “unchanged” data actually look like!
There Was Change
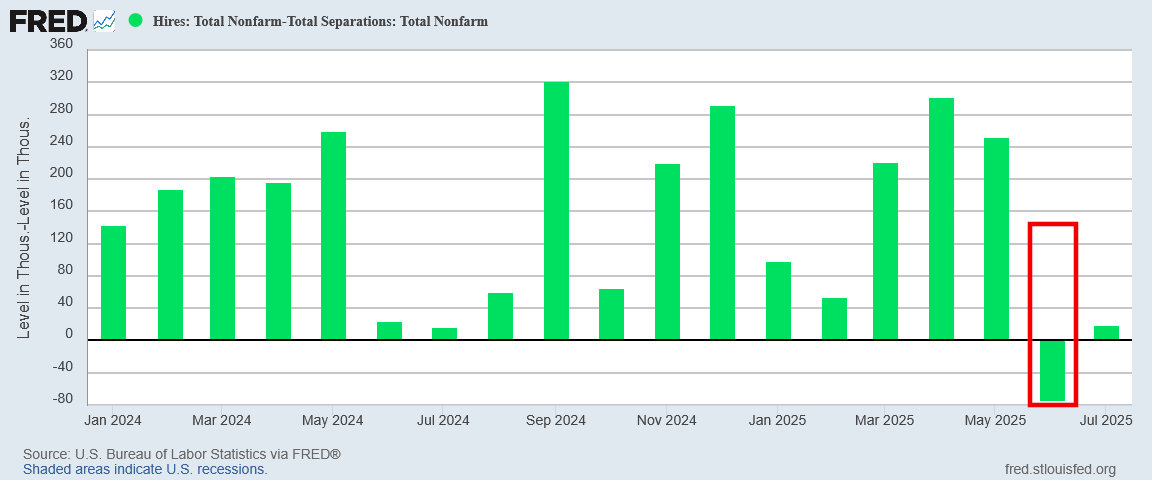
Even a cursory glance at the total non-farm Job Openings, Hires, and Separations, shows that there was change.
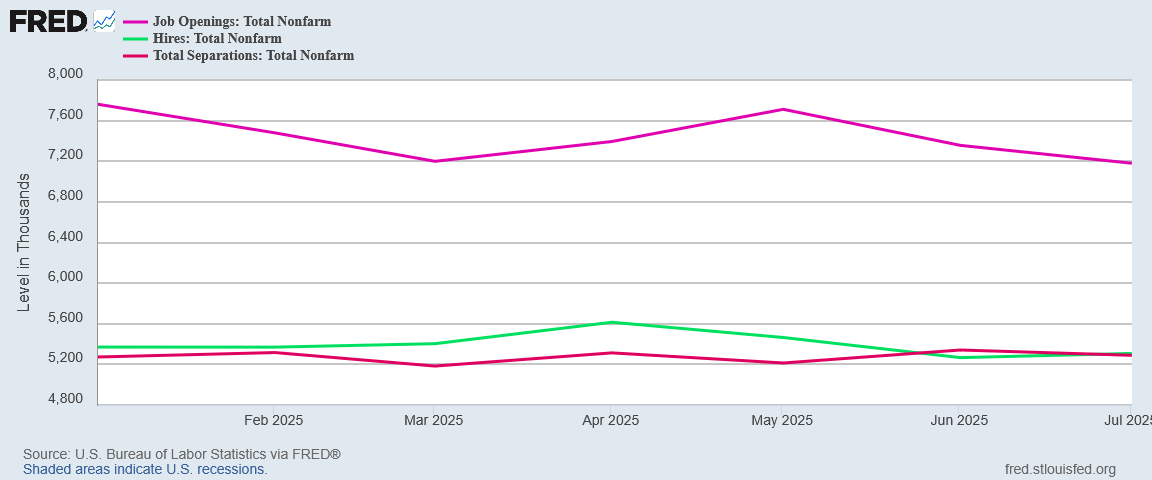
Job Openings fell by 176,000. Is that “little change”? Against a baseline of several million job openings, it is a fairly small percentage, but when the Employment Situation Summary does not show that level of job growth, 176,000 jobs openings is probably far more significant than the BLS wants to acknowledge. The only way that figure is not significant is if the job openings data itself is largely fictitious—a conclusion readers will recall I have stated numerous times.
Total Hires rose by 41,000 jobs in July. Total Separations fell by 52,000.
That is not ginormous change—but it is not “unchanged”. If anything, it’s a continuation of a years-long downward trend in both hiring and separations.
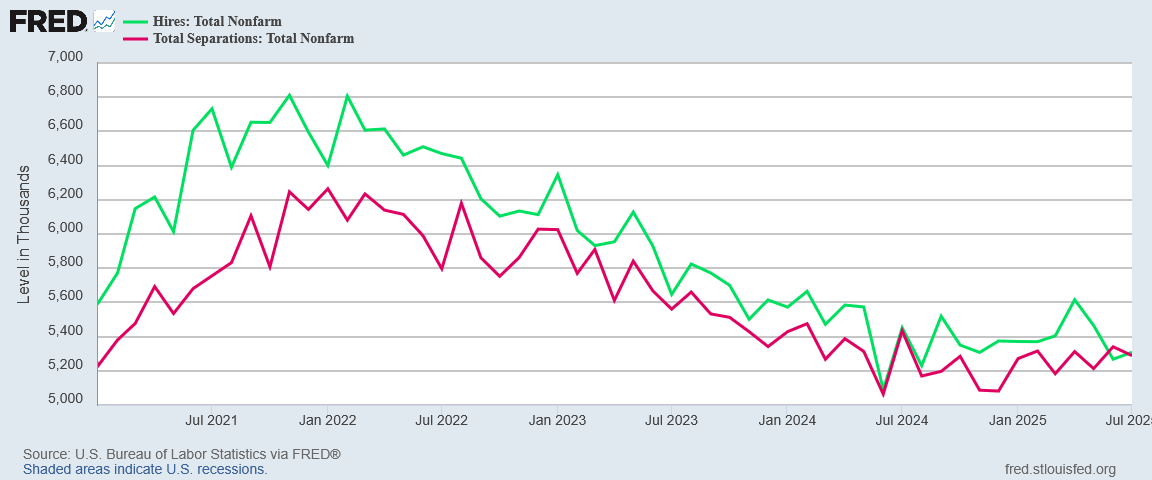
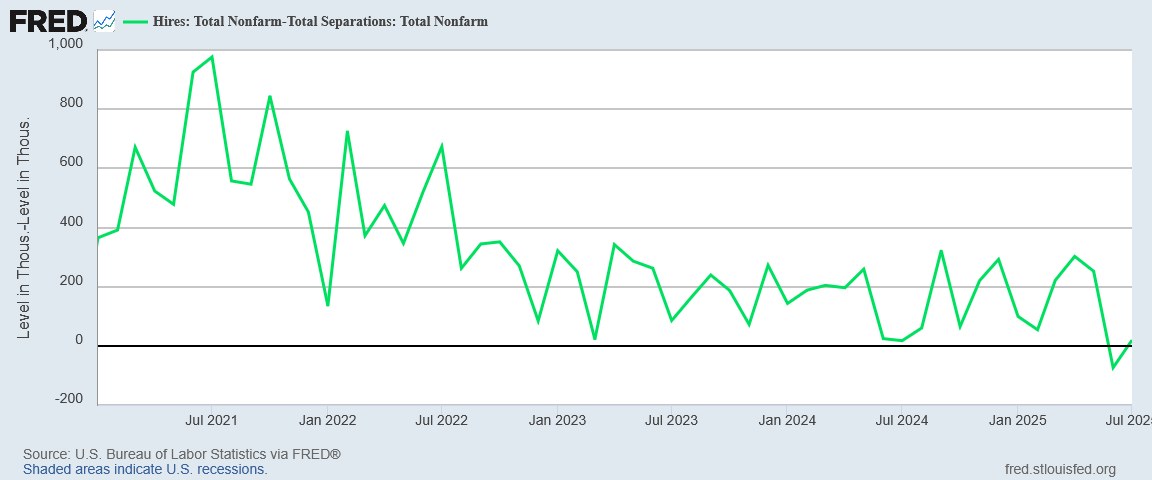
While the shifts themselves may seem rather small, one reason they are small is because hiring in the United States has been slowing down since late 2021. That trend is more clearly seen when we combine hires and separations into a “Net Hires” metric.
There is another change that is important to note here: revisions.
The number of job openings for June was revised down by 80,000 to 7.4 million, the number of hires was revised up by 63,000 to 5.3 million, and the number of total separations was revised up by 281,000 to 5.3 million. Within separations, the number of quits was revised up by 67,000 to 3.2 million, and the number of layoffs and discharges was revised up by 192,000 to 1.8 million.
What do these revisions mean?
This is how the net hires data looked last month:
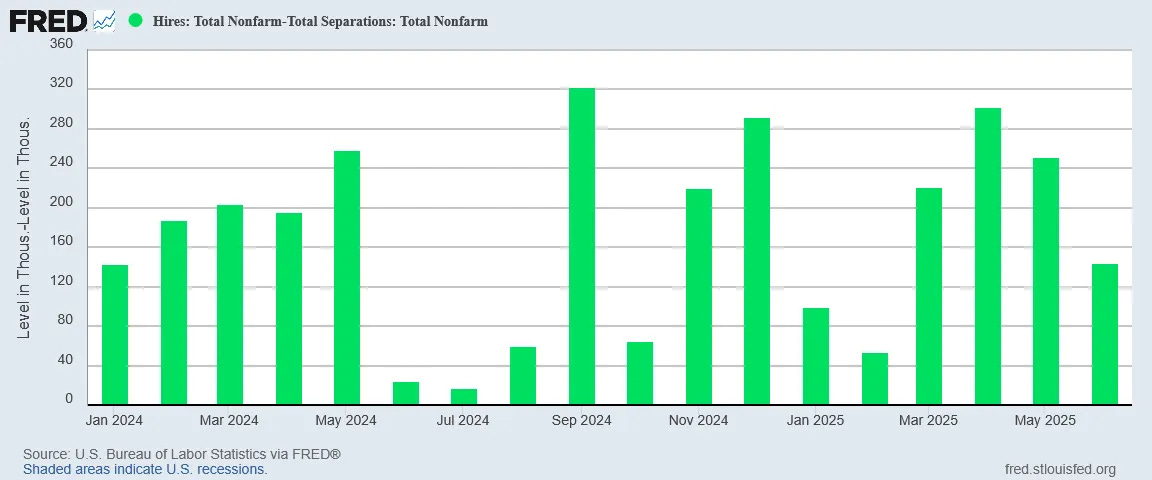
This is the exact same graph now:
The same downward revision bias that has long plagued the Employment Situation Summary managed to turn June’s original figure of 144,000 people hired net into 74,000 people let go net.
“Unchanged”?
A downward revision of 218,000 jobs is a fairly substantial change—and is further proof that the BLS has some significant methodological issues when it comes to employment data.
The jobs data did change in July. Very little of it changed for the better.
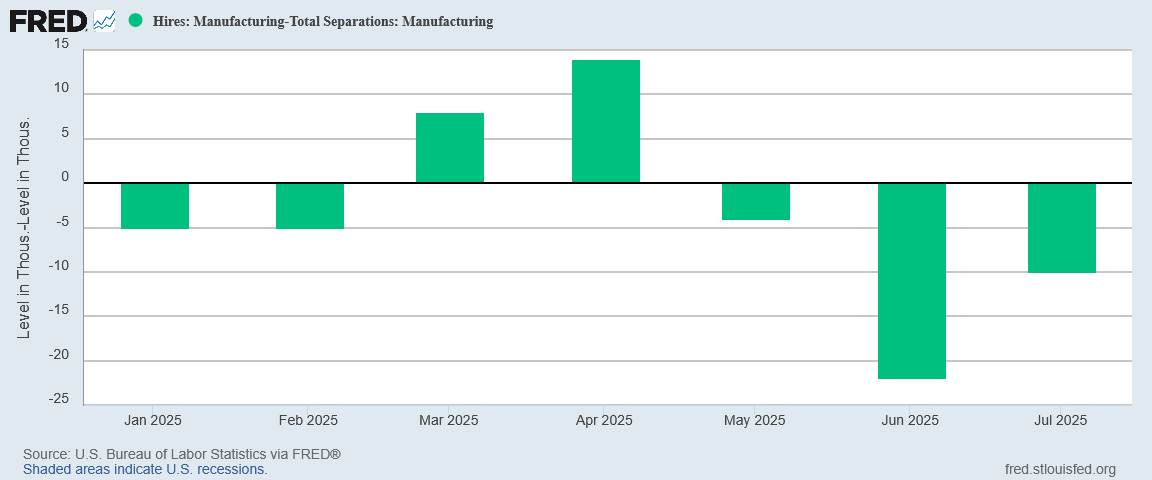
More Manufacturing Job Loss
Among the most significant negatives in the JOLTS report is the sobering data showing that manufacturing shed jobs for the third month in a row.
While Trade, Transportation, and Utilities did not shed any jobs, neither did it add any.
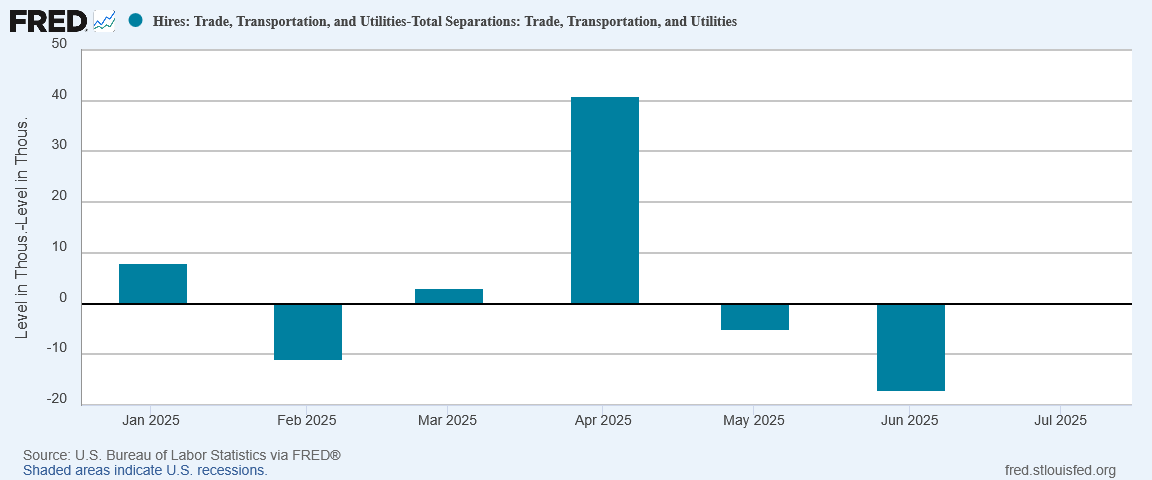
Trade, Transportation, and Utilities was one economic sector where the data was legitimately “unchanged”.
Construction was one area where net hiring increased in July.
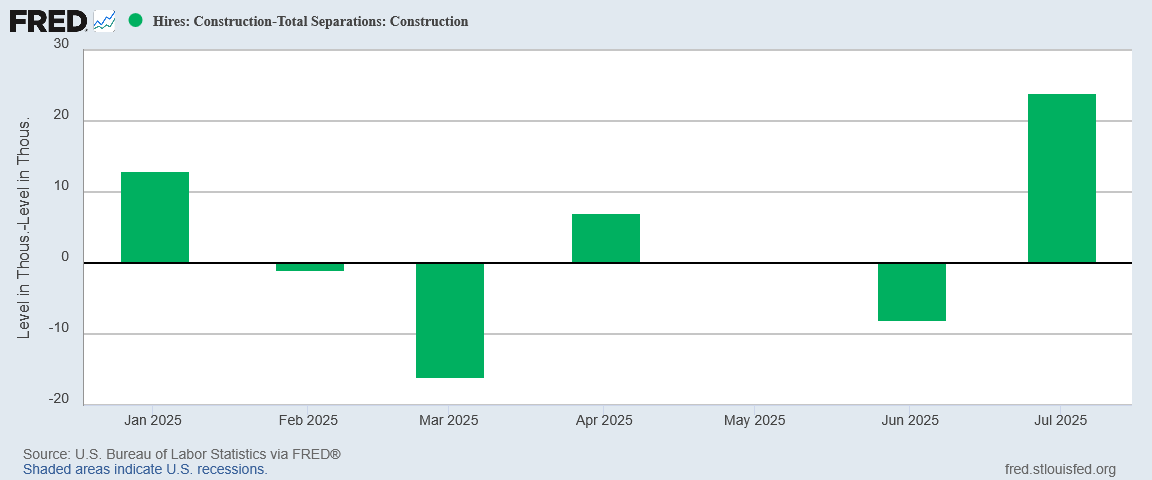
Still, that is one month and one sector—hardly a sign of robust job markets.
Manufacturing should be of particular concern, if only because manufacturing is a significant element of President Trump’s Agenda 47. If the sector continues to shed jobs President Trump will not achieve his goal of making the United States a manufacturing superpower.
Yet we also should not overlook that the data is showing jobs weakness beyond just the manufacturing sector. Labor markets across the United States and across the economy are not performing at the levels they must if the economy is to prosper.
We see confirmation of this from the July Employment Situation Summary, which in the Household Survey showed the Employment Level in this country declining yet again.
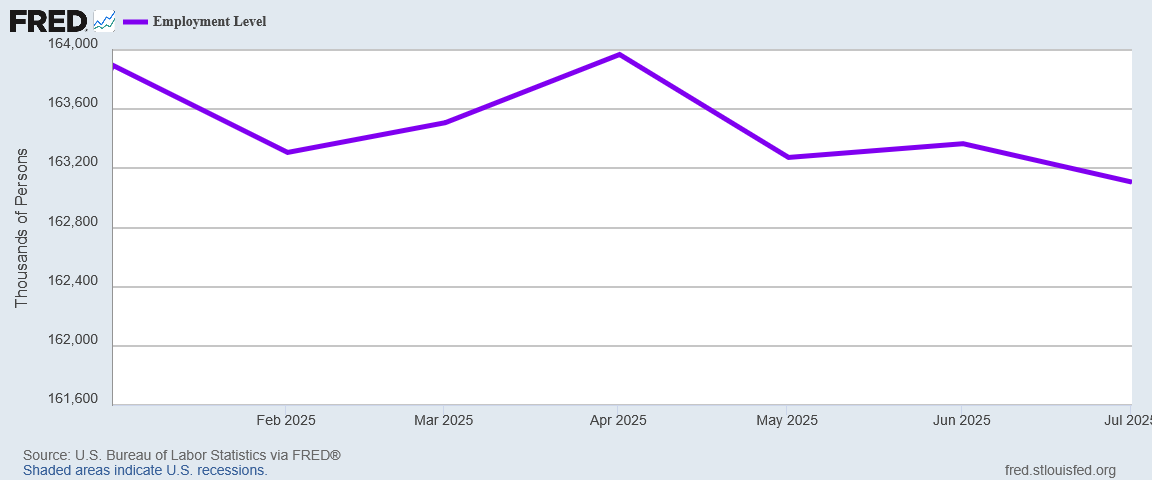
Since the start of 2025, employment in this country has gone down, according to the Employment Level.
Put another way, the Employment-Population Ratio has trended down all year.
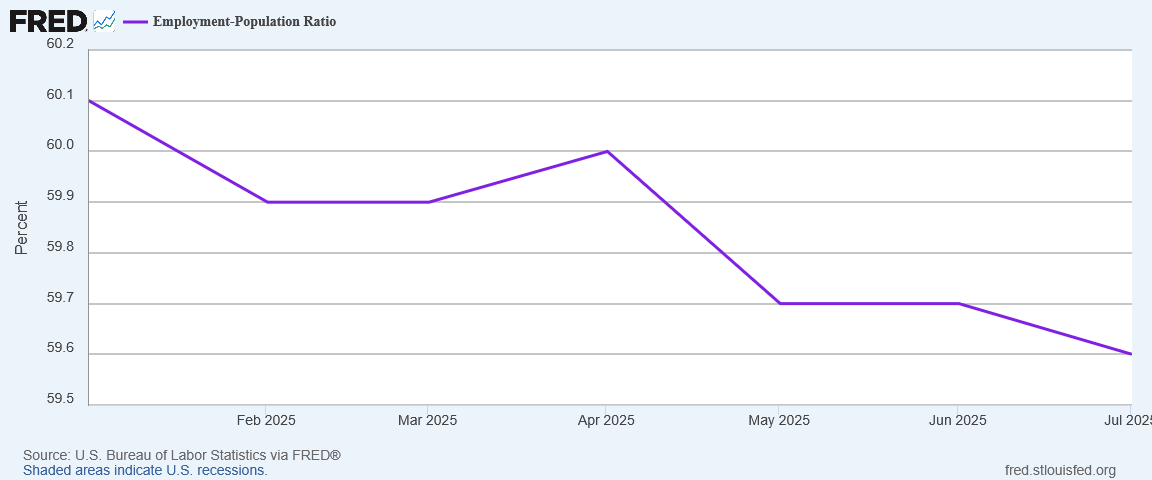
The data shows that there are fewer people employed in the United States at the end of July than at the start of President Trump’s second term. Whether we are looking at the sector-level data in the JOLTS report or the aggregate data in the Household Survey from the Employment Situation Summary, we are seeing largely the same signs of labor market weakness and rising joblessness.
There are no economic scenarios where these trends bode well for the US economy.
No Golden Age Yet
While the data does not paint an upbeat picture of US labor markets, the Trump Administration never passes up an opportunity to crow about America’s “Golden Age”—pitching a narrative whereby President Trump is delivering for American workers.
“President Trump believes that American workers are the heart and soul of our economy, which is why he’s championed an agenda that always puts them first — from signing the largest middle-class tax cuts in history to securing nearly $10 trillion in new investments to create high-paying jobs across our country,” White House assistant press secretary Taylor Rogers said in a statement to Breitbart News. “Under President Trump’s leadership, Republicans are once again the proud party of the American worker.”
To be fair, the investment deals President Trump has announced may, in time, generate considerable numbers of new jobs.
To be honest, however, we must acknowledge that those new jobs have not happened yet, and that is a caveat that is missing from Labor Secretary Lori Chavez-DeRemer’s Labor Day victory lap over rising wages:
At the Department of Labor, we are going to keep our foot on the gas, accelerating into the Golden Age of America. Prosperity is on the horizon, with real median weekly earnings at their highest level since the last time President Donald Trump was in office.
Rising wages do not help the person who has no job, and whose wage is therefore zero.
Even for those who have jobs, however, the wage data supports a narrative that is rather less golden than what Secretary Chavez-DeRemer wants you to believe.
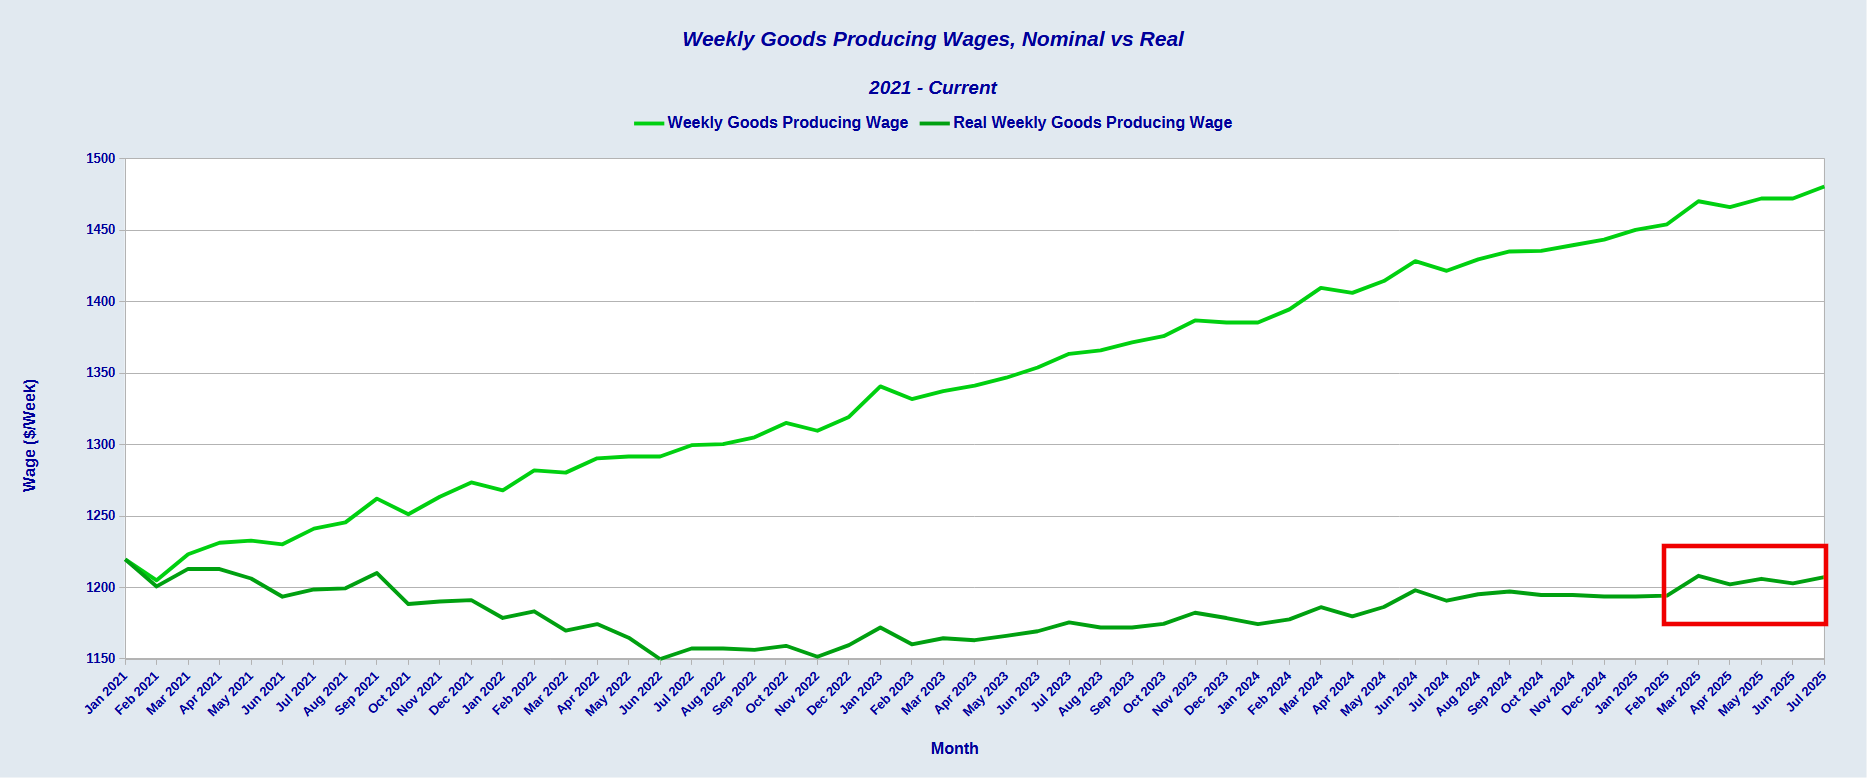
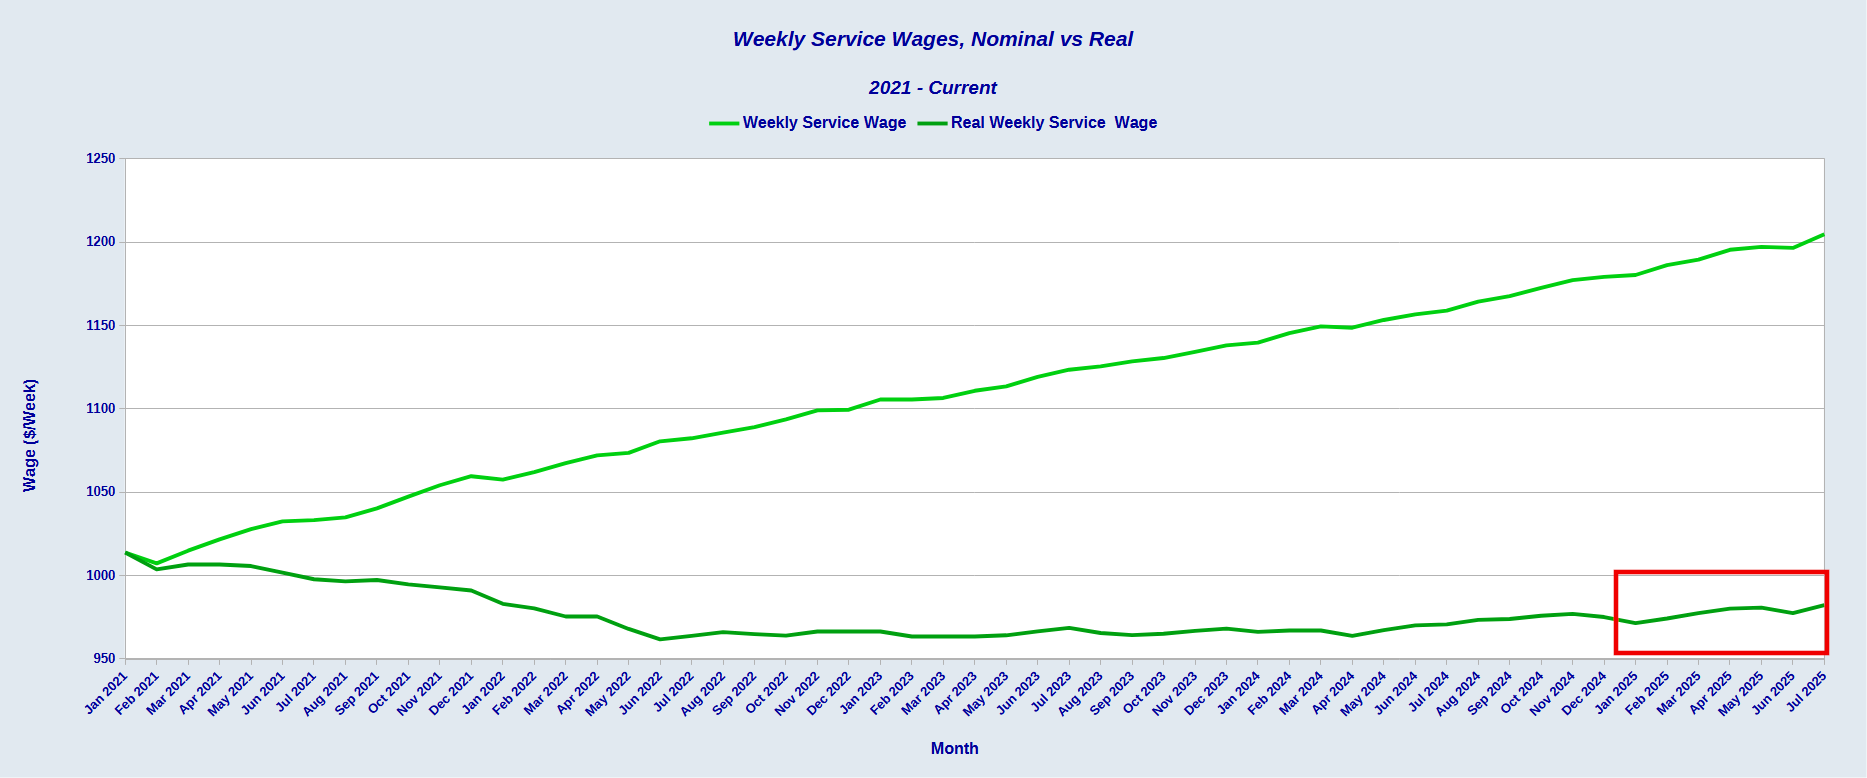
Neither goods-producing weekly earnings nor service weekly earnings have recovered from the 2022 hyperinflation cycle.

Goods-producing real weekly earnings have been largely flat in 2025, with no clear growth trend at all.
Service real weekly earnings are showing some growth, but not nearly enough to overcome the effects from 2022’s hyperinflation.
Is 2025 a “Golden Age” for the American worker? Not yet it isn’t. The jobs are not there. The wages are not there. President Trump may be going all out to market a narrative where the jobs and the wages are there, but that narrative is at odds with the current reality.
If the many investment commitments Donald Trump has announced ($10 Trillion and counting) since becoming President come to fruition, 2026, 2027, and beyond may prove to be very good years for American workers. If President Trump is successful with his various trade policies and tariff strategies, next year and beyond could easily be bountiful years for American workers.
The key word in both sentences, however, is “if”. The investments have been promised, not delivered. The jobs benefit from that $10 Trillion in promised investment has not happened. Those outcomes are still part of a hypothetical future.
Until the investments are delivered, until the new factories are built and the new supply chains established, the jobs data that we have, even with the quality control issues so blatantly obvious at the BLS, show that America has not entered into a “Golden Age”, and especially the American worker has not entered into a “Golden Age” of prosperity.
Trump’s “Golden Age” could happen. It is entirely possible that Trump’s efforts in his second term to date are laying the foundation for that “Golden Age”. I very much hope that is the case. America’s workers are long overdue for a “Golden Age” where they can be prosperous for a change.
America’s workers are not in a “Golden Age” yet. The prosperity touted by the Trump Administration has not happened yet.
American workers are still in a grim age of jobs recession. The JOLTS data is the latest data set showing that rising joblessness rather than rising wages are the reality for more workers than the Trump Administration will admit.
The Merriam-Webster Dictionary is the lineal descendant of Noah Webster’s seminal work, An American Dictionary of the English Language, Corrected and Enlarged. As such it is perhaps the most authoritative source on what constitutes “American” English. As I am an American writing for a primarily American audience, I use the Merriam Webster Dictionary for all pertinent non-technical word definitions.
I see how reliable the Fed/BLA data is. When I multiply the average hourly wage data by 40, it does not equal the average weekly wage. The weekly is higher. This is for both manufacturers and service providers. The only real world explanation is overtime wages to complete jobs.
While not totally out to whack; overtime indicates that there's room in the labor force to hire workers. Yet, with rising costs for Healthcare and other benefits, thats not going to happen. Not until there's clear indication to employers that continuing to backlog work will have negative consequences.
See, this is why you have earned so much credibility with your readers, Peter. You would like to report better news regarding Trump’s agenda, and you know that most of your readers would like to hear it - but the real, factual data doesn’t show that, so you don’t. You are trustworthy (or at least more so than anyone else I read).
Thank you.
There are multiple indicators, metrics, raw data, adjusted data, ratios, etc. that show what’s happening in our economy. Given that the BLS has a history of fudging data, I have two questions: which of the many indicators should be the most accurate to watch to see if Trump’s agenda is working? And which parts of his agenda are crucial to show improvement to benefit his administration in time for the midterm elections?