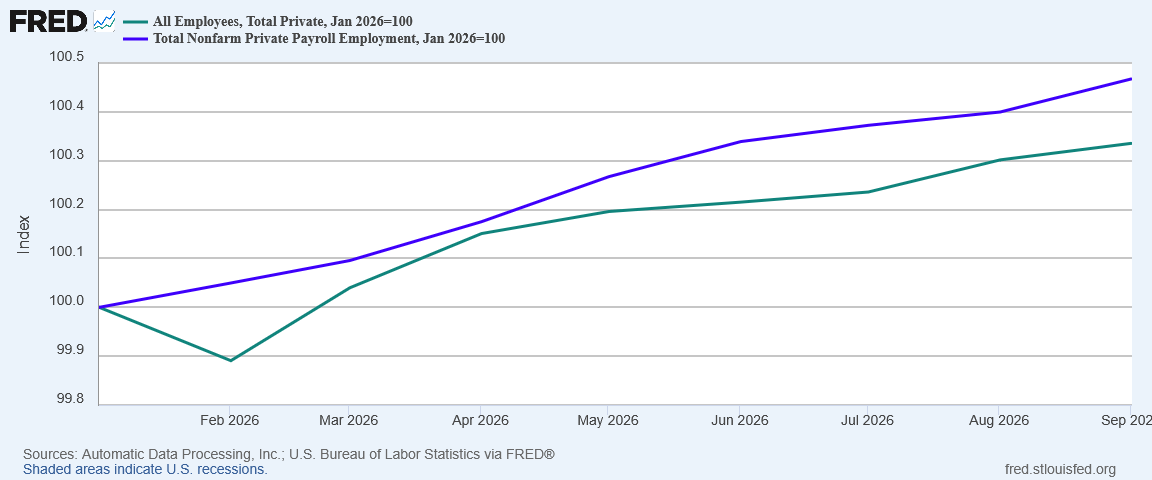
After ADP dropped their National Employment Report, the expectations for the BLS’ September Employment Situation Summary were for another strong month, with at least 90,000 jobs created.
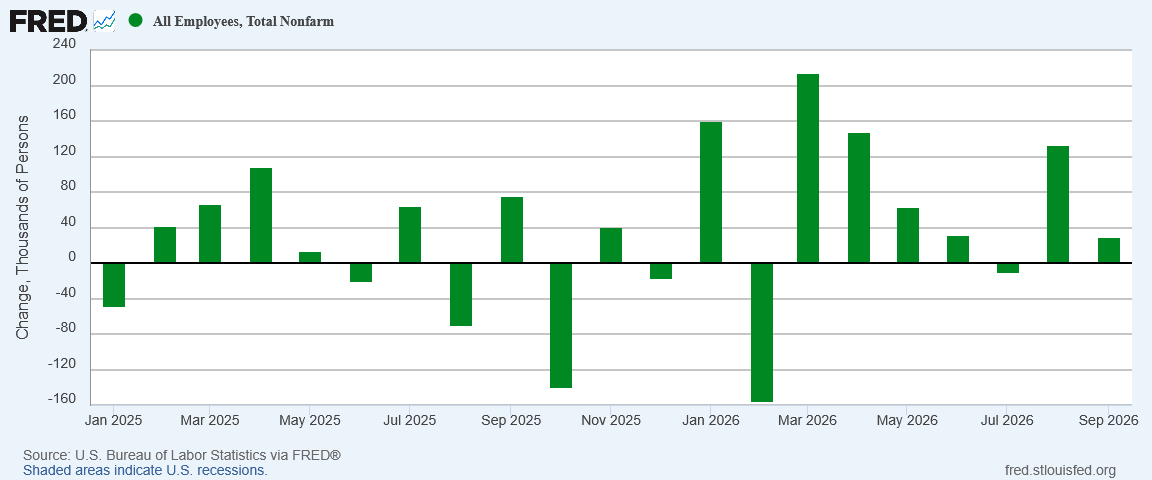
Both nonfarm payroll employment (+29,000) and the unemployment rate (4.2 percent) changed little in September, the U.S. Bureau of Labor Statistics reported today. Employment in all major industries changed little over the month.
Wall Street expected another strong month. Prediction markets anticipated another strong month. ADP pointed to another strong month.
Wall Street was wrong. Prediction markets were wrong. ADP (apparently) was wrong.
Whisky Tango Foxtrot?
Did job markets reverse suddenly in September? Has the war with Iran finally hit the economy where it would really hurt? Did Lou Costello Labor Math take a larger than usual bite out of the job figures?
Did all of the above play a role?
Regardless of the precise mix of forces which converged to produce September’s grim BLS job report, one reality made abundantly clear is the ongoing frailty of US labor markets and the still-nascent jobs recovery.
Every article I publish takes time, care, and independence. A paid subscription fuels that work and shields it from outside pressure. If you’re able, join me today.
Was It Lou Costello Labor Math?
As with the August numbers, whenever the BLS jobs data is unexpected, we have to consider the possibility that the data itself might simply be garbage—what I call “Lou Costello Labor Math”, in homage to the classic Abbott and Costello sketch where “Thirteen goes into twenty-eight seven times.”
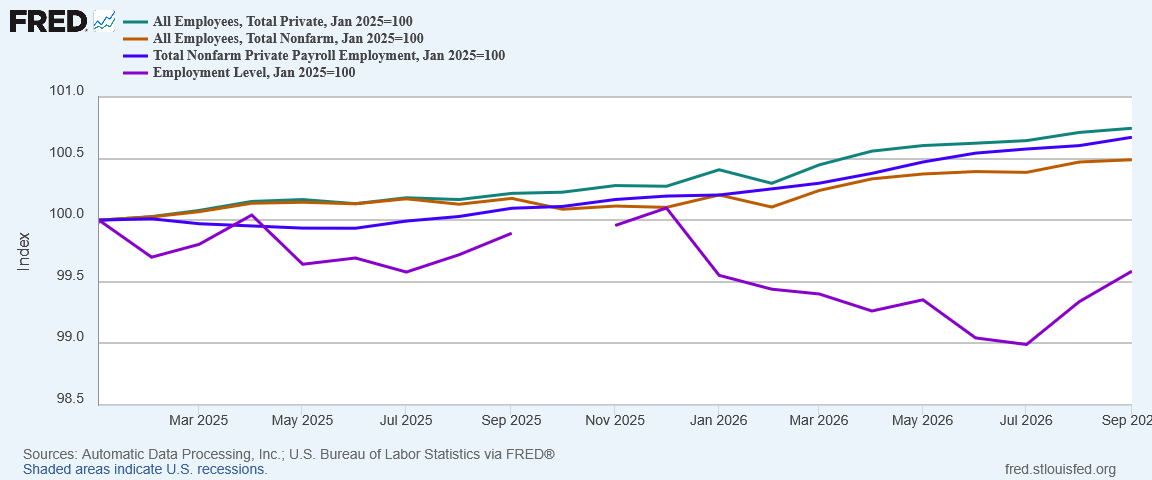
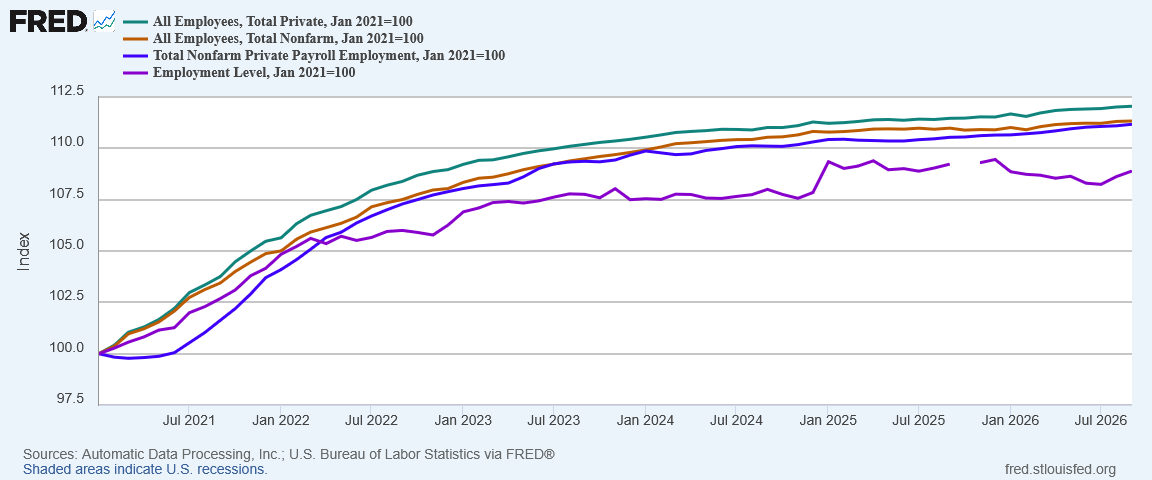
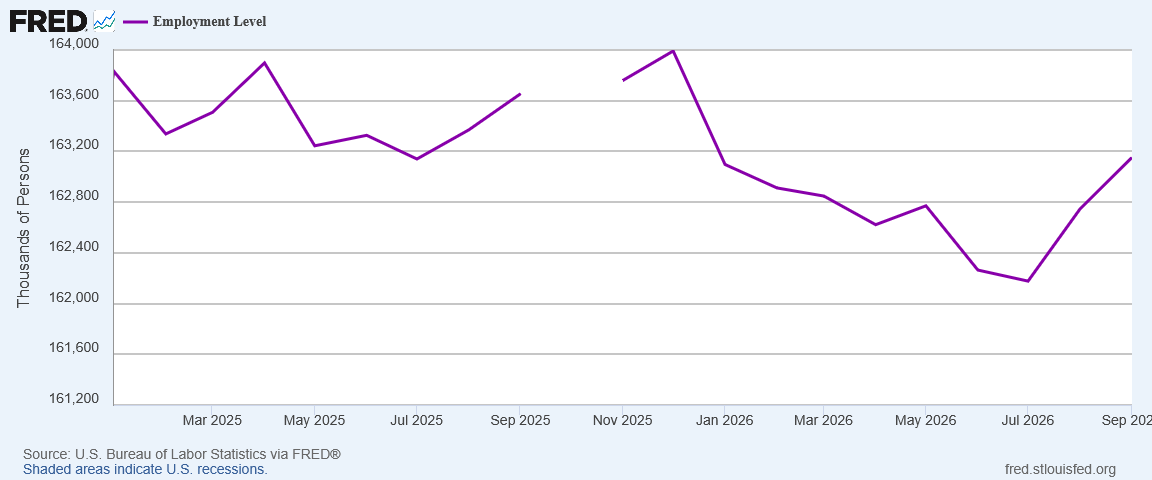
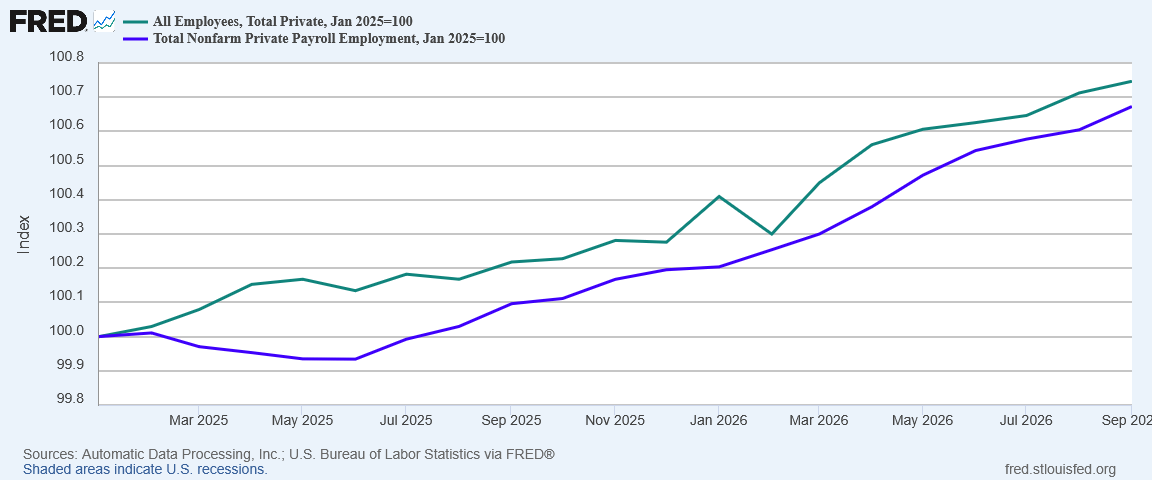
As the chart clearly shows, starting with 2026 the Employment Level has been dropping in this country through July. In August, and then again in September the Employment Level increased well above the growth trend shown in the payroll data.
The two labor metrics theoretically should sample approximately the same data, which means the trends should be broadly similar. With the Employment Level moving on a different trajectory from the All Employees data, we at the very least have reason to question the data itself.
We should pause to note that the recent trend variances between the Employment Level and payroll job levels in the US economy are not a new development. The Employment Level growth trajectory began to deviate from payroll growth in the spring of 2022—the period when we can clearly see Lou Costello Labor Math become a recurring theme within the BLS job data sets.
While that phenomenon had largely disappeared for 2025, it returned with a vengeance in the first half of 2026, although the August and September job reports suggest a reversion to mean may be underway, correcting the 2026 variances.
That the revisions applied to July and August were both large and both negative is another indication the data is of poor quality. Readers may recall from last week when I was discussing the August JOLTS report, I anticipated there would be large downside corrections in the September jobs report.
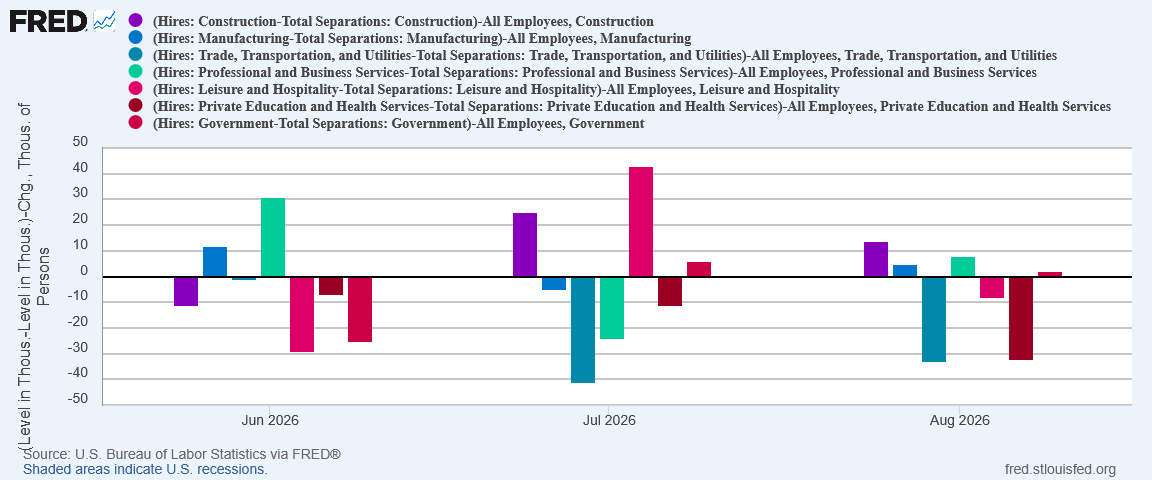
For Trade Transportation and Utilities as well as Healthcare, the JOLTS data printed well below what job growth reports on the ESS. The sectors where the JOLTS data came in larger than the ESS data had significantly smaller variances.
When the September ESS comes out, we should anticipate substantial downward revisions, particularly in TTU and Healthcare. However, it is possible we could see some upward revisions in Manufacturing and Construction especially.
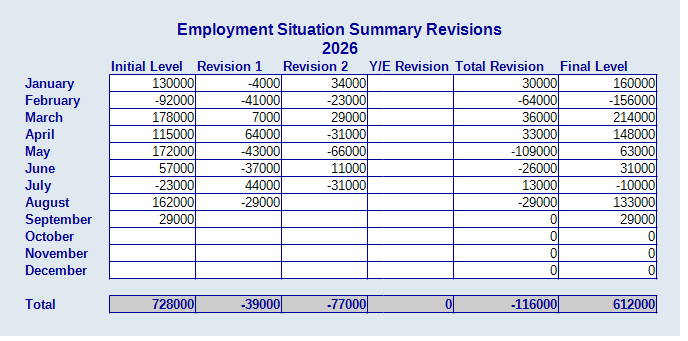
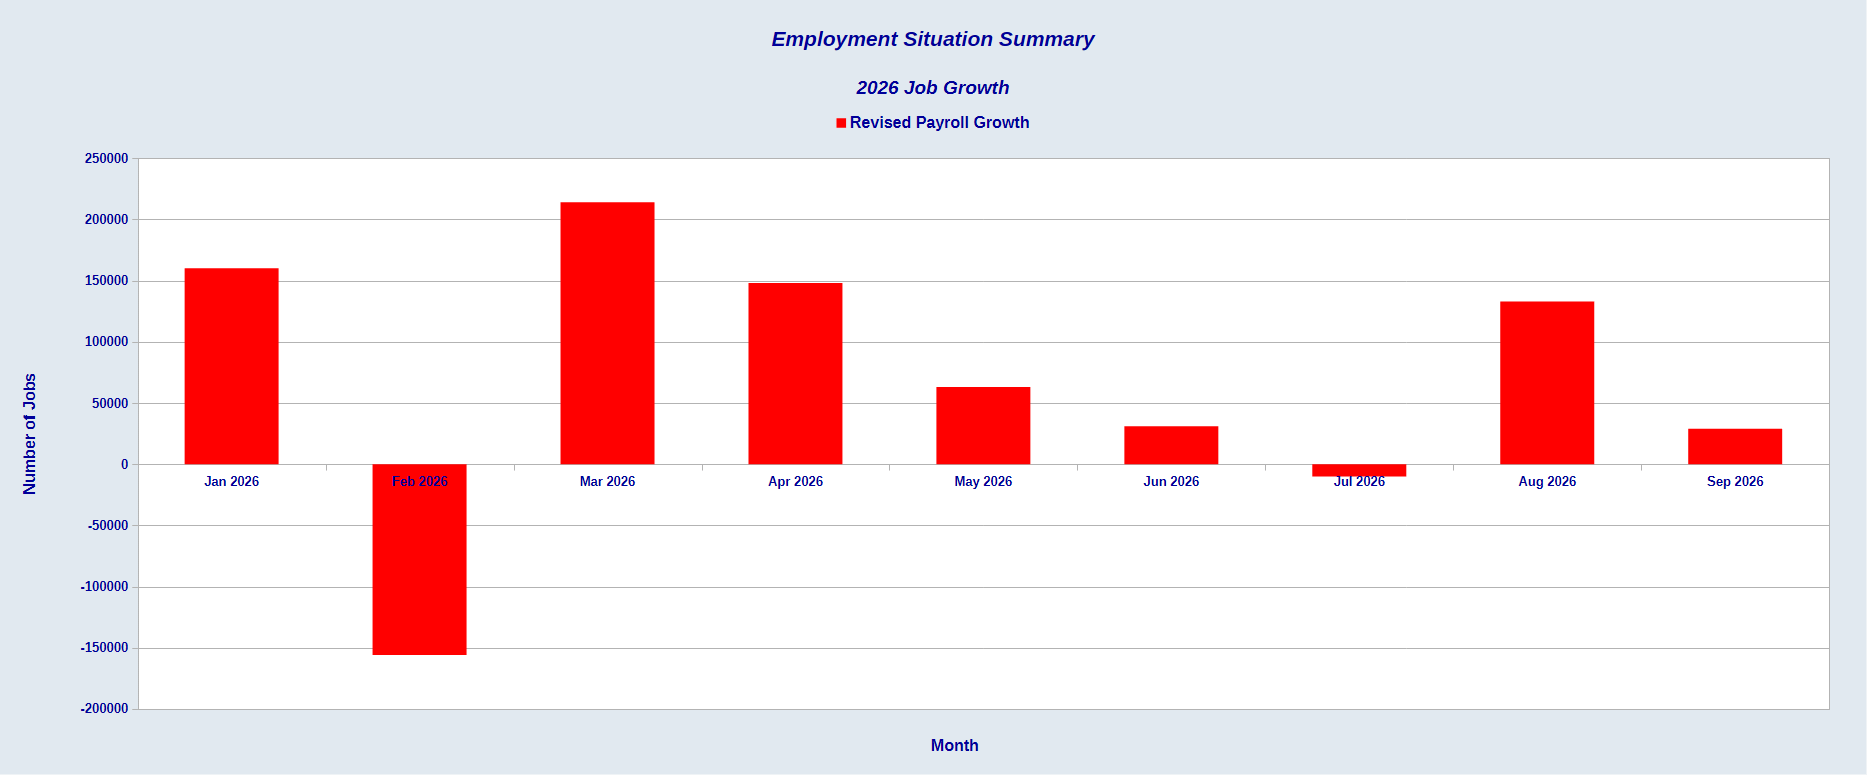
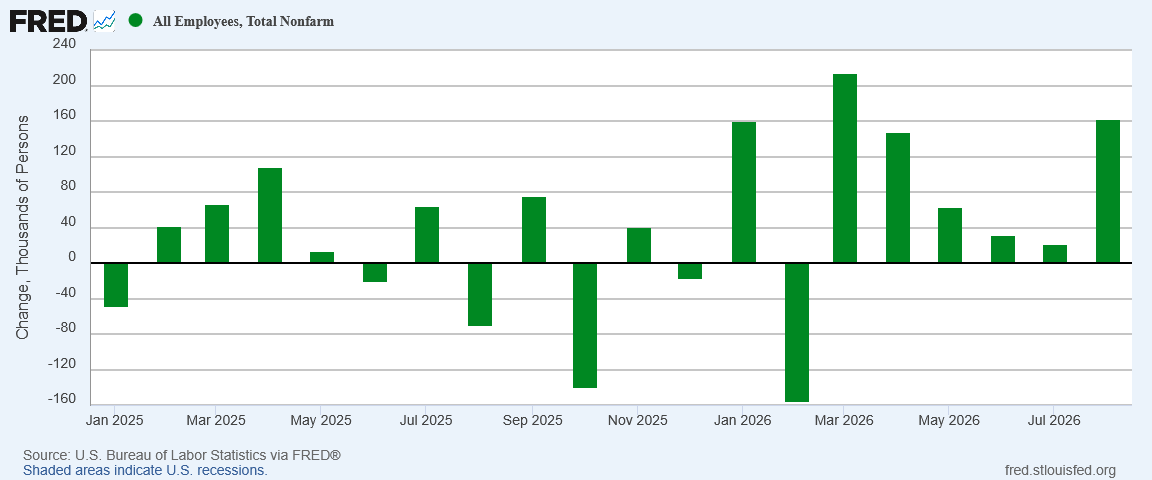
The change in total nonfarm payroll employment for July was revised down by 31,000, from +21,000 to -10,000, and the change for August was revised down by 29,000, from +162,000 to +133,000. With these revisions, employment in July and August combined is 60,000 lower than previously reported.
For the year, the BLS has overstated job growth by a cumulative 116,000 jobs.
July, which had been upgraded to job growth in August, was downgraded once more to job loss.
We should note, however, that even with the 60,000 jobs erased, August still shows 133,000 jobs created. That is still not a bad job growth figure for the month.
There are signs that the BLS data continues to struggle with poor quality estimates and modeling, but there remains good support for August being a strong jobs month even so.
More than Lou Costello Labor Math is likely to be at work on the September jobs numbers.
Wishful Thinking?
One factor that may have played into high hopes for the jobs report was simple wishful thinking.
After the strong August jobs report, the financial media had been speculating about the possibility of a “September surge”.
There’s a popular belief that the job market kicks into high gear in early autumn, commonly known as the “September surge.”
According to Katie Martocchio, senior talent acquisition manager at software company Prompt, the month of September brings a spike in productivity for employers and job seekers alike.
Coasting off of fall’s “back-to-school energy,” companies start “getting back into the groove” after Labor Day, she says, and year-end goals become top of mind.
“Now is the time that we can onboard someone, and they can help support and drive those goals to that finish line,” Martocchio says.
Amanda Augustine, a career coach and resume writer, says she expects to see a “bump” in hiring this fall, rather than a “surge.”
But it’s unlikely that momentum will last through the rest of the fall, according to Augustine, and “while it’s a bit more of a positive job market, that doesn’t mean it’s necessarily going to be an easy job market for everyone.”
Prediction markets apparently latched on to the August numbers and projected that September would be in the same range.
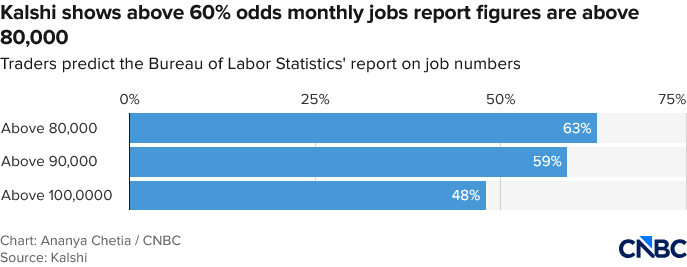
Following August’s bigger-than-expected employment report — where the U.S. added 162,000 jobs during the month — traders on prediction market platform Kalshi think there’s a 60% chance the country added more than 90,000 jobs during September.
Speculators also think there’s almost 50-50 odds that the report is once again in six figures. That’s higher than the Dow Jones consensus economist consensus forecast of 84,000.
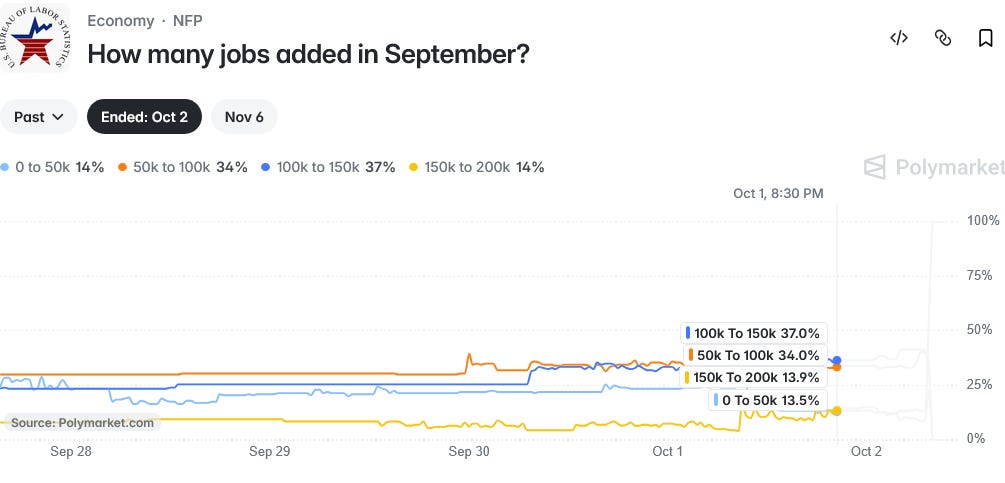
Polymarket was even more optimistic, with predictions of job growth above 50,000 surpassing 86%.
Did a desire for optimistic results crowd out signals within the extant data?
Possibly—although when assessing the August JOLTS data, the PMI metrics arguably pointed towards ongoing job market strength. The S&P Global PMI metrics for September also fit well with ADP’s own strong jobs report. Were the PMI surveys unreasonably optimistic, or was my read on them unreasonably optimistic? Given where the BLS jobs numbers printed, both possibilities cannot be discounted.
Were there signals within the jobs data that deserved greater attention than they received?
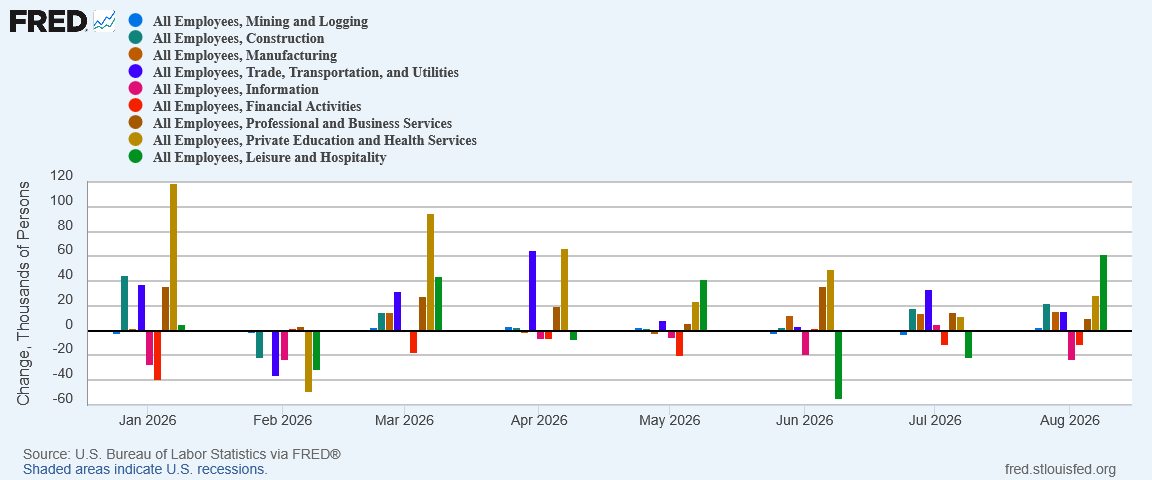
When we consider what the all sectors data showed for August, if anything the trend indicated growing job market strength.
Looking at the Total Nonfarm numbers vs where they were in August, we do see increasing labor market softness from March onward, which was overshadowed by the unexpected August rebound.
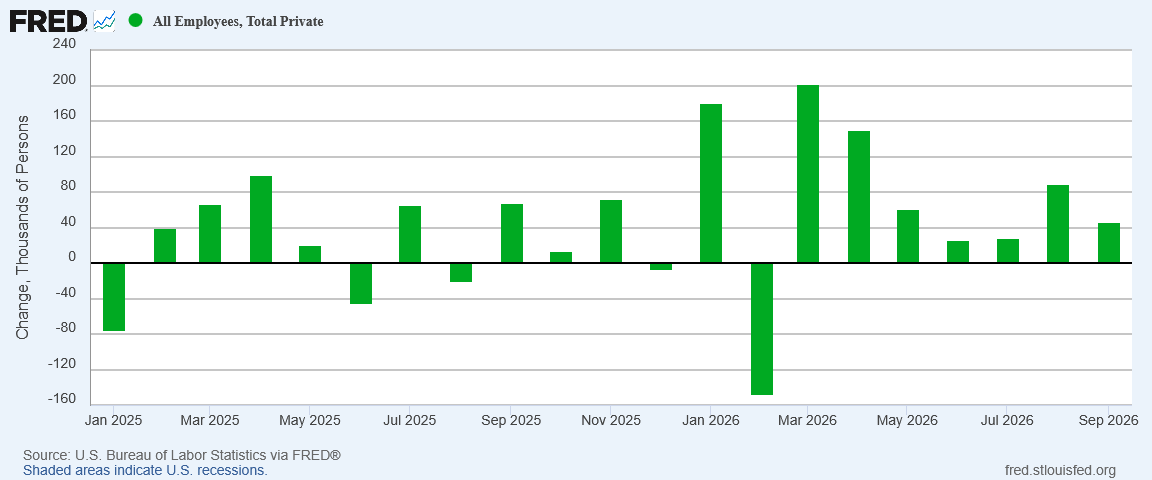
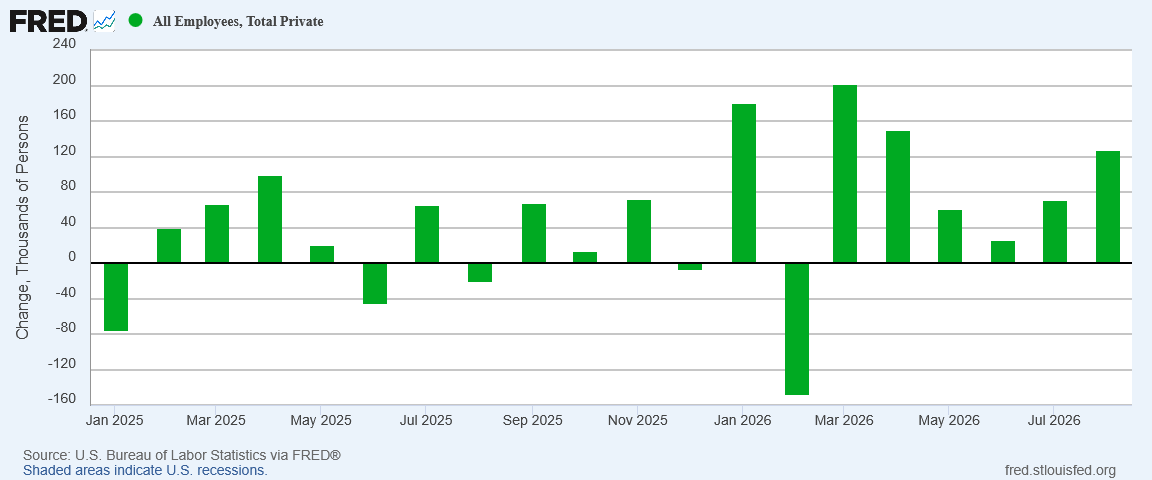
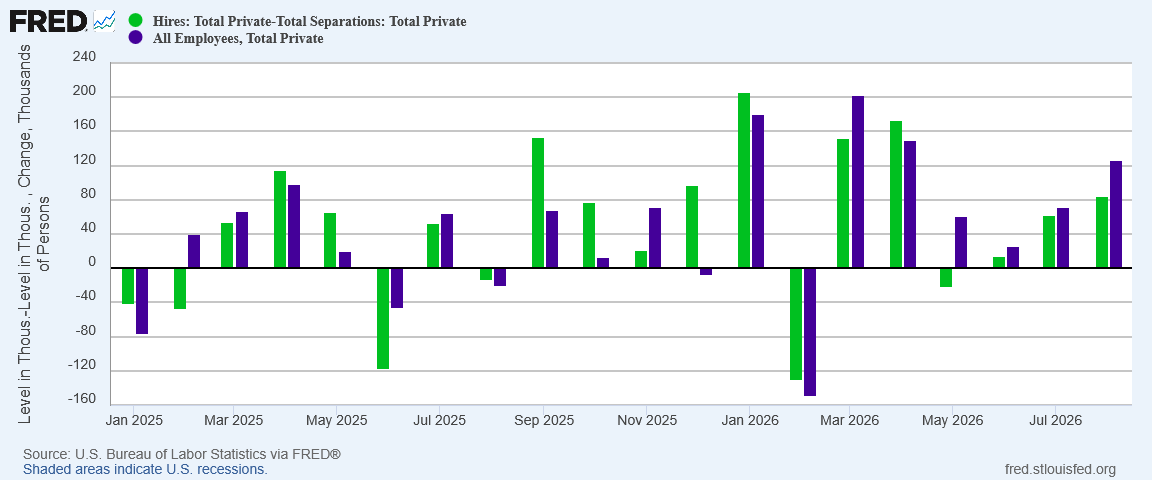
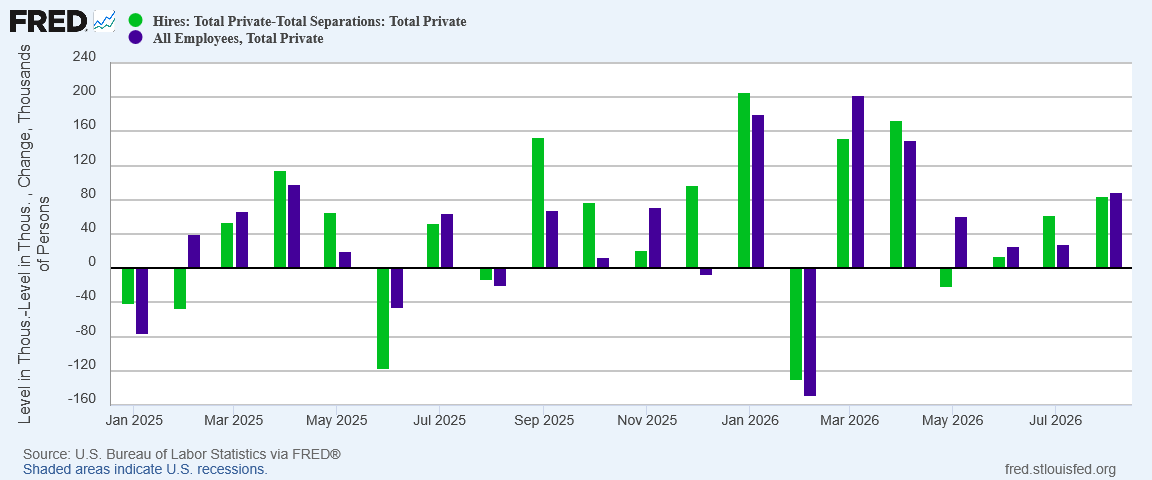
The Total Private data, which excludes government payroll changes, arguably showed a recovery starting in July from a horrid June.
The difference in the job prints, of course, is the erasure of 60,000 jobs in July and August, something the JOLTS data signaled was a distinct possibility.
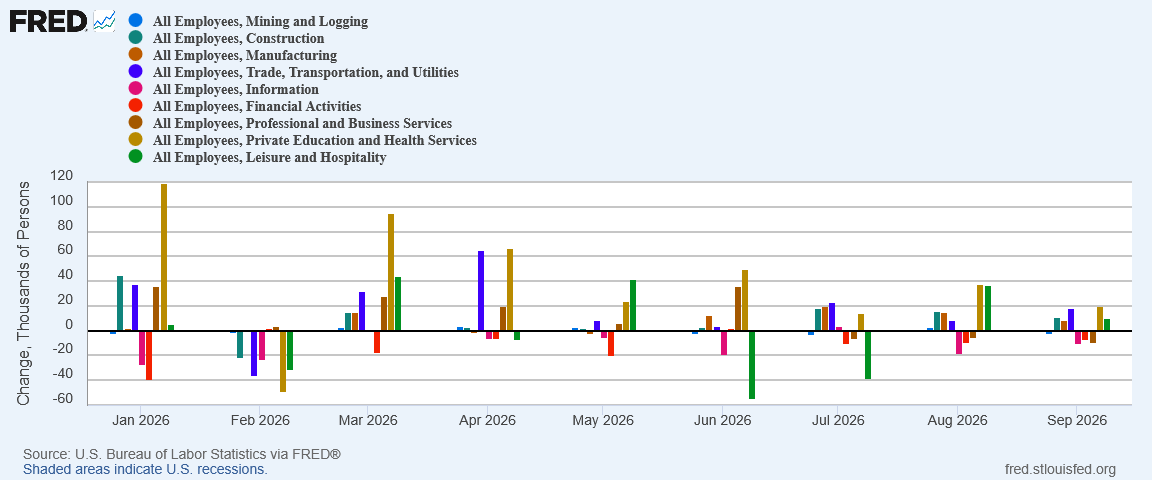
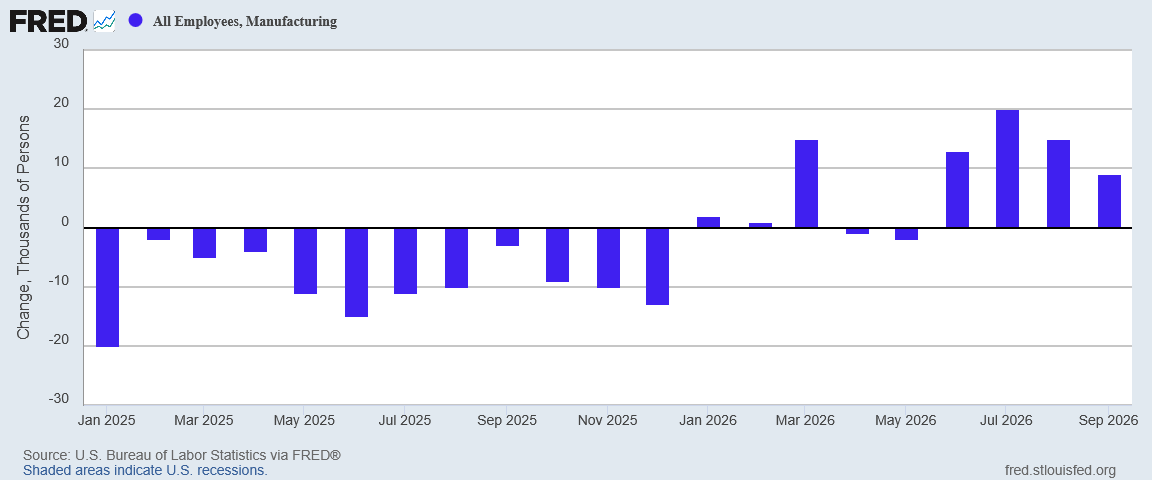
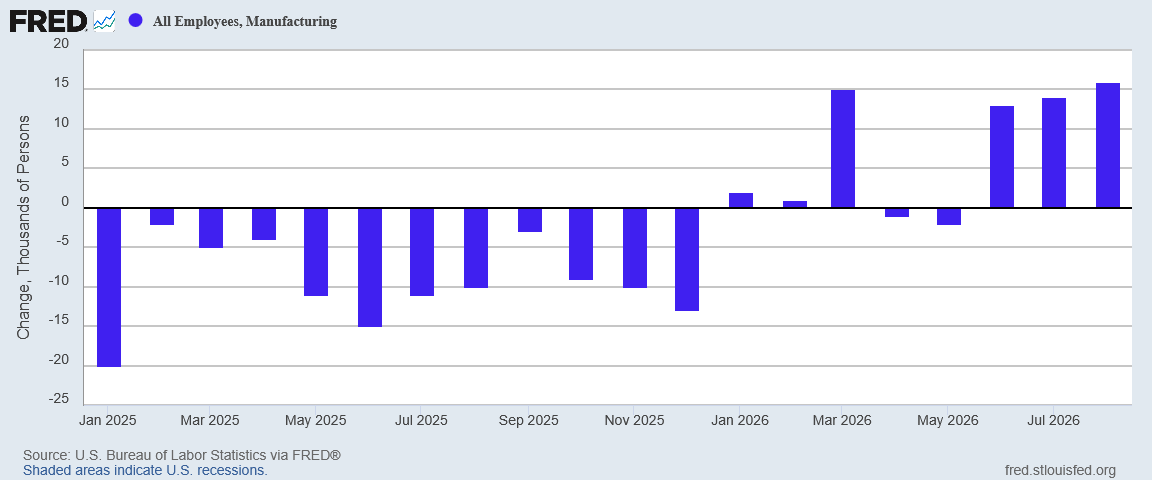
Manufacturing, which is now showing increasing softness after July, was showing growing strength in August.
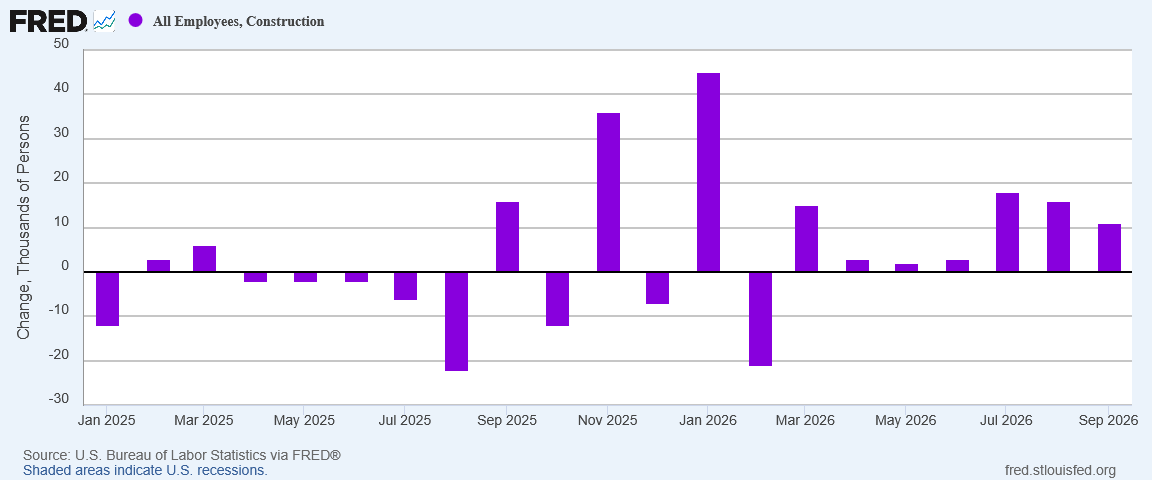
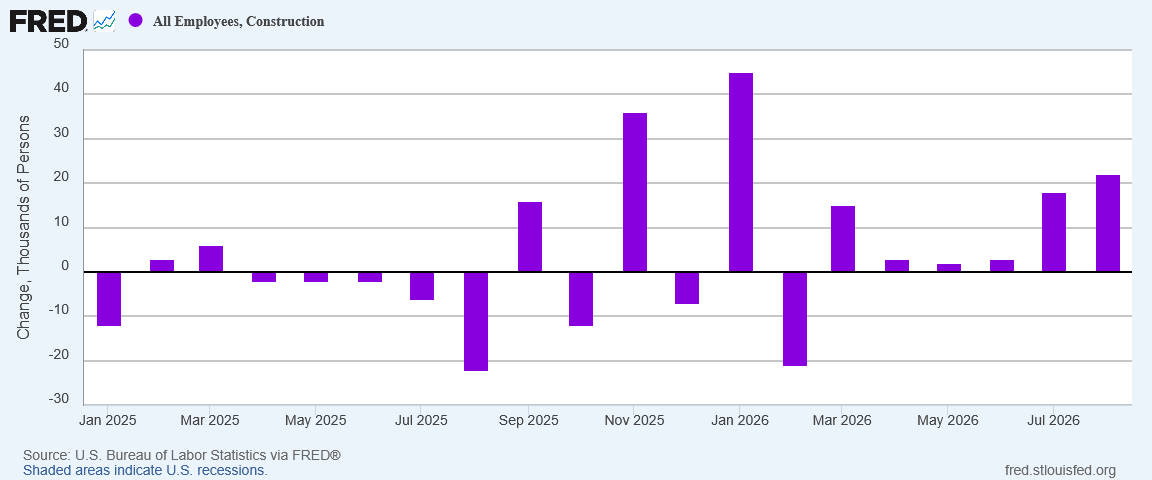
Before September’s revisions, Construction was also showing increasing strength rather than decreasing.
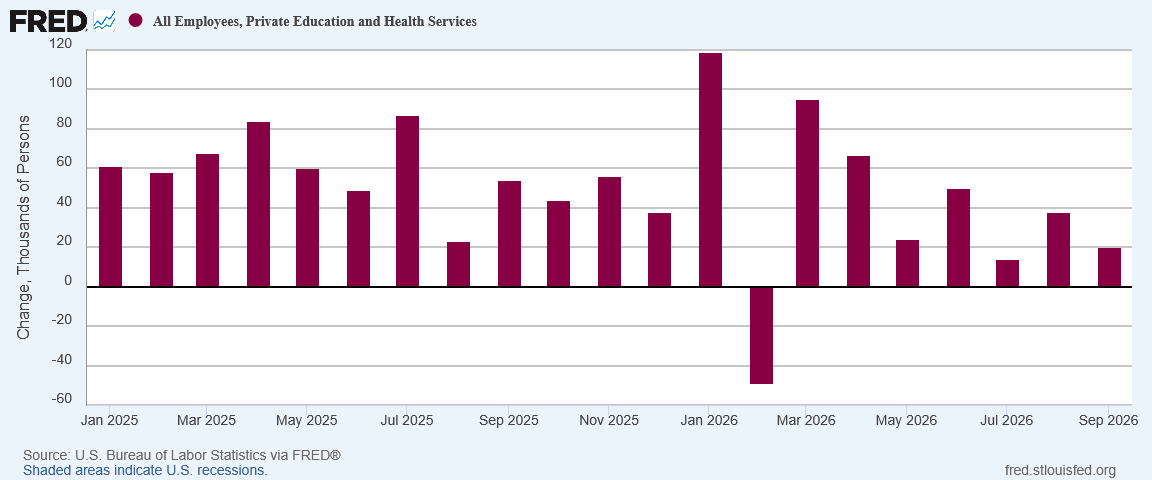
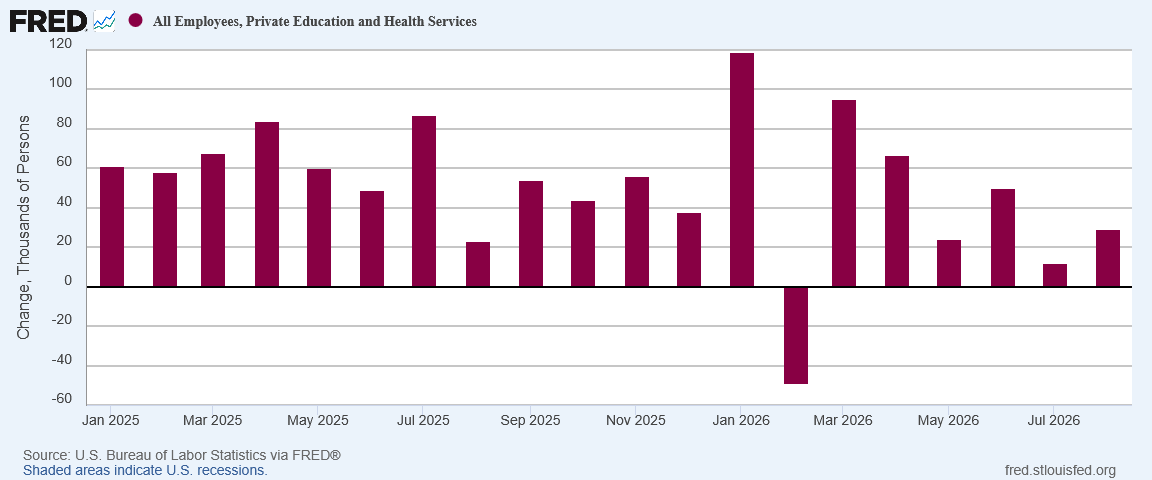
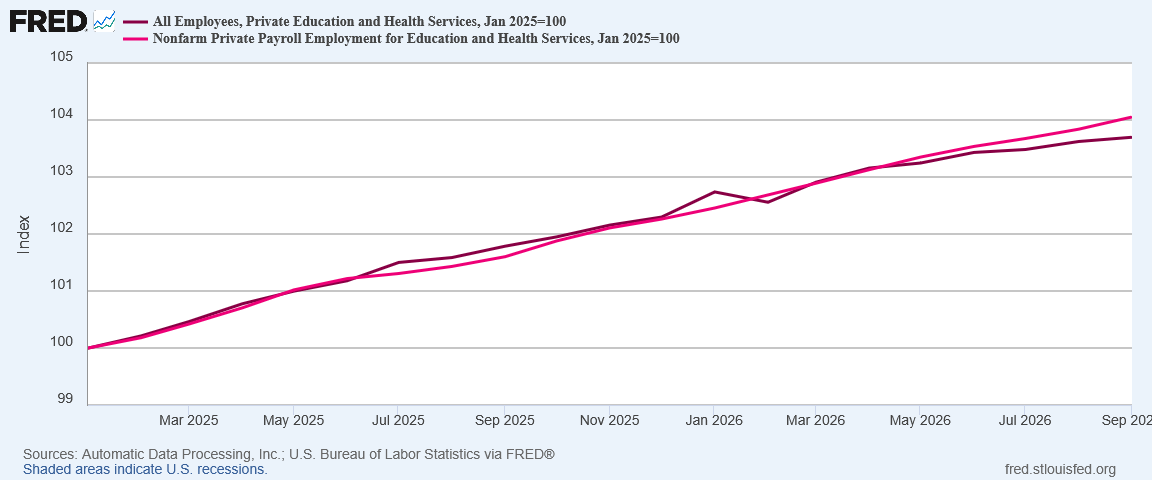
Healthcare hiring peaked in January, and the macro trend ever since has been less and less hiring. That trend was visible in August as well.
One signal that the ESS data was overstated in August was plainly visible in the August JOLTS data—August Private Net Hiring came in 42,000 jobs below August Total Private payroll data.
In hindsight, this variance probably warranted greater emphasis than I gave it, as the September revisions made much of that variance evaporate.
There were some indications that job markets were softening in August, but many of them only became clear downward trends after the September revisions.
With the ADP jobs print at 70,000 jobs for September, it is unlikely, given the state of the jobs data as of August, that Wall Street estimates and even prediction market estimates would have come in much below the ADP number.
Current Population Survey Data Looked Rather Good
Standing at odds with the anemic headline payroll data are several metrics from the “Household” survey, aka the Current Population Survey.
The Employment Level rose to a seasonally-adjusted 163,152,000 persons in September, the second consecutive month of increase after being in decline all year.
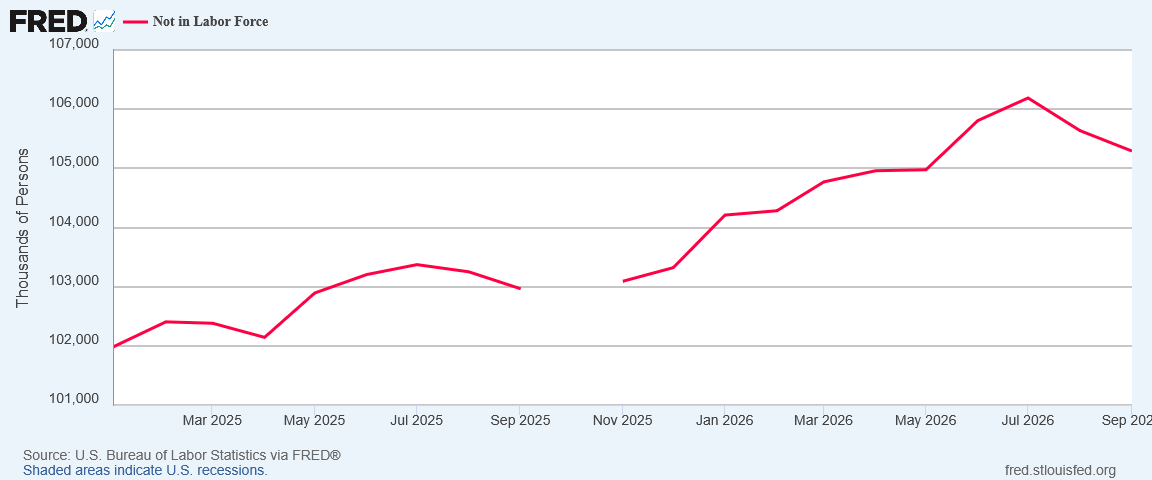
At the same time, the cohort of people Not in the Labor Force dropped for the second consecutive month.
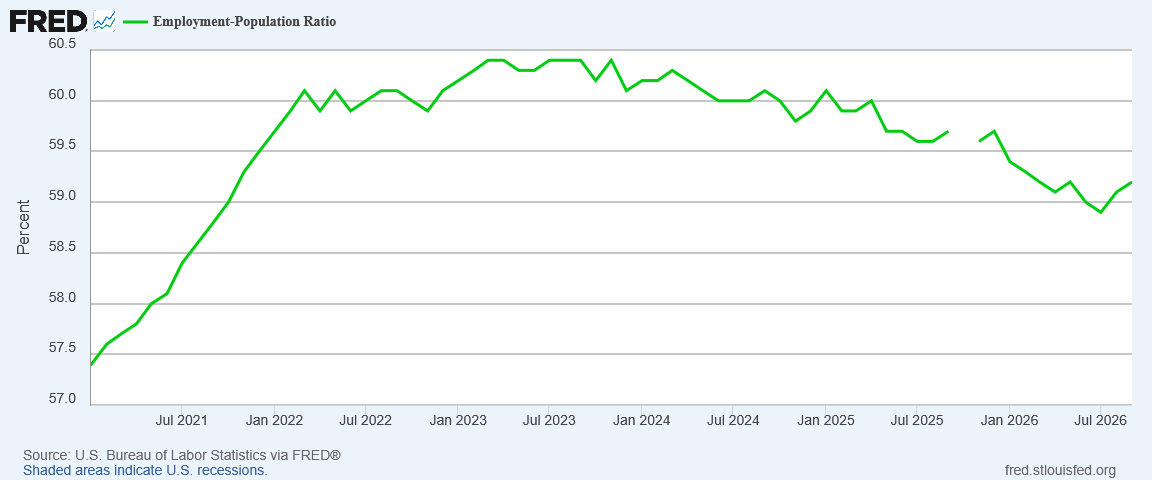
These shifts in the labor force have had a positive effect on the Employee-Population Ratio, which also rose for the second consecutive month.
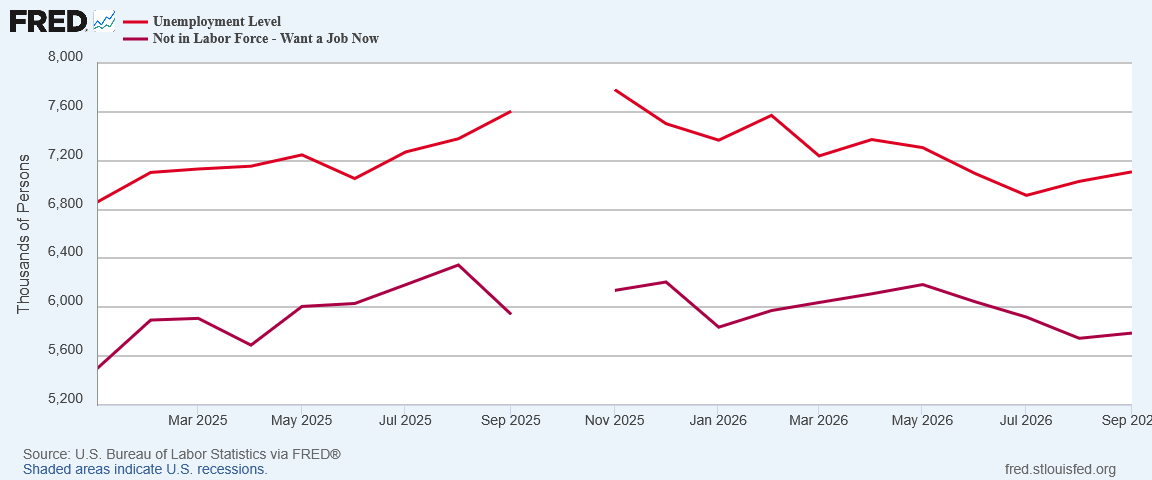
While the number Not in the Labor Force who want a job now—a cohort I add to the official unemployed number to get a “real” unemployment level—did rise by 43,000 in September, that was a smaller rise than the official unemployment level.
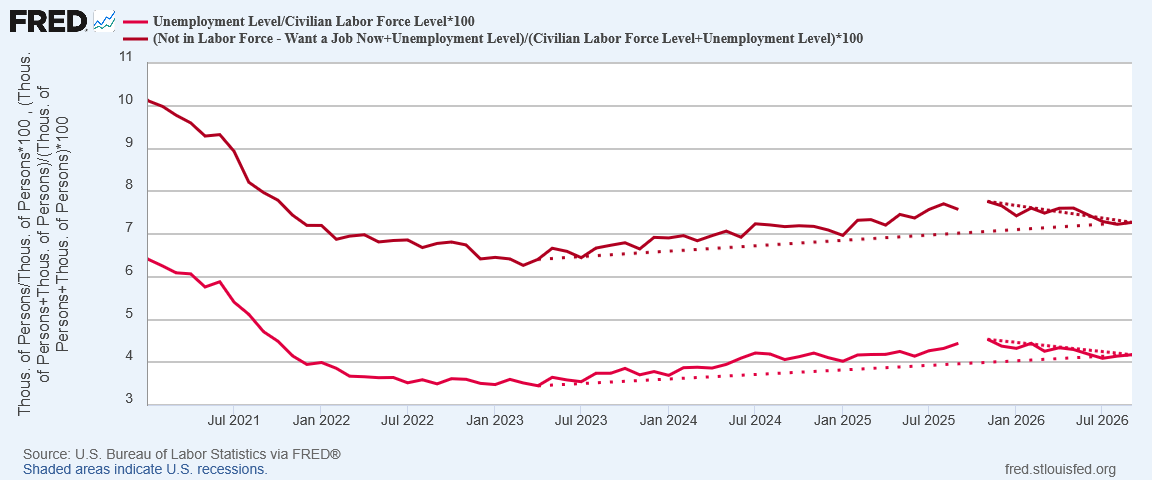
As a direct consequence, the real unemployment rate, while still significantly higher than the official (U-3) unemployment rate, increased by less than the official employment rate.
Since last fall, both the official and real unemployment rates have been trending down, and September is not nearly a large enough rise in unemployment to constitute a trend reversal in unemployment.
We should also note that continuing unemployment claims as reported by the Department of Labor trended down throughout September.
As dismal as the headline payroll number was for September, the Household Survey data was substantially more positive.
Does this mean we will see positive job revisions when the October ESS prints? We should not discount that possibility. When the September JOLTS report comes out in a couple of weeks, we may see some signals about that for October.
Wages And Earnings Did Not Improve
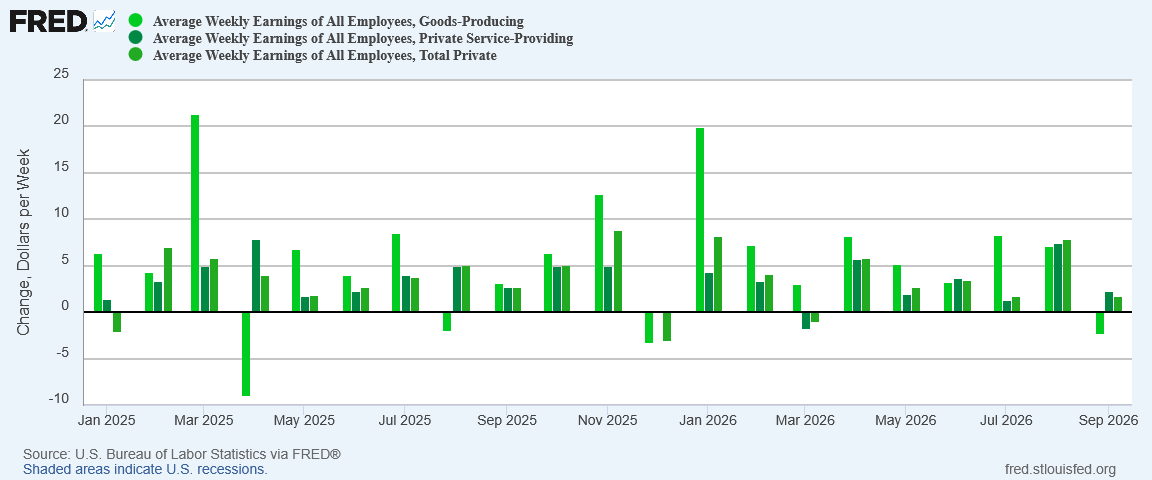
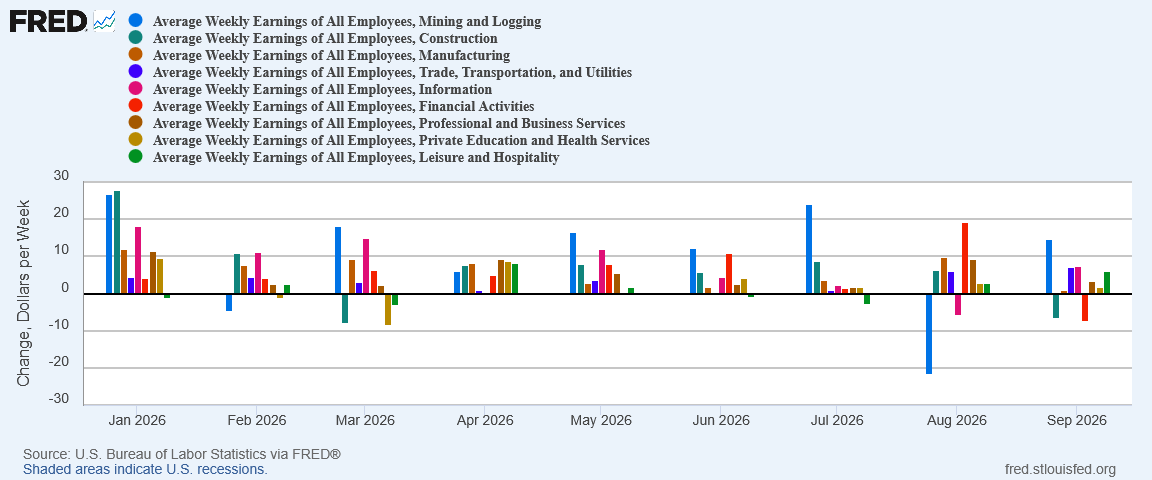
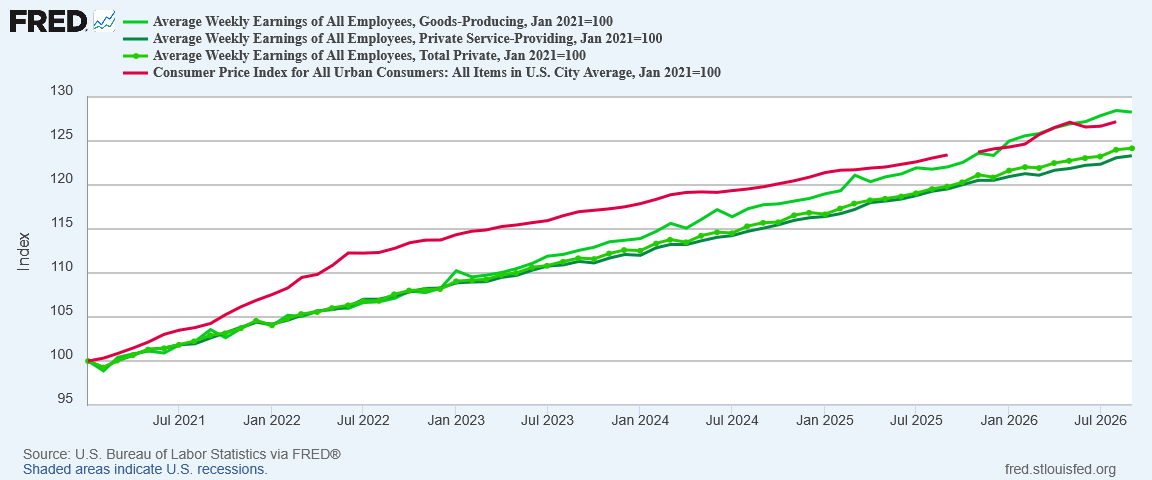
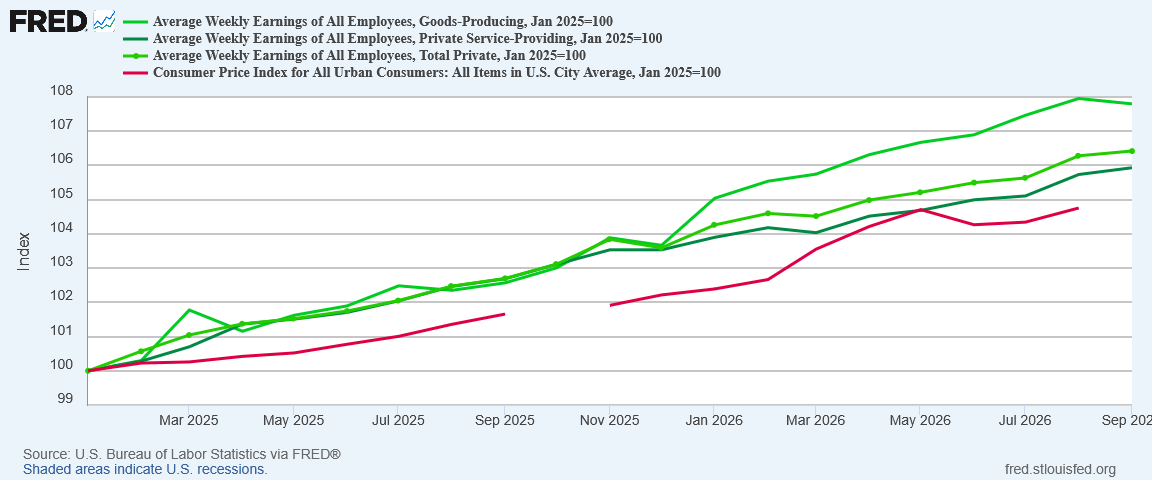
While the Household Survey indicates the jobs outlook for the US may not be as dismal as the headline payroll number indicates, there is no denying that average weekly earnings growth slowed sharply in September.
Goods-producing jobs saw average weekly earnings decline, and overall earnings went from one of the best months in President Trump’s second Administration to one of the worst.
We should note, however, that the lag is still entirely within the realm of the Biden-Harris Reign of Error. Since 2025, average weekly earnings have, for the most part, stayed ahead of inflation.
Goods producing jobs especially have done well for themselves even with the September weekly earnings decline.
We should note that, during the August surge, wages also rose. Soft labor markets are also soft wage markets as well, as it is difficult to push wages up unless there is a significant increase in at least sector-level demand for workers.
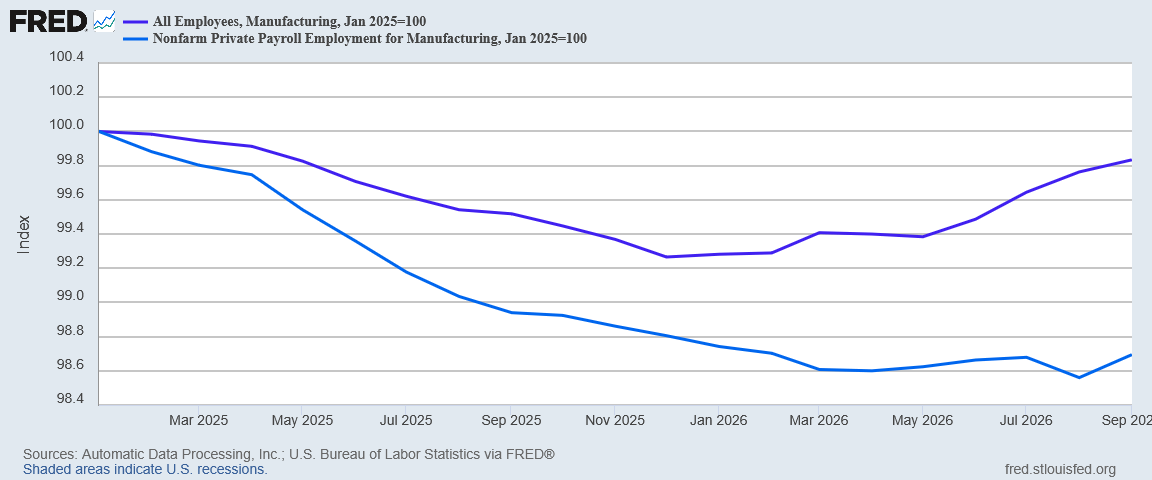
In manufacturing, there has been very little job growth per the ADP report this year, which shows manufacturing as of September at 98.7% of where it was in January 2025. Even the BLS data showed manufacturing at 99.8% of January 2025 levels.
While the BLS data shows a clear recovery trend in 2026, ADP is broadly just hanging on.
Healthcare, on the other hand, showed a solid ~1.4% growth since January 2025.
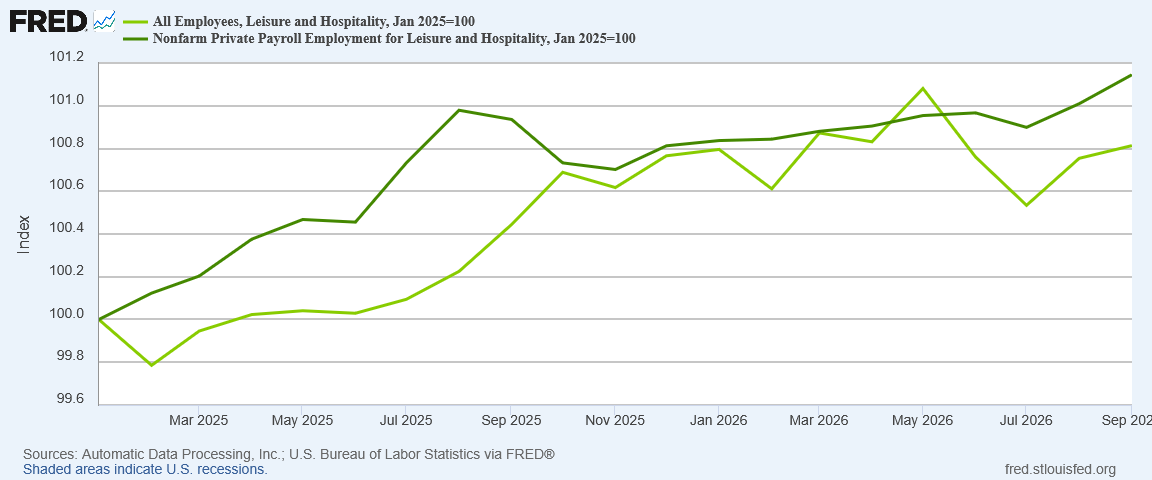
While the sector-level data is uneven (and perhaps naturally so), overall there has been at least some payroll job growth in this country.
In 2025 the BLS reported 161,000 new payroll jobs after corrections were applied. Thus far in 2026, the BLS data has far surpassed the 2025 total new jobs, printing about 612,000 jobs after corrections and revisions have been applied.
However, over the same time frame that payroll jobs have grown, the BLS data also shows the overall employment level to have dropped by 679,000. The civilian labor force has shrunk by about 434,000. The number not in the labor force has risen 3,303,000 over the same period—while the civilian population in the United States has only risen 2,869,000. As a direct result of this, the Employment-Population Ratio for the United States has fallen from 60.1% in January 2025 to 59.2% as of September 2026.
The cumulative effect of the revisions, the arguably bad data, and the labor market trends the data more or less reports, a smaller proportion of the United States population is working now than when Donald Trump returned to the Oval Office.
In 2026, the Trump Economy has reversed a years-long decline in Manufacturing employment, and might even succeed in recovering all the Manufacturing jobs lost in 2025. Given the state of the economy and the duration of the jobs recession when President Trump returned to the Oval Office, there is a measure of success in that.
Yet there is no escaping the reality, often overlooked month on month, that since January 2025, the Trump Economy has lost workers, and has at the very least not provided nearly enough jobs to compensate for the population growth since then. That is a track record which invites comparisons to 2023 and 2024, when employment growth under Biden largely stopped (thus triggering the jobs recession).
In 2026, there have been clear sector level job gains in the US economy. Overall, the US economy is showing 773,000 jobs added since January 2025, with the bulk of those jobs coming year to date in 2026.
A jobs recovery is underway in the United States. The accelerated pace of payroll job growth for 2026 over 2025 clearly shows that. However, just as with wages recovering from the 2022 hyperinflation cycle, a full jobs recovery is sure to be a long and relatively drawn out process, during which time US jobs markets are going to remain more frail than many economic “experts” such as those at the Federal Reserve want to admit.
With just 29,000 payroll jobs added in September, and 60,000 jobs from the prior two months erased, the September Employment Situation Summary is a reminder of just how frail US job markets continue to be.
Every article I publish takes time, care, and independence. A paid subscription fuels that work and shields it from outside pressure. If you’re able, join me today.
I think you’re right about the data being of suspicious quality, Peter. I suspect some fundamental changes have been made since Trump implemented new policies that effectively mean all of the different agencies and surveys are comparing the apples of the Biden years to the oranges of the Trump changes. The problem is, we can’t accurately crunch the numbers without knowing how the Authorities have changed or reinterpreted the underlying definitions, metrics, requirements, etc.
We know that under Biden, Human Resources departments were required to follow DEI mandates, which Trump has now eliminated. We know that Trump has changed policies on worker visas and other details of hiring. We know that Trump has deported somewhere in excess of one million people, which will skew hiring in ways that may not be comparable to previous eras. How, exactly, are the data-collecting agencies dealing with all of these changes in their data collections, algorithms, adjustments, and so on? We don’t know. Anyone who has taken a course in statistics knows you can massage data in numerous ways to get different final results in your analysis. We don’t know what changes the agencies have made in their data analysis. Some agencies may have kept the definitions, algorithms, and metrics essentially unchanged, while others may have tweaked and modified considerably. The result is that they are now getting analysis conclusions that don’t agree. I don’t know how you could track this down, Peter. Probably someone with access to all of the government algorithms would have to do it.
All we can conclude at this point regarding employment is that Trump needs to do better.



I am going to briefly remind everyone of the ground rules for commenting on my articles:
Be civil and respectful. Hateful and bigoted commentary will simply be removed without warning.
No Spam. If I think the comment is spam it will be removed without warning.
If I decide something is rude, it will be deleted. Period. End of Sentence. End of Discussion.
If I see someone posting a comment to complain about their rudeness being deleted, they will be banned. Period. End of Sentence. End of Discussion.
Here we are civil and respectful towards each other--and here I am the sole arbiter of what constitutes "civil and respectful."
I think you’re right about the data being of suspicious quality, Peter. I suspect some fundamental changes have been made since Trump implemented new policies that effectively mean all of the different agencies and surveys are comparing the apples of the Biden years to the oranges of the Trump changes. The problem is, we can’t accurately crunch the numbers without knowing how the Authorities have changed or reinterpreted the underlying definitions, metrics, requirements, etc.
We know that under Biden, Human Resources departments were required to follow DEI mandates, which Trump has now eliminated. We know that Trump has changed policies on worker visas and other details of hiring. We know that Trump has deported somewhere in excess of one million people, which will skew hiring in ways that may not be comparable to previous eras. How, exactly, are the data-collecting agencies dealing with all of these changes in their data collections, algorithms, adjustments, and so on? We don’t know. Anyone who has taken a course in statistics knows you can massage data in numerous ways to get different final results in your analysis. We don’t know what changes the agencies have made in their data analysis. Some agencies may have kept the definitions, algorithms, and metrics essentially unchanged, while others may have tweaked and modified considerably. The result is that they are now getting analysis conclusions that don’t agree. I don’t know how you could track this down, Peter. Probably someone with access to all of the government algorithms would have to do it.
All we can conclude at this point regarding employment is that Trump needs to do better.