Victory Over Inflation? Not So Fast
The BEA Is Playing Fast And Loose With The Numbers
There are lies, damned lies, and then there are government economic statistics.
Between the final revision to the third quarter GDP estimates and the November Personal Income and Outlays Report, the Bureau of Economic Analysis has managed to assemble a fudge-fest of numbers that are either staggeringly cynical in their manipulation or frighteningly incompetent (or, perhaps, both).
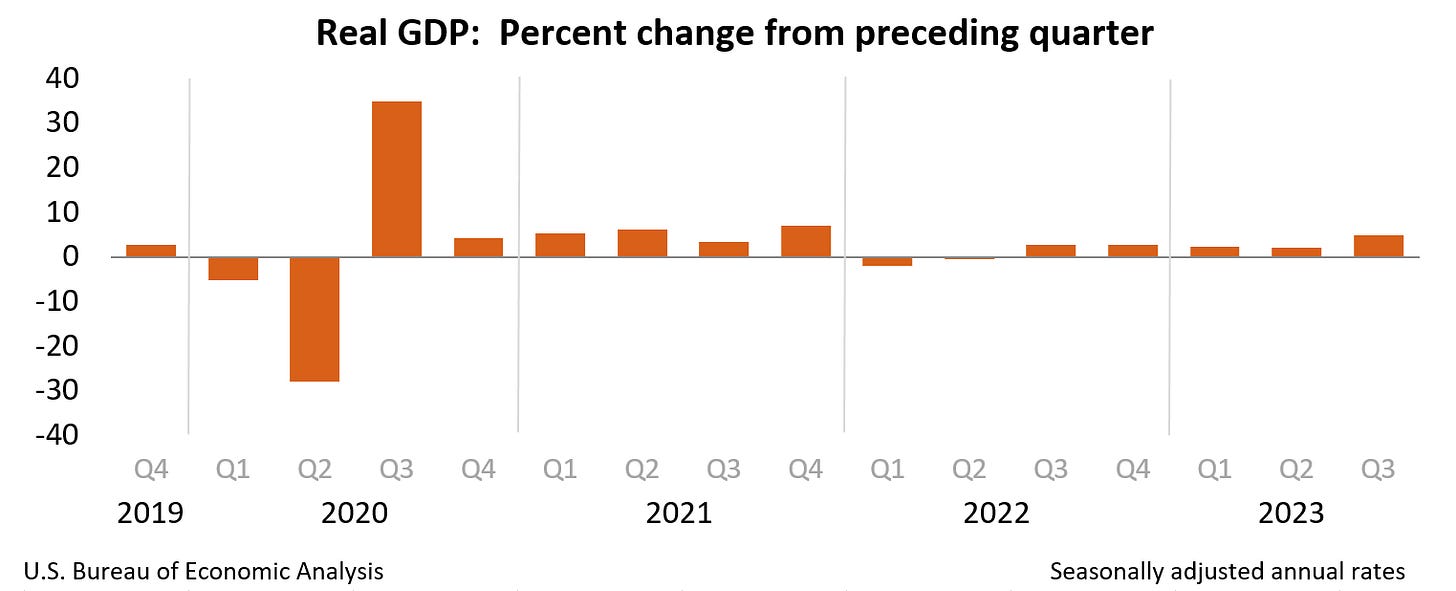
Real gross domestic product (GDP) increased at an annual rate of 4.9 percent in the third quarter of 2023 (table 1), according to the "third" estimate released by the Bureau of Economic Analysis. In the second quarter, real GDP increased 2.1 percent.
The GDP estimate released today is based on more complete source data than were available for the "second" estimate issued last month. In the second estimate, the increase in real GDP was 5.2 percent. The update primarily reflected a downward revision to consumer spending. Imports, which are a subtraction in the calculation of GDP, were revised down (refer to "Updates to GDP")
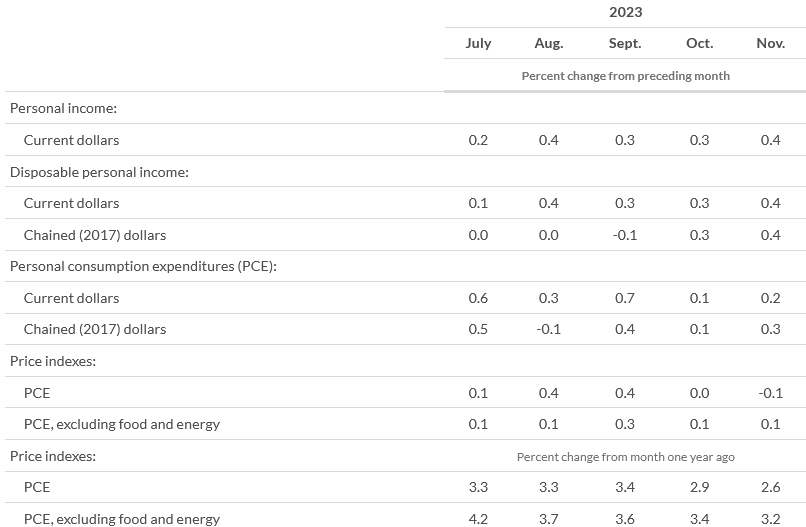
From the preceding month, the PCE price index for November decreased 0.1 percent (table 5). Prices for goods decreased 0.7 percent and prices for services increased 0.2 percent. Food prices decreased 0.1 percent and energy prices decreased 2.7 percent. Excluding food and energy, the PCE price index increased 0.1 percent. Detailed monthly PCE price indexes can be found on Table 2.4.4U.
From the same month one year ago, the PCE price index for November increased 2.6 percent (table 7). Prices for services increased 4.1 percent and prices for goods decreased 0.3 percent. Food prices increased 1.8 percent and energy prices decreased 6.0 percent. Excluding food and energy, the PCE price index increased 3.2 percent from one year ago.
By itself, there is little changed in the GDP estimates from the second revision, beyond the reduction in overall estimated growth from 5.2% to 4.9%. The estimate’s flaws and logical gaps remain very much as I covered last month.
A good economic report would be one that showed shrinking government spending and expanding private investment. For the third quarter, the BEA gave us close to the polar opposite of that good economic report.
However, corporate media seized on one aspect of the GDP report that is jarring because it is completely contradicted by the Personal Income and Outlays Report. The GDP report shows core inflation for the third quarter at 2%, but the Personal Income and Outlays Report shows the year on year inflation throughout the third quarter to be much higher than that.
These are not just lies. These are not just damned lies. These are economic statistics—and we need to regard them accordingly.
What we are seeing between the two reports is a very subtle manipulation of the inflation data. One “annualizes” the quarter’s inflation rate, while the other compares monthly (and, by extrapolation, quarterly) inflation rates to the same period(s) of the prior year.
Thus the GDP report can state that the “PCE Price Index” less food and energy prints at 2% for the third quarter of 2023, while the PCE report published the very next day prints completely different numbers.
The price index for gross domestic purchases increased 2.9 percent in the third quarter, a downward revision of 0.1 percentage point from the previous estimate (table 4). The personal consumption expenditures (PCE) price index increased 2.6 percent, a downward revision of 0.2 percentage point. Excluding food and energy prices, the PCE price index increased 2.0 percent, a downward revision of 0.3 percentage point.
The Personal Income and Outlays Report for November shows the year on year percent change for the PCE Price Index less food and energy to be considerably higher throughout the third quarter of 2023 (July, August, and September).
To understand the difference, we must recall that the process of “annualizing” the data is functionally that of compounding interest—something I touched upon earlier this year when discussing the Q4 2022 GDP estimates.
A quick overview of compounding is in order. The typical compounding scenario is the interest that is applied to a loan or to a savings account. The idea is to recognize the interest gain in each interval going forward until a set number of periods (i.e., the 12 months of a year) is reached.
This compounded rate is the “annual rate” when the total number of periods equals one year. This is slightly different from a year on year presentation, which merely works on the difference between a value today and a value one year ago.
The formula for calculating compound interest1 is as follows:
Compound interest = total amount of principal and interest in future (or future value) minus principal amount at present (or present value)
Where CI is the total amount of compound interest, P is the principal of the loan or deposit, i is the periodic interest rate, and n is the number of periods.
From this compound interest formula we can extract the formula for converting a quarterly growth rate into the equivalent compounded annual rate, which is simply the compound interest calculation without the principal:
Where R is the compounded growth rate, i is the periodic growth rate, and n is the number of periods.
If we take the average month on month inflation rate across the third quarter as reported by the PCE Price Index, for headline inflation we have a value i of 0.641% (0.00641). With four quarters in a year, n becomes 4, and the resultant value for R in the compounded growth rate formula is 0.0259, or 2.6%.
For core inflation we rerun the same calculation but with i set to 0.00507, resulting in R of 0.0204, or 2%.
The FRED system actually performs this calculation for us, thus allowing us to start with the quarterly PCE inflation chart…
…and end with an annualized chart of the same data.
Why is this reporting difference disingenuous to say the very least? Two reasons:
First, the monthly reporting from both the Bureau of Labor Statistics and the Bureau of Economic Analysis do not annualize the numbers, but report the year on year change.
Second, by conflating the two without making clear explanation for the different treatment of the data, we arrive at a significantly different measurement of consumer price inflation.
Because of the maths involved, when consumer price inflation is rising, as it was from the end of the Pandemic Panic Recession until the summer of 2022, annualized inflation rates tend to be higher than the year on year inflation rates. Once disinflation sets in, as it did during the summer of 2022, annualized inflation rates tend to be lower than year on year inflation rates.
Unsurprisingly, corporate media took the GDP report’s estimates on PCE inflation at face value, without considering the possibility the annualizing methods might result in understating actual consumer price inflation.
The Federal Reserve's primary inflation rate, the core PCE price index, slid to a 2% annualized rate in the third quarter, new Commerce Department revisions revealed on Thursday. The surprisingly tepid inflation data come ahead of Friday's release of November inflation data that economists expect to be equally tame, if not more so. The data sent the S&P 500 higher and the 10-year Treasury yield lower.
The fall in inflation to the Fed's 2% target in Q3 on an annualized basis even amid strong economic growth helps explain why policymakers are beginning to worry less about an inflation resurgence.
There is a logical flaw as well with the annualized numbers. Implicit in the compounding formula is the presumption that all periods are equal. In other words, annualizing the quarterly inflation rate presumes that every quarter has the same quarterly inflation rate for both headline and core inflation.
We only have to look at the month on month percent changes in the PCE Price Index to see how flatly wrong that presumption is.
This is why the year on year numbers tend to be a more realistic assessment of the longer-term trend in inflation. Rather than interpolating a steady state across a full year, the year on year calculation uses the actual difference between two discrete time periods.
While the month on month and year on year percent changes in the PCE Price Index are useful for understanding the current state of consumer price inflation as of the last period measured, we should also keep in mind the total magnitude of change from a given time period, in order to apprehend how much prices have risen from that time period.
Thus while the year on year percent change in the PCE Price Index since the Pandemic Panic Recession looks like this for both headline and core inflation….
…if we index that same data to the end of the Pandemic Panic Recession we see that consumer prices have risen 16.8% for headline inflation, and 15.2% for core inflation.
In addition to the flaws with annualizing the inflation data, we should also recognize that, once again, month on month core inflation has significantly outpaced headline inflation. In November, headline inflation actually declined by 0.07%—outright deflation—while core inflation remained in disinflation at 0.6%.
There is no mystery as to why this is: energy prices have fallen. We can see their impact when we assess the energy price subindex against both the headline and core inflation metrics.
If we index all three metrics to the end of the Pandemic Panic Recession, we see that energy price deflation set in after May, 2022, and has been pushing the broader price metrics down ever since.
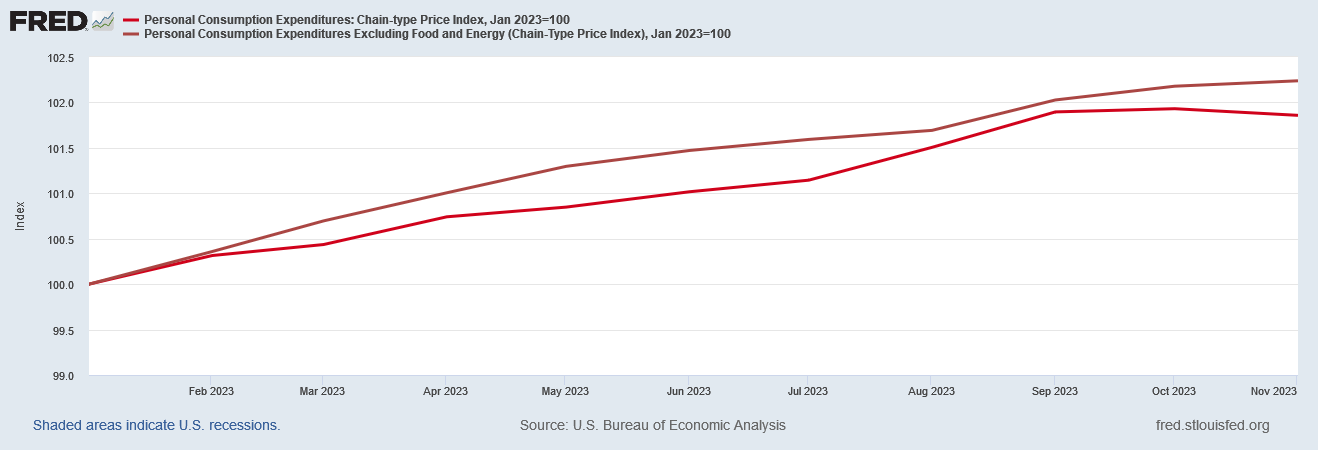
If we advance the base period to Janaury 2023, we see that the November consumer price deflation recorded in the headline metric can be attributed almost entirely to energy price deflation.
Falling energy prices are the reason that headline inflation has consistently printed below core inflation all year.
This should also stand as a stark reminder that the inflation phenomenon is a far more nuanced one than a single number can portray. Not only is core inflation outpaced headline inflation since the start of 2023, but when we index the subindices within the PCE Price Index to January 2023, we see that service price inflation continues almost unabated, while durable goods have been in price deflation for most of the year.
For corporate media to look at the 2% annualized core inflation rate from the 3rd quarter and declare the Federal Reserve’s mission to be accomplished is not merely incompetent journalism, it is ignorant and illiterate journalism, as it completely misses entire swaths of crucial data which change the overall picture on inflation considerably.
What gets lost in the corporate media narrative on inflation, and what neither the BLS nor the BEA have done much to rectify in their press releases, is the degree to which inflation is not merely an increase in consumer prices, but also a distortion of them relative to each other.
A quick look at the relative growth in consumer prices across just the few categories within the PCE Price Index since the Pandemic Panic Recession shows how prices for various goods as well as services have shifted.
That chart does not include the far more volatile food and energy subindices—but which are obviously essential consumer goods as well, and which would show even further distortions relative to other price categories.
The BEA subtly encourages corporate media to overlook such contexts on inflation with their disingenuous shifting of reporting frameworks between GDP and PCE Price Index reports. While it may make for great politics to allow the media to point to a metric and say “hooray, 2% inflation has been reached!”, that narrative does not match the reality of the current month’s price inflations (or deflations), and does not accurately portray what is happening with all prices.
For their part, corporate media is supposed to know better. Financial and economics reporters are presumed to be more than a little conversant with these metrics and what they properly mean. If they are going to comment on the BEA press releases, the least they can do is properly clarify the different reporting contexts the BEA is using, and the ramifications of the reporting shifts.
Instead, we are saddled with a supine and acquiescent media that does not ask hard questions or interrogate the “official” data. Rather, they simply regurgitate the numbers they are given and make that the extent of their reporting.
There are lies, damned lies, and government economic statistics. Take heed and beware, for corporate media once again has proven itself taken in by all three.


I'll say it again, Bidenomics sucks.
You are so good at exposing the pathways of manipulation of data, Mr. Kust. Is it overly cynical of me to assume that most of this government manipulation is directly or indirectly the result of the current Administration’s attempt to win the next election?