

Winter Is Coming For Inflation
November CPI Summary Shows Disinflation And Deflation Across The Board

“Winter is coming.”
That supremely memetic quote from George R. R. Martin’s Game of Thrones captures perfectly what we are seeing in the first Consumer Price Index Summary since the Silly Schumer Shutdown of October. Far from a print that shows inflation running “hot”, the November summary shows consumer price inflation cooling substantially.
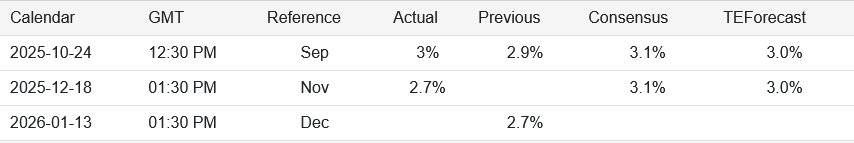
The Consumer Price Index for All Urban Consumers (CPI-U) increased 0.2 percent on a seasonally adjusted basis over the 2 months from September 2025 to November 2025, the U.S. Bureau of Labor Statistics reported today. Over the last 12 months, the all items index increased 2.7 percent before seasonal adjustment. BLS did not collect survey data for October 2025 due to a lapse in appropriations.
There is no denying what the data shows: inflation is cooling, and some prices are even falling—not just disinflation but outright deflation.
The September data was something of a muddled mess, but November’s is crystal clear: inflation is easing and some prices are falling. In virtually every major pricing category, the inflation rate either slowed substantially or even reversed into actual deflation.
Coming on the heels of President Trump’s 2026 mid-term election campaign kickoff speech Wednesday night, the CPI print was undoubtedly very welcome news for the Trump Administration—and very unwelcome news for the TDS-infected governors of the Federal Reserve, who once again saw their “Trump’s tariffs are inflationary” rhetoric get completely and thoroughly debunked.
How much we can read into the data is somewhat uncertain, however, because in October the Bureau of Labor Statistics did not capture most of the monthly pricing data it uses to construct the CPI and various subindices.
For presentation purposes, I have taken the liberty of interpolating the October values as the midpoint between September and November for most of the data. This has the effect of making percent changes identical for October and November, but it has the saving grace of being systemically applied to every pertinent data set. Some accuracy is being sacrificed, but reporting consistency is being maintained.
“Experts” Were Caught Off Guard
One notable aspect of the November CPI data is that it was much better than experts in both Washington DC and on Wall Street expected.
Wall Street’s consensus was a somewhat gloomy 3.1% for November. The financial site Trading Economics projected the year on year inflation rate at 3%.
Even the Cleveland Fed’s InflationNow nowcast projected consumer price inflation would print around 3%.
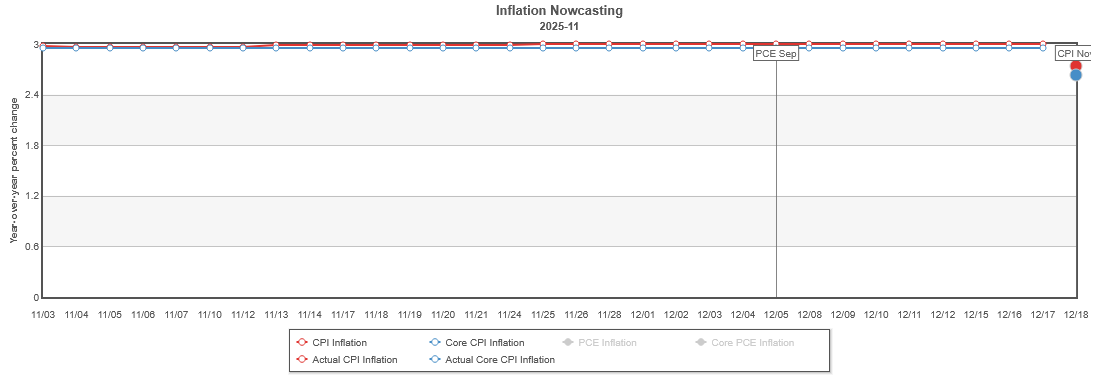
November was one of the rare months when the Cleveland Fed missed the mark by a large amount.
Yet the lower inflation rate is perhaps less surprising than the “experts” want to make it out to be. After warming slightly over the summer months, Headline CPI started cooling off after August.
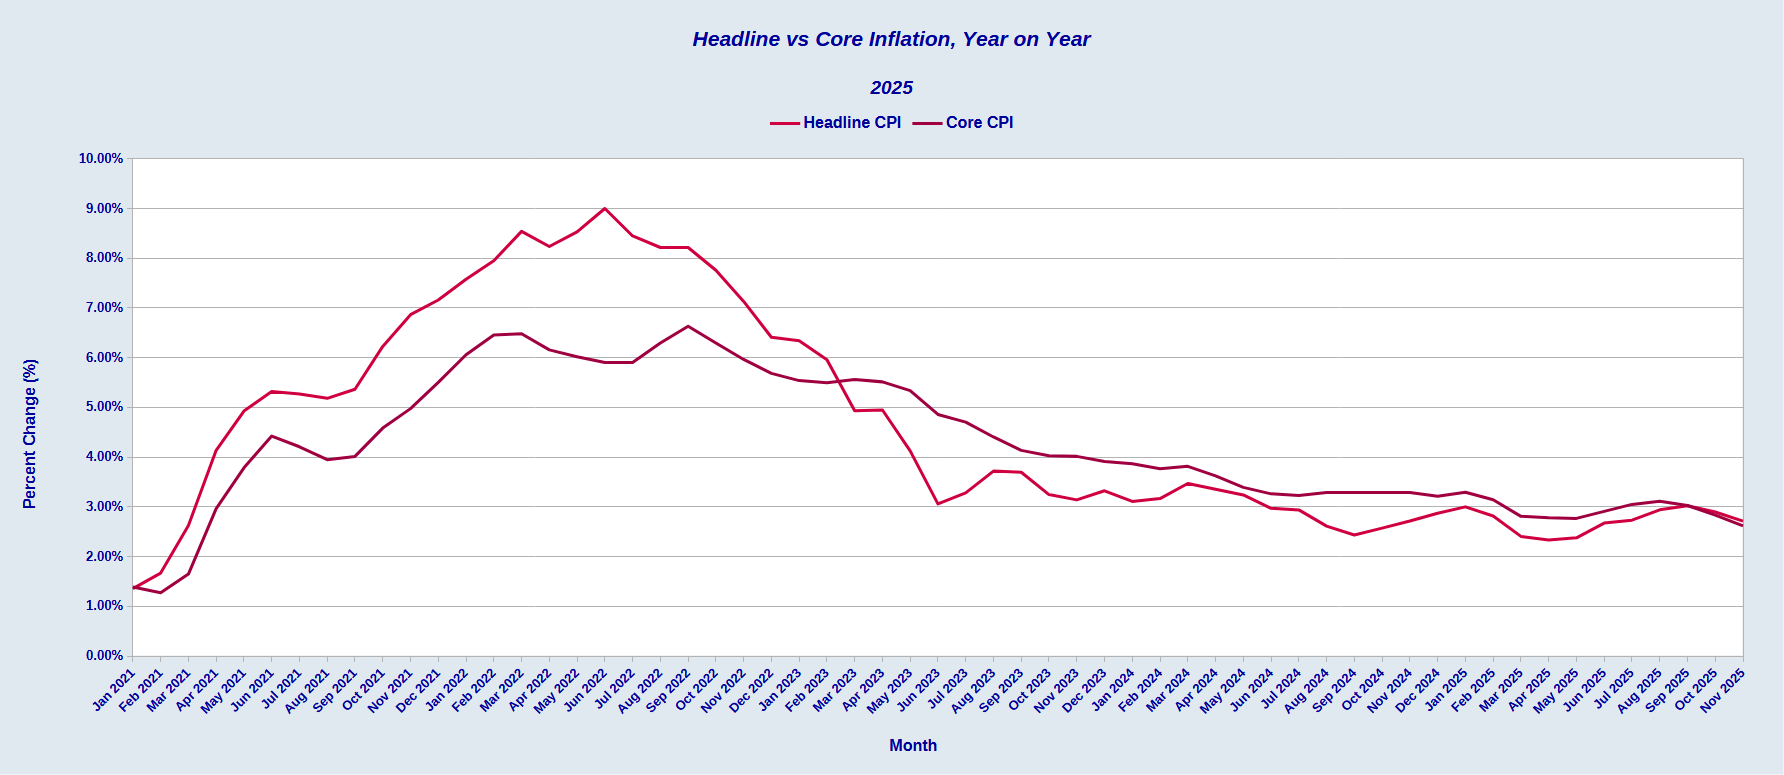
Even without the advantage of October’s actual data, there are clear signs of a renewed cooling trend. Consumer prices are for now rising less.
Even the month on month data is encouraging.
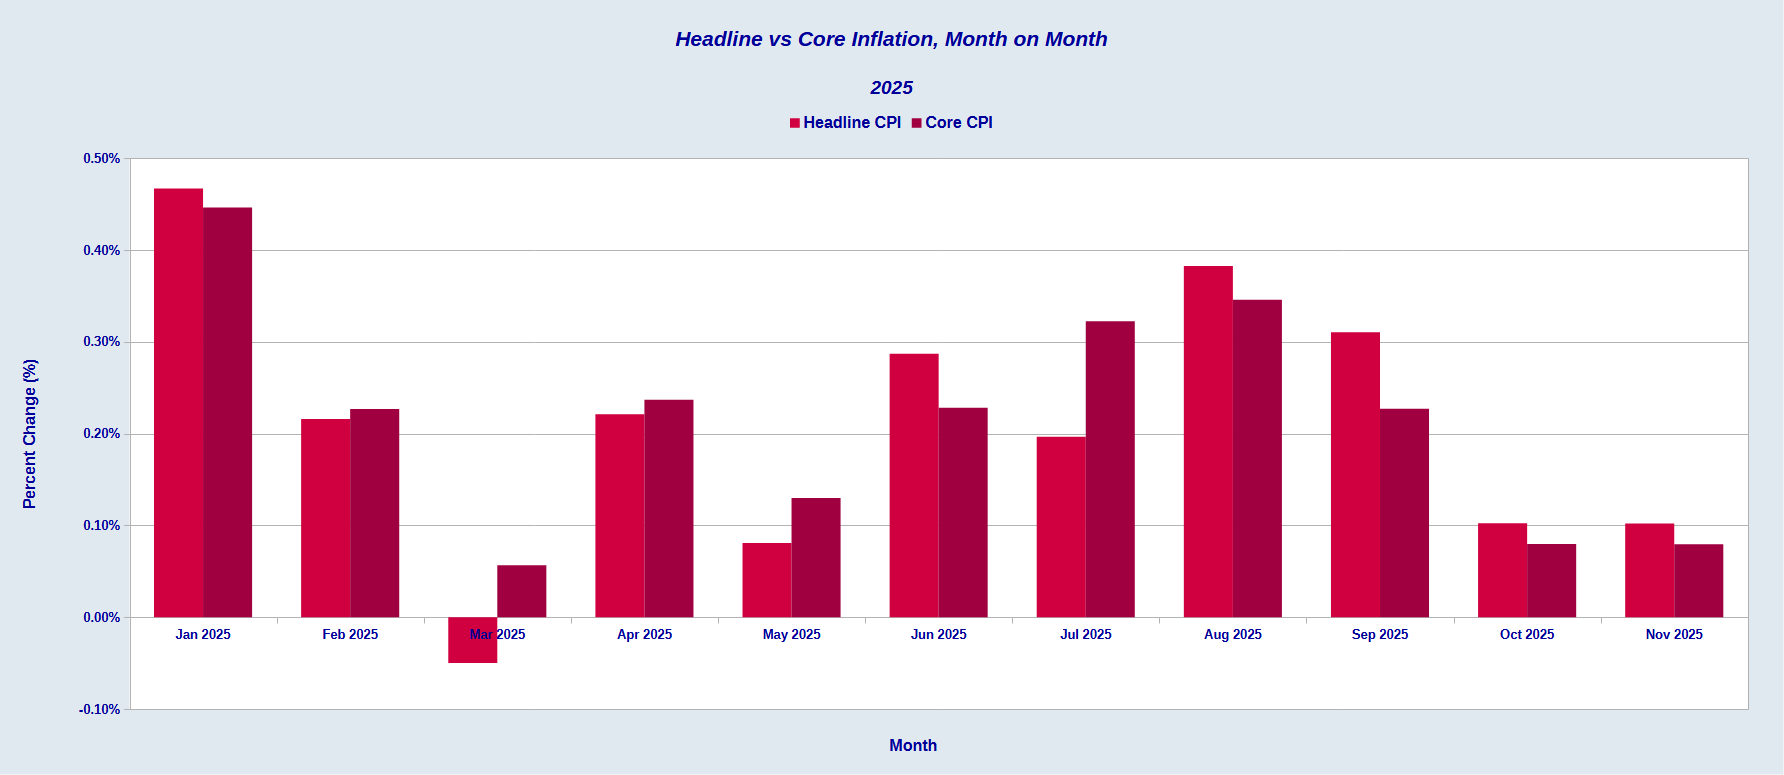
Even with an interpolated October value, one data point is irrefutable: between September and November the inflation rate retreated 0.3pp year on year. Even across a two-month interval, that is a much larger decline than we have seen since the early months of 2025.
Because the BLS did not capture October data, we will be about another month before we can ascertain if August represents a downward inflection point where disinflation picks up speed. Still, the November data is positive enough that we can begin to wonder if that is the case.
Drilling Down Is Still Good News
Unlike in September, the trajectory of the data does not change as we drill down into the various subindices of the CPI. Disinflation or deflation occurred in October/November in nearly every subcomponent of the main index.
Energy price inflation printed at 0.5pp month on month since September.
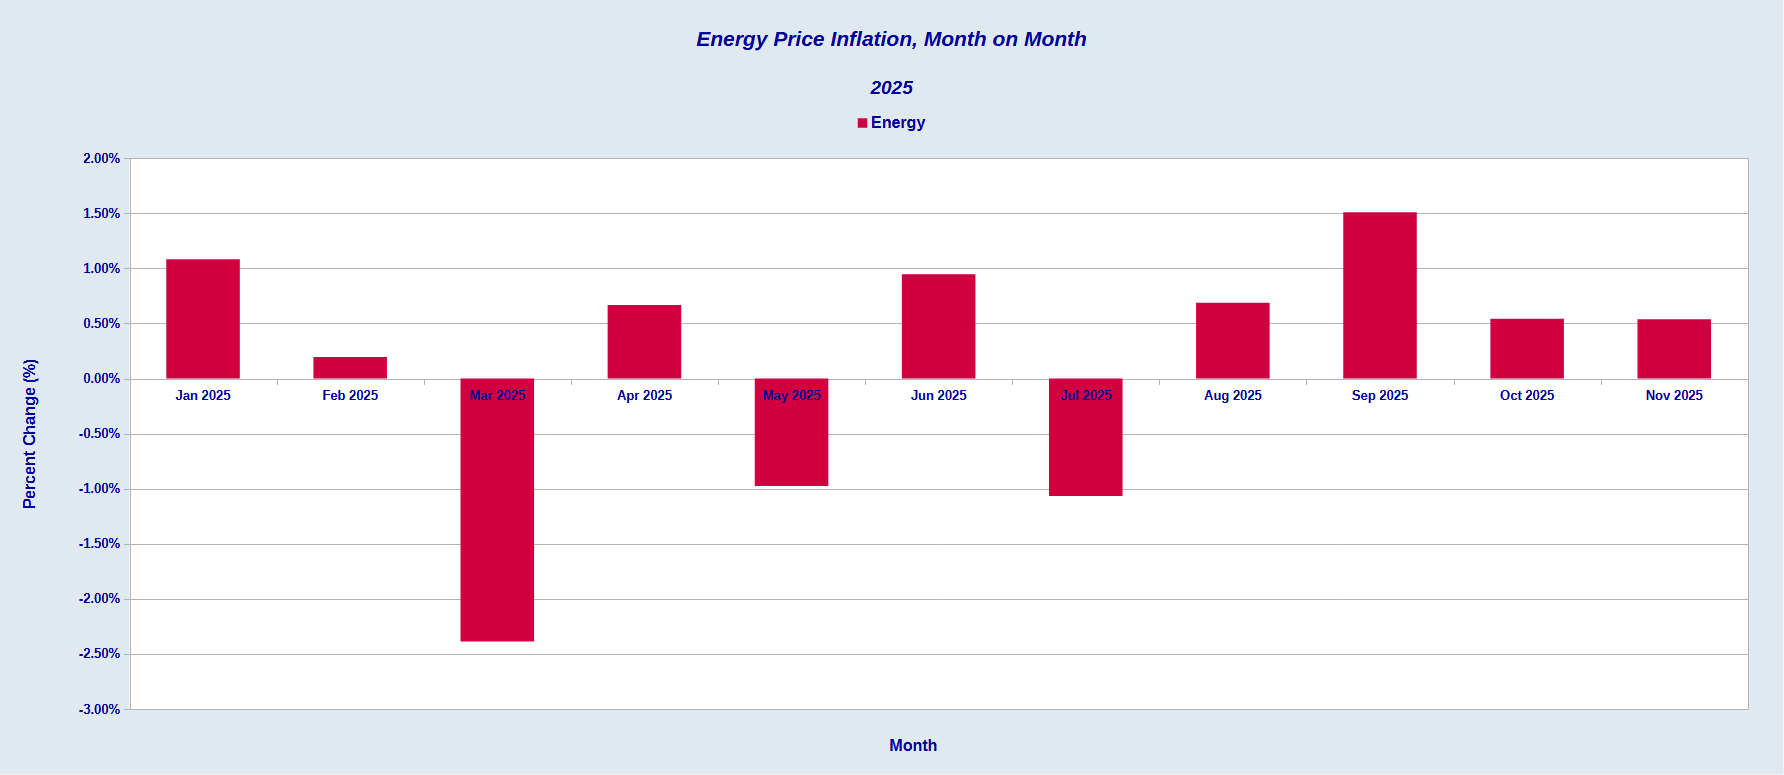
While this is not the deflationary change we have seen in multiple months since the 2022 hyperinflation cycle, it still represents a full percentage point drop from September.
Even more encouraging is that much of the disinflation trend continued down even into the main components for calculating Energy Price inflation.
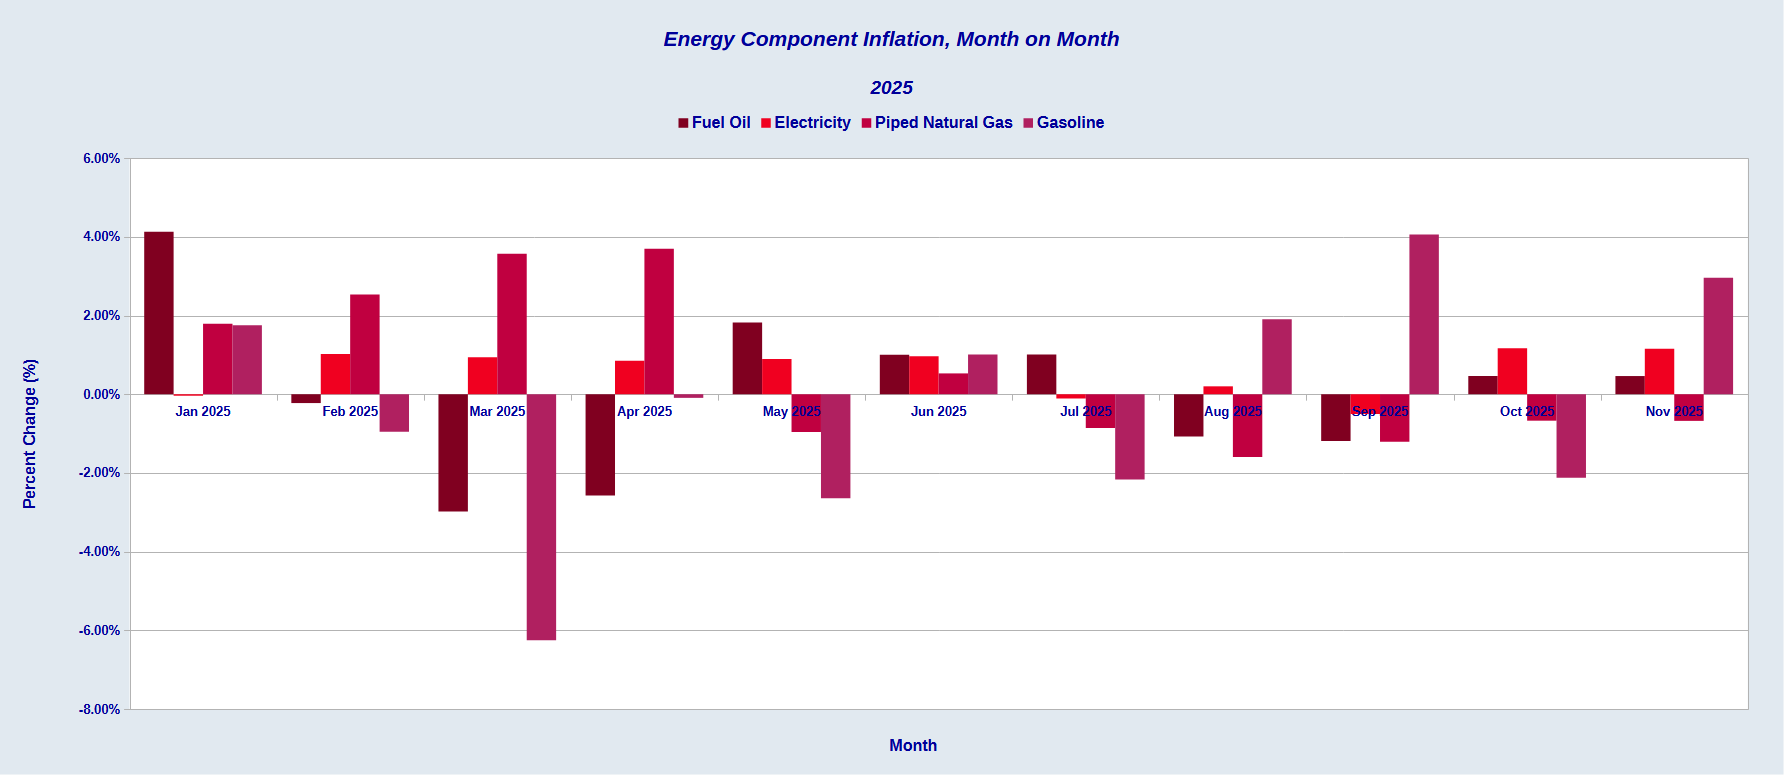
For most of 2025, gasoline prices especially have been in deflation. Even Fuel Oil and Electricity, although they ticked up in October and November, have still spent the bulk of the year either at or near the zero level. Natural gas has been in price deflation since early on in the year.
Food price inflation also slowed significantly since September.
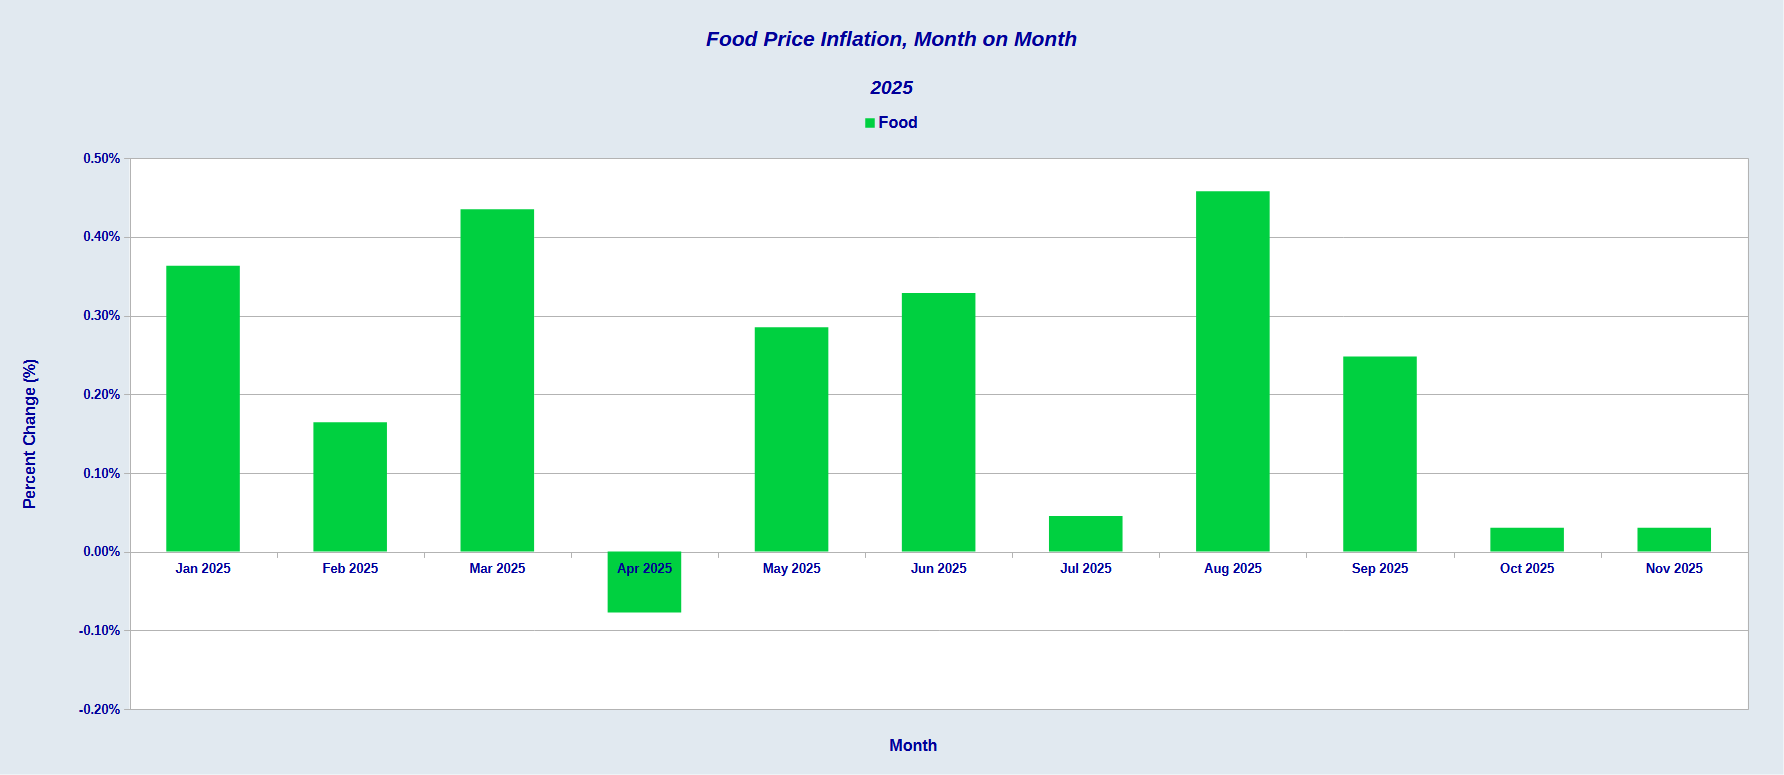
Although food is historically less volatile than energy, dropping from 0.25% in September to 0.03% for October and November, is, relatively speaking, a fairly sizeable inflation reduction. Food prices rose in October and November at roughly 1/10 the rate they rose in September.
While energy and food prices showed significantly slower deflation over the past two months, for durable and nondurable goods, the trend was outright deflation, while services saw increased disinflation.


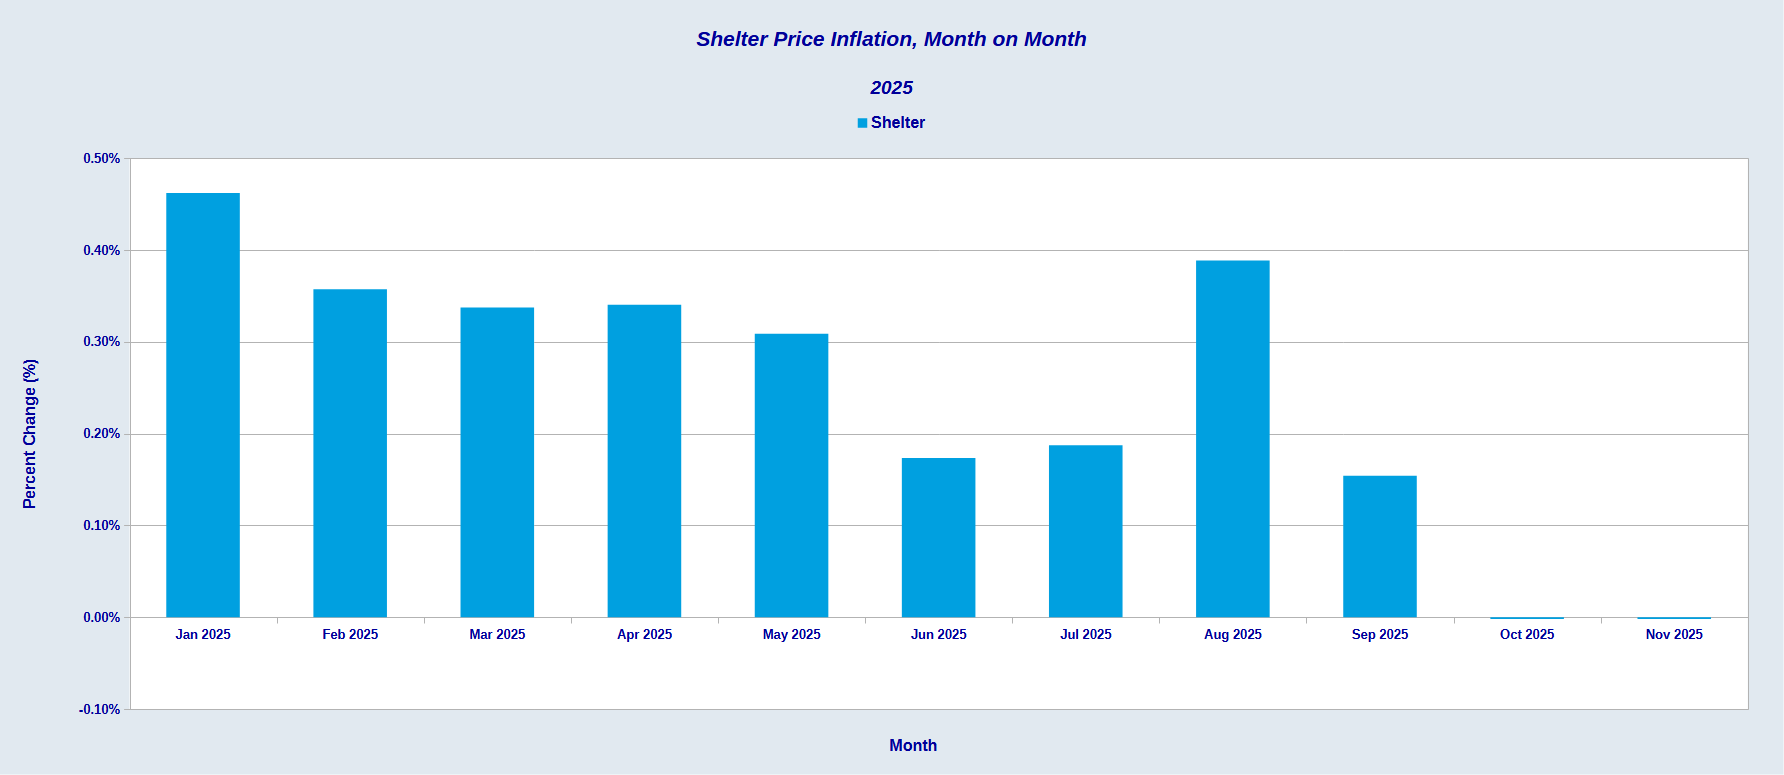
Surprisingly, shelter was completely break-even, with neither inflation nor deflation during October and November.
As with other components within the Consumer Price Index, inflation for these elements was down across the board. The disinflation/deflation shift was universal throughout the CPI data.
At this juncture, it scarcely warrants mentioning that the drop in durable and nondurable goods prices once again puts the lie to any presumption from any of the many economic “experts” in both Wall Street and corporate media that President Trump’s Liberation Day tariffs are in any way a significant contributor to inflation. When goods prices are in deflation, it is mathematically impossible for tariffs to be causing inflation.
For the umpteenth month in a row, Jerome “Too Late” Powell’s favorite anti-Trump talking point is completely debunked and discredited.
A Win For Trump On “Affordability.”
There is no doubt that the CPI report was very good news for Donald Trump. Just the night before, during his live address from the White House, President Trump claimed considerable credit for changes in prices and inflation over the past eleven month.

Under the Biden administration, car prices rose 22 percent, and in many states, 30 percent or more. Gasoline rose 30 to 50 percent. Hotel rates rose 37 percent. Airfares rose 31 percent.
Now, under our leadership, they are all coming down and coming down fast. Democrat politicians also sent the cost of grocery soaring, but we are solving that, too. The price of a Thanksgiving turkey was down 33 percent compared to the Biden last year. The price of eggs is down 82% since March, and everything else is falling rapidly. And it’s not done yet, but, boy, are we making progress. Nobody can believe what’s going on.
Lacking any early insight into the October/November CPI data, the New York Times was only too happy to declare President Trump’s claims “false”.
Mr. Trump was also wrong that “everything else is falling rapidly.” In fact, the Consumer Price Index rose by 3 percent in September.
Inflation was at 3% in September, and 2.7% in November. Donald Trump will point to that shift and argue—with some validity—that prices are indeed “falling rapidly.”
The drop in inflation, particularly as the shift is sustained as one drills into the data, undeniably works to Donald Trump’s advantage when discussing corporate media’s new favorite buzz word, “affordability.”
When inflation drops 0.3 percentage points year on year, that is a positive development for making various things more affordable. If inflation slows down enough, wage increases start to offset price hikes in goods and services from that inflation.
One economic fact cannot be disputed: inflation has, overall, moved lower on President Trump’s watch. That was demonstrably true even in September, and the latest data only amplifies that reality.
The CPI data thus is a clear win for Donald Trump on “affordability.”
Inflation is falling under President Trump. The hyperinflation cycle happened on Joe Biden’s watch. Donald Trump’s political strategy has been and will continue to be one of hammering those two irrefutable points at every turn, and to use them to put Democrats on the defensive wherever he can.
That strategy was made that much easier with the latest inflation data.
We should be mindful of the larger economic realities, such as the ongoing and even deteriorating nature of the years-long jobs recession in this country. The CPI data does not alter that aspect of the economy in the slightest. A jobs recession does not simply vanish merely because inflation is cooling. We should not delude ourselves that a good inflation report confirms Trumpian rhetoric about America being in a “Golden Age”.
We are not in a “Golden Age” and even the inflation data does not show America is in a “Golden Age.”
For October and November at least, however, we are in an economy where inflation is being slowly brought under control, where energy prices are rising more slowly, and goods prices are actually falling.
We are in an economy where inflation is cooling and is continuing to cool.
We are in an economy where, just as in Game of Thrones, “winter is coming” for inflation.
That is a nice bit of news to get this close to Christmas.
I’m delighted that the inflation rate is decreasing, of course. I’m wondering about the deflation in the prices of goods, however.
During the COVID lockdown years, when Biden was throwing around trillions of dollars and every normal metric of the economy was discombobulated, inflation soared. Now that we are in a more “normal” economy, I don’t know how much of change is due to macroeconomic corrections to the insanity of those Biden years. Peter, are you concerned about the deflation signs, or do they seem to be more of a longterm correction?
What, if any, is the significance of the designation of urban consumers? Urban as compared to whom? Also I am curious as to your thoughts on the impact, if any, of the removal of undocumented persons on inflation, housing, and labor data.