Wisconsin Polling: A Tale Of Two States
AtlasIntel Polling Reminds Us Why States Matter
With Pennsylvania having shown how state polling data can and often does mirror nationwide poll numbers, it is important we look at a contrarian case as well, because not every state conforms to the nationwide numbers in a poll series.
As AtlasIntel’s Wisconsin Poll on the US Presidential Election 2024 shows, states can vary significantly not just from the nationwide polling but also from each other.
Just as the Pennsylania poll shows Donald Trump up by 3pp, AtlasIntel’s Wisconsin polling shows Kamala Harris with a 0.7pp advantage.
These polls were conducted at the same time by the same entity using the same overall methodology. Any variations we see between the two polls, therefore, are highly likely to be reflections in voter positions between Wisconsin and Pennsylvania.
Let’s drill down into the Wisconsin Polling, and see if the data will illuminate why there is a 4pp spread between Wisconsin and Pennsylvania.
I will confess to having developed a certain fondness for AtlasIntel’s polling. More specifically, I like their slide-deck presentation of the results. Their poll data is well organized, with clear and insightful crosstabs.
This is one reason I am inclined to put a measure of confidence in their results. An organization that is taking the time to prepare a good report is an organization that takes the data seriously—and that is an organization that, in my estimation, is more likely to conduct a quality poll. While that is a highly subjective way to assess poll numbers, it will shed some light for those readers wondering why I am writing about a third AtlasIntel poll.
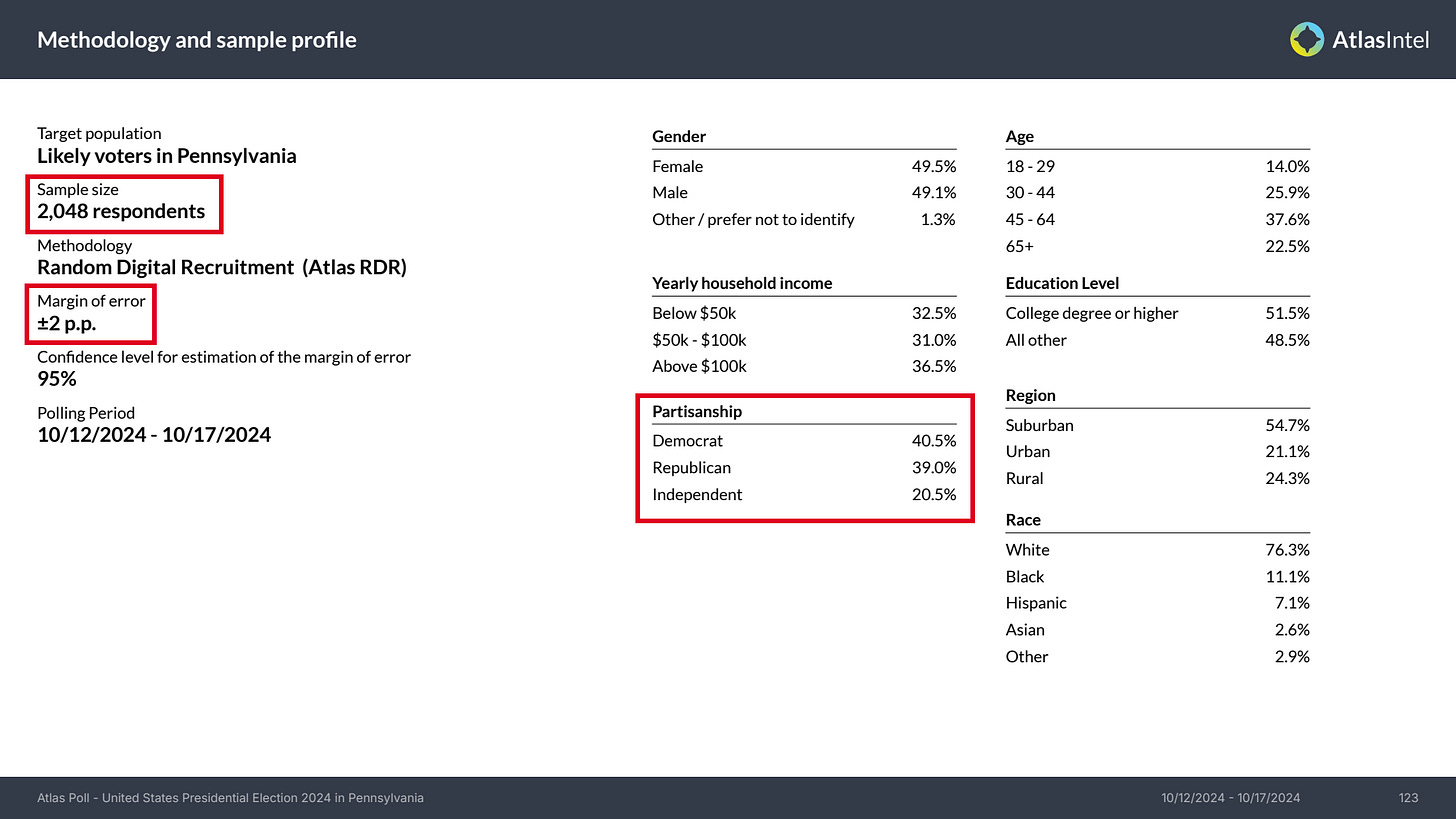
We should start a deep dive on the Wisconsin numbers by noting AtlasIntel’s sample size and demographics.
For the Wisconsin poll, the largest cohort by political affiliation were the Republican voters, being 3.7pp larger than the Democrat cohort.
At the same time, the sample size tended to the small size—fewer than 1,000 respondents. We should not be surprised that the Margin of Error (MOE) is 3pp.
Contrast this with the sample population in Pennsylvania.
In Pennsylvania, the Democrats were the largest cohort by political affiliation, and the sample size was more than twice as big.
The larger sample size is undoubtedly a major reason the MOE is at 2pp.
Ironically, in both states the party with largest representation in the poll was not the poll’s beneficiary. Wisconsin is leaning towards Kamala Harris while Pennylvania went for Donald Trump. If party affiliation distortions were putting the proverbial thumb on the proverbial scale, we would expect to see the results flipped—and we are not.
One thing we can conclude about the political distribution of the sample population is that Wisconsin’s results are very likely a “best case” for Donald Trump in the same way the Pennsylvania results are a “best case” for Kamala Harris. Kamala Harris may be leading by more than 0.7pp, but it is less likely that she is leading by less than 0.7pp.
Wisconsin also shows a wrinkle that could prove crucial in the actual election outcome: Robert F. Kennedy, Jr., is still on the ballot, the courts having declined to remove him from the Wisconsin ballot last month.
Intriguingly, the support that RFKJr still commands is the same as Kamala Harris’ polling lead over Donald Trump.
Will voters “remember” at the last minute to vote for Donald Trump instead of Kennedy? There is, of course, no way to know that until after the final results are tallied. Still, given that Kennedy is not on the Pennsylvania ballot, this is a reminder yet again of how significant the third-party “spoiler” effect could be in some states.
Depending on how close the individual states end up being, third party candidates could end up with an outsized influence in this election, something which will no doubt give the brain trusts in both parties fits regardless of who wins next month.
Wisconsin’s variations from Pennsylvania are not limited to third party influences. One of the more striking differences is that the family income distribution is the inverse of Pennsylvania’s.
In Wisconsin, the majority of families with incomes less than $100K are going for Kamala Harris, while a majority of households within inomes above $100K are going for Donald Trump.
We should also note a significant variance in the breakdown by racial classification. In Wisconsin, 72.5% of blacks and 63.5% of Hispanics are declaring for Kamala Harris.
Contrast this with Pennsylvania, where not only are households with incomes below $100K breaking for Donald Trump, but Harris support among blacks and Hispanics is significantly less.
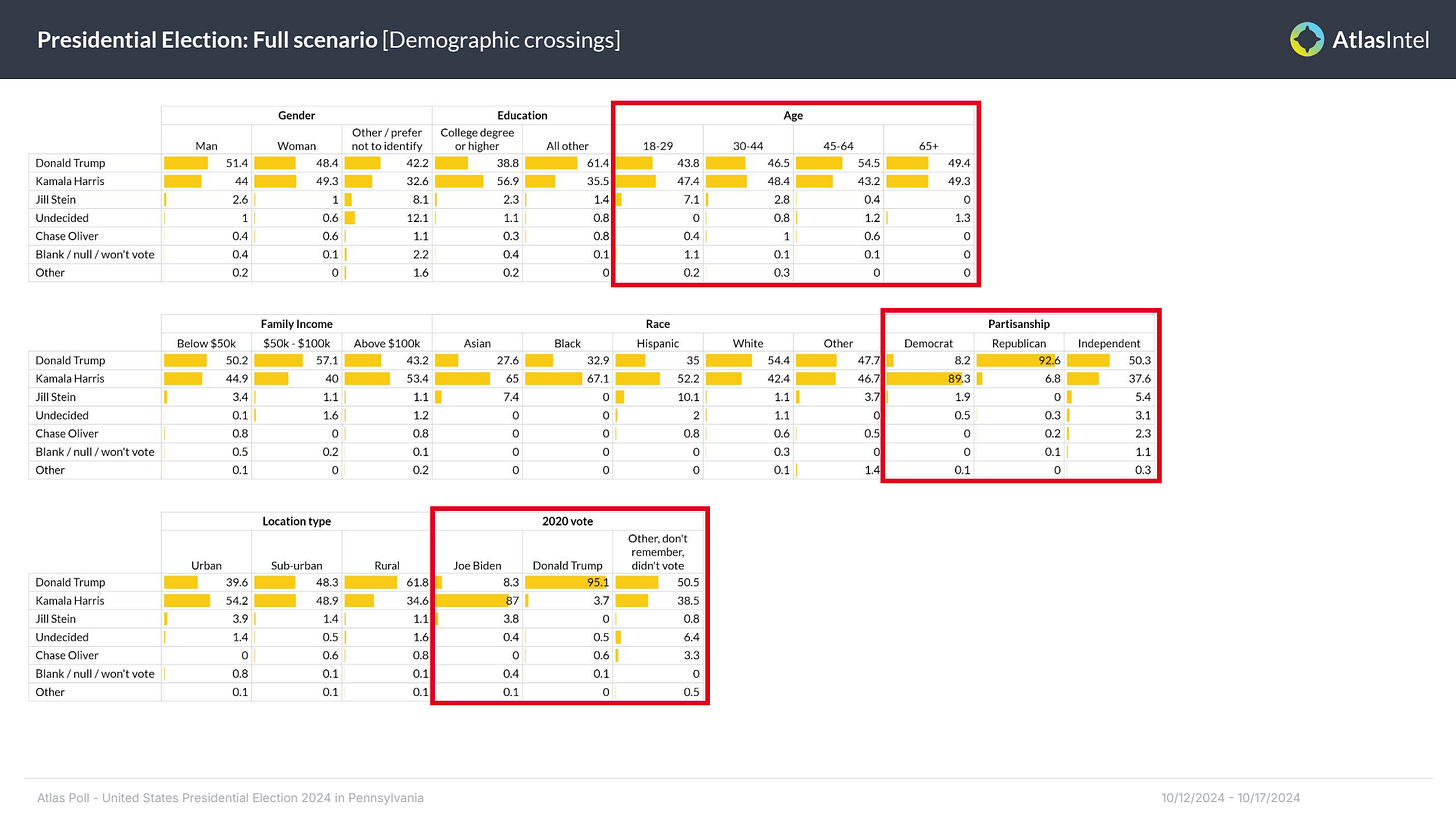
While Kamala Harris is still commanding a majority of both demographics, at 67.1% among blacks and 52.2% among Hispanics, her weaker support is a major reason why AtlasIntel is showing Trump up by 3pp in the state.
This variance highlights the influence minority voters can have at the margins. The shift of a few percentage points either way can determine which candidate will assemble a winning voter coalition in any given state.
For readers in the United States, if you needed any further encouragement on why all votes matter, this is it. Even if we assume that there will be ballot fraud by the Democrats, the more Republicans and Trump supporters vote, the more likely it will end up being that the electoral outcome will be “too big to rig.” Small shifts among any one voter demographic can be enough to change the outcome of a state election.
Nor is racial classification the extent of the demographic differences between Wisconsin and Pennsylvania. Age is another source of small variance which could prove just enough to tip the electoral scales. While Trump dominates among voters age 45-64 in both states, Harris in Wisconsin is coming in much stronger among the younger voters.
Moreover, Harris does a much better job of retaining Biden’s 2020 voter coalition in Wisconsin, losing only 4.5pp of support there to Donald Trump.
Wisconsin is also apparently more partisan, with only 1.8% of Democrats defecting to support Donald Trump.
In Pennsylvania, Harris still wins with voters age 18-29 and age 30-44, but the margins are much closer.
Surprisingly, Pennsylvania is tracking as less partisan, with 8.2% of Democrats apparently willing to defect to Donald Trump. This may also explain why Harris is losing 8.3% of Biden’s 2020 voter coalition to Donald Trump.
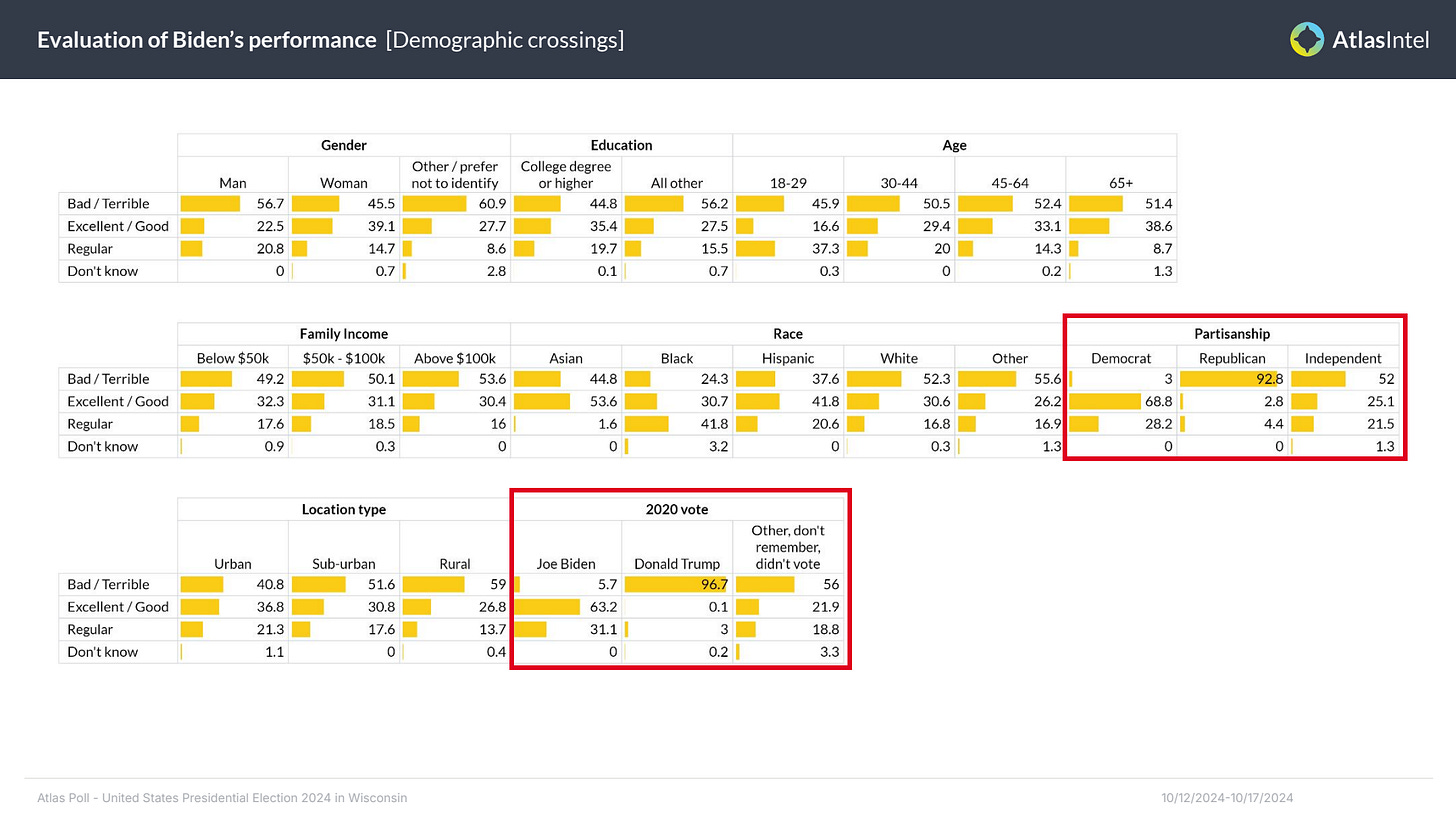
When we look at how poll respondents view Joe Biden and Biden’s track record, we can see further indication that Wisconsin is the more partisan state.
While in nearly every demographic, respondents most frequently rated Joe Biden’s job performance as “Bad”, among Democrats only 3% rated Joe Biden's job performance that way.
That partisanship extends to Joe Biden’s 2020 voter coalition as well, with only 5.7% willing to rate Joe Biden’s job performance as “Bad/Terrible”.
This stands in contrast to Pennsylvania’s poll results, where Joe Biden’s job performance was rated as “Bad/Terrible” by 11.3% of Democrats, and 12.8% of Biden’s 2020 voter coalition.
Given these variances and Wisconsin’s far more partisan demographic, it may seem surprising that Harris is leading in Wisconsin by a razor-thin 0.7pp.
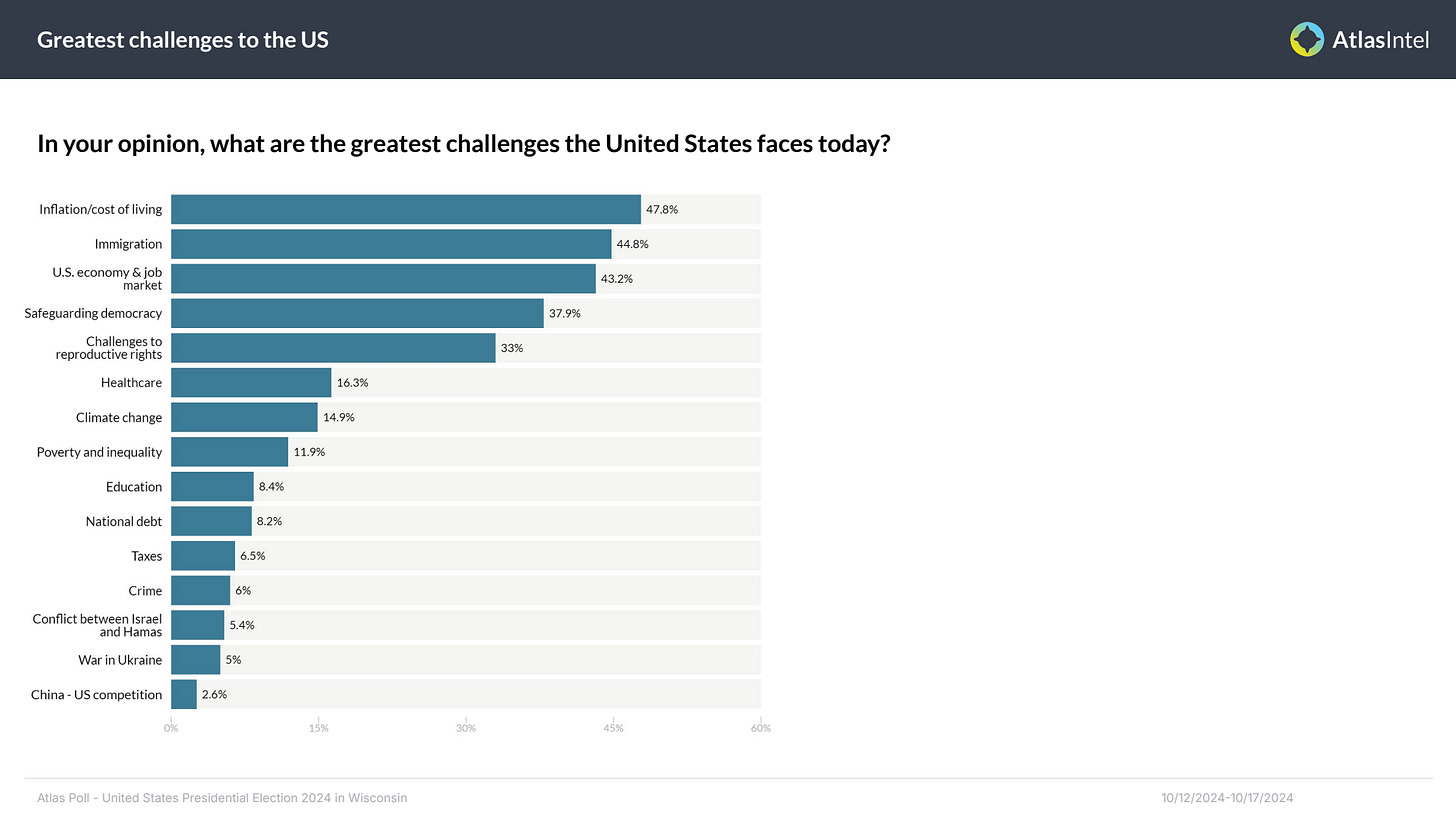
However, one area where the states are broadly in agreement is which issues are the most important. Both states have Inflation, Immigration, and the US economy as the leading issues.
These are, as I have noted previously, issues on which Donald Trump is generally considered the strongest (AtlasIntel does not provide a breakdown of the candidates’ strength on individual issues within the state by state polls, and so for that we have to draw inferences from their nationwide polling).
Still, even within this Wisconsin and Pennsylvania are not carbon copies of each other. While Wisconsin places Inflation at the top of the priority list, followed by Immigration and then the economy, in Pennsylvania the three issues are almost of equal weight.
Wisconsin also shows greater variation on the importance of these issues in particular among the different racial demographics. Black voters in Wisconsin put significantly less weight on these issues, putting “Safeguarding democracy” and reproductive rights ahead of them.
White voters also place less importance on these issues, broadly speaking, than in Pennsylvania, where more than half of white voters view Inflation and Immigration as the most important issues in the election.
These variations show that voter demographics are not the sole story when it comes to gauging voter sentiment. The differences state by state within demographic cohorts demonstrate the importance as well of geography in gauging voter sentiment. Where one lives is every bit as important as one’s income level, political affiliation, and even racial and ethnic classification.
Both the Pennsylvania and Wisconsin polls from AtlasIntel cover the same time frame as their nationwide polling data. Yet, as just these variances illustrate, we cannot extrapolate state by state results (and, therefore, likely electoral outcomes) simply by imputing the nationwide breakdowns to the state level.
Variation exists not just in the demographic makeup of a state’s electorate, but also within each demographic cohort. What is important to a particular voter demographic in one state will be less important to that same voter demographic in another state.
Beyond the variation in likely electoral outcomes, the AtlasIntel poll data serves to illustrate why the structure of the Electoral College is an important and necessary feature of Presidential elections. We must remember that the President of the United States is the only elective office in the United States where voters from every Congressional district and every state get to have a say.
Wisconsin is not Pennsylvania. Neither state is New York, or Florida, or Texas, or California. What is important to voters in Wisconsin is different from voters in Pennsylvania, or New York, or Florida, or Texas, or California.
The structure of the Electoral College compels Presidential candidates to mount election campaigns with a nationwide scope. Candidates have to speak to voters not just across income divides, or ethnic divides, or even gender and party affiliation divides, but also geographic divides. As such, Presidential elections call the nation’s attention to the diversity of perspectives and priorities that exist throughout the United States.
With such a diversity of people across the whole of the United States, in order for a President to be able to bridge whatever divides exist within the American people, a President must first show both the willingness and the capacity to engage across those divides. Regardless of whether the next President is Donald Trump or Kamala harris, their success as President will hinge in large measure on their capacity to engage across the many political, cultural, and demographic divides that exist in our society.
Which candidate has made the most successful case for being able to bridge these divides? We will find out in approximately eleven days (assuming no bizarre and massive voting irregularities).


You clearly don’t live here in Wisconsin