As we discussed last week, the “experts” were disappointed in September’s inflation print as the headline number came in higher than expected.
The Consumer Price Index for All Urban Consumers (CPI-U) rose 0.4 percent in September on a seasonally adjusted basis, after increasing 0.6 percent in August, the U.S. Bureau of Labor Statistics reported today. Over the last 12 months, the all items index increased 3.7 percent before seasonal adjustment.
This was a disappointment to the “experts” and to the corporate media, which had prognosticated further cooling of consumer price inflation.
The prevailing narrative is that a major part of this disappointment is due to a “surge” in rent.
U.S. consumer prices increased in September amid higher costs for rent and gasoline, but underlying inflation is slowing, supporting financial market expectations that the Federal Reserve would not raise interest rates next month.
Certainly the BLS presents the data that way.
The index for shelter was the largest contributor to the monthly all items increase, accounting for over half of the increase.
But does the data really show a dramatic increase in rental costs across the country?
No, it does not.
There is little doubt that the Consumer Price Indices for shelter show shelter costs continuing to increase. There are four indices which track to shelter costs and they are all rising.
Moreover, since the Pandemic Panic Recession, the indices have all tracked upward at about the same trajectory.
However, while the indices are still rising, we do not see a significant curve upward during the past couple of months which would be indicative of a sudden “surge” in rents. In fact, whether we are looking at the base indices or the indices set to the end of the Pandemic Panic Recession, we see an inflection earlier this year indicating that rent increases are actually slowing, not surging.
If we look at the percent change year on year for these four indices, that is exactly what we see.
Only when we get to the month on month changes do we see any sort of increase.
If we zero in on this year, the increases become much more apparent in the past couple of months.
Does this mean that rents suddenly increased in the past two months? Not exactly.
Long-time readers may recall that I covered this topic last year at about this time, and one the important dynamics to understand is that the BLS rent indices tend to be trailing indicators—they tend to reflect where rents have been.
A recent working paper by the Cleveland Federal Reserve explores these disparate dynamics and the influence they have on existing shelter price indices as well as headline consumer price inflation.
Prominent rent growth indices often give strikingly different measurements of rent inflation. We create new indices from Bureau of Labor Statistics (BLS) rent microdata using a repeat-rent index methodology and show that this discrepancy is almost entirely explained by differences in rent growth for new tenants relative to the average rent growth for all tenants. Rent inflation for new tenants leads the official BLS rent inflation by four quarters. As rent is the largest component of the consumer price index, this has implications for our understanding of aggregate inflation dynamics and guiding monetary policy.
One of the most glaring variances among rent indices is that between the “official” CPI metrics and private-sector measurements. As the Cleveland Fed research team notes, if instead of the government standard “Rent of Primary Residence”, the Zillow Observed Rent Index were used to incorporate shelter price inflation into headline inflation, during May of this year headline inflation would have been at an all-time high.
When we look at the Zillow Observed Rent Index (ZORI), we again see much larger movements in rent inflation year on year than in the BLS indices.
If we baseline the BLS indices and the ZORI to the same base period of April, 2020 (the end of the Pandemic Panic Recession), we see the ZORI charts a much greater magnitude of shelter price inflation during 2021 and the first part of 2022. Around June of 2022 ZORI shows a significant tapering of inflation that is not shown in the BLS indices, followed by another small increase in inflation during the first part of 2023, which has already begun to subside.
If we look at the ZORI month on month percentage shifts, we see that it reported a mini-surge in rents in the spring of this year which is already mostly subsided.
When we look at the ZORI monthly percentage changes, we see the pattern in 2023 greatly resembles the pattern in 2016 through 2019. This implies not only that there was no “surge” in rents last month, but that rents overall are largely returning to the historical patterns of inflation. The rent levels are higher—which is inevitable, unless there is an event to power a drastic reduction in rents giving us extended rent deflation to match the recent inflation—but the pace and magnitude of change is already back to pre-pandemic levels. At least, this is what the ZORI is telling us.
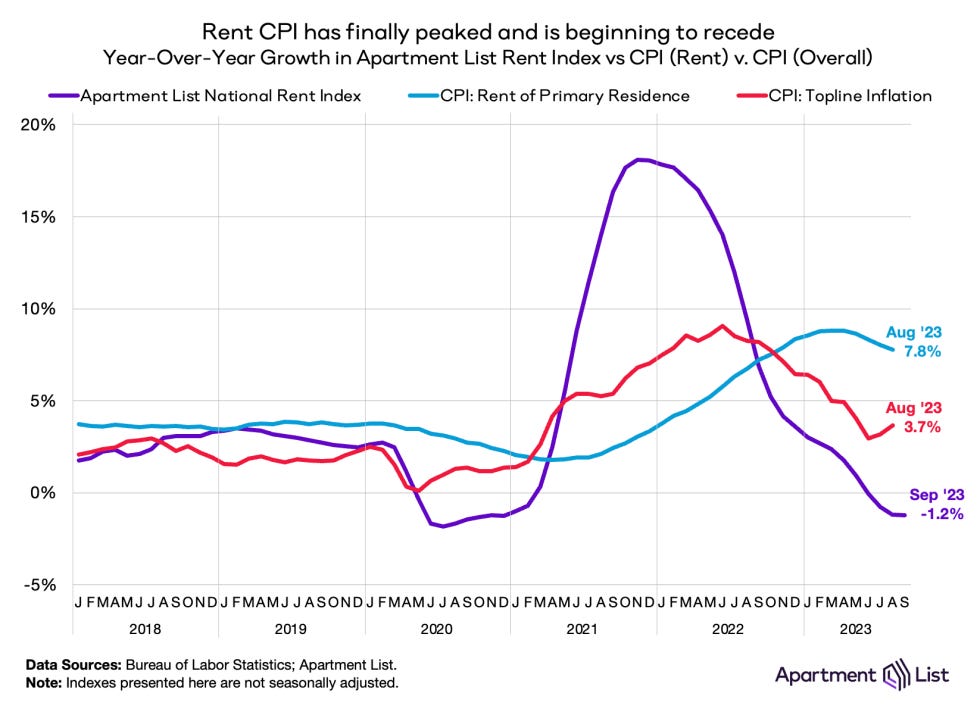
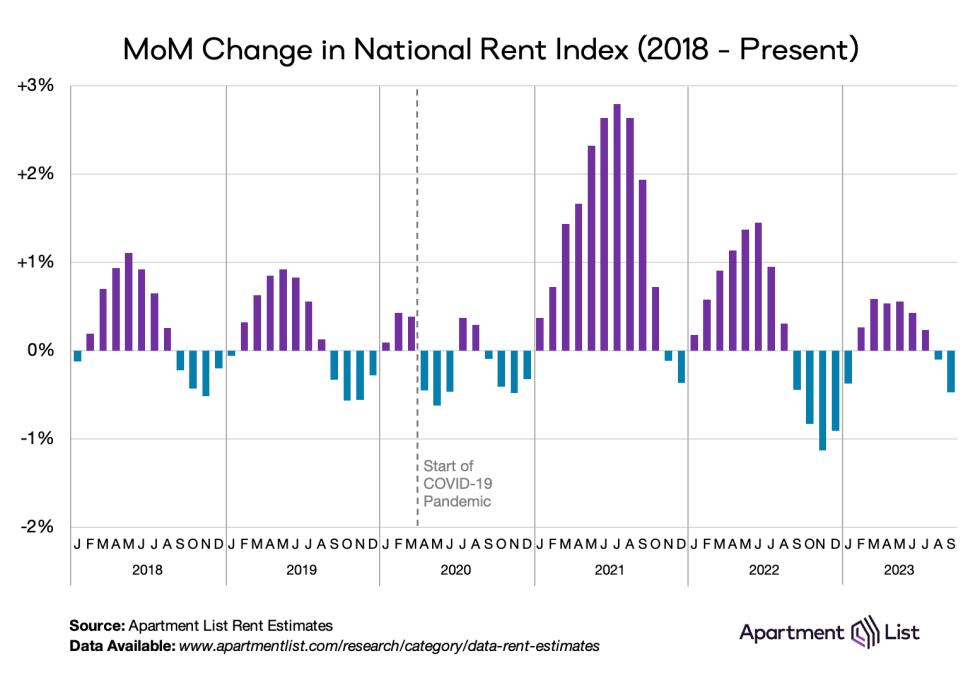
We can confirm this by looking at yet another private industry rent index from The Apartment List.
The Median Rent as tracked by The Apartment List bears more than a passing resemblance to the ZORI.
However, the Median Rent index from The Apartment List actually shows rents declining in the past couple of months. That is definitely not a “surge”.
The Median Rent index suggests there has already been a bit of price inflation correction in within rents, as the Median Rent index actually went negative in the year on year changes.
ZORI does not show a period of shelter price deflation in recent years, although deflation periods do show up in the month on month metrics, whereas the Median Rent year on year metric from The Apartment List shows a period of rent deflation in late 2020 and early 2021 and again starting in the spring of this year.
The month on month shifts from The Apartment list data likewise show more and greater periods of shelter deflation than the ZORI
What The Apartment List metrics and the ZORI indicate is that, contrary to the corporate media narrative, there really has not been any sort of actual “surge” in rents recently. Rather, what we are seeing within the BLS indices are artifacts of how the shelter indices are constructed. The BLS indices are, unlike the ZORI or The Apartment List data, still processing rent changes that have already occurred.
Thus, while the BLS indices are starting to show year on year declines in rent inflation, they are capturing disinflation that ZORI and the Median Rent metrics have already captured.
What the trailing nature of the BLS indices tells us is that, as shelter is a major influence on the overall “core” Consumer Price Index (less Food and Energy), the percentage year on year shifts as well as the percentage month on month shifts are going to be showing somewhat legacy data.
What the ZORI and The Apartment List data show us is that the “surge” in rents, such as it was, actually occurred earlier this year. These private industry metrics also show that, overall, actual rent inflation has almost completely subsided. There is still inflation, but it falls into a seasonal pattern and at a seasonal level that was last seen before the Pandemic and all the lockdowns.
This lack of a surge in rents is also why the “experts” were able to prognosticate almost exactly where the September inflation print would land for “core” consumer price inflation. There is nothing that is unexpected about the historical shelter price data. Where rent inflation has been heating up in recent months it is part of a seasonal pattern that is already subsiding.
None of this should be taken to mean that rents are not higher than before, nor that rents are not higher than they were at the beginning of the year. Rent inflation is very real and is very much an ongoing phenomenon.
However, while the BLS shelter indices are still printing higher than anyone would like (especially the Fed), they are already starting to catch up to the ZORI and the Median Rent indices, processing disinflationary trends those indices have already captured. Unless and until we see significant inflation in either the ZORI or the Median Rent index, what we should expect to see in the BLS shelter indices is continuing disinflation in the year on year metrics. The month on month metrics should likewise moderate and return to historical patterns and levels; they may already be there.
As is always the case with inflation metrics, the constant caveat is always “your mileage may vary.” As alternative metrics such as the ZORI demonstrate, the BLS indices can be slower to capture significant pricing shifts. This is especially true of rents, where prices are typically locked in for set periods, thus changes are felt by individual consumers only sporadically. The “experts”, as per usual, manage to overlook these realities.
There are still inflationary pressures in the US economy. More and more, however, the current trend is that rents are not one of those pressures.


Can you please do an analysis of how real wages are not going up for most Americans thanks to inflation? The working class knows they are not “making more money” just because they got a $2 raise.