Shoutout to reader “Gbill7” for this perceptive question about the reliability of the “official” government data, particularly the inflation statistics published by the Bureau of Labor Statistics.
My question is: what is your confidence level in the data itself, relative to your confidence in data given in past eras? Are the regulatory agencies ‘spinning’ the data more these days, just because it has become the government cultural norm? When the government says that inflation has lessened, do you suspect that the inflation data is more ‘manipulated’ than it would have been 10 years ago?
The charge that the government inflation metrics significantly understate actual consumer price inflation is not a new one, and the history of many of the more substantive revisions to the Consumer Price Index certainly does little to rebut that charge. The challenge is accurately assessing the impacts of the politicized “revisions” to determine the utility of the government data and how much reliance we can put in them.
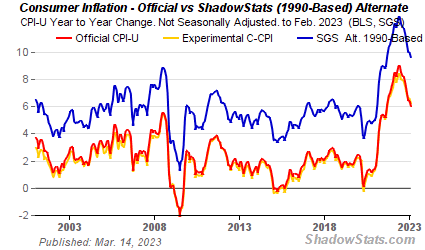
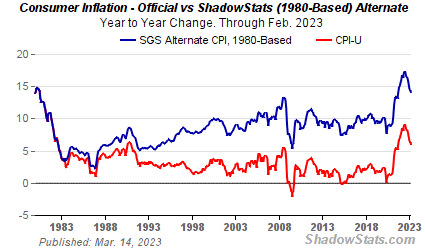
The alternative metrics provided by economist John Williams at ShadowStats are one attempt to present a more realistic view of consumer price inflation. As he documents in a public presentation of the rationale behind his alternate inflation metrics, there were a number of politically charged discussions during the 80s and 90s which culminated in a series of changes that racheted consumer price inflation substantially and permanently down.
In the early-1990s, political Washington moved to change the nature of the CPI. The contention was that the CPI overstated inflation (it did not allow substitution of less-expensive hamburger for more-expensive steak). Both sides of the aisle and the financial media touted the benefits of a “more-accurate” CPI, one that would allow the substitution of goods and services.
The plan was to reduce cost of living adjustments for government payments to Social Security recipients, etc. The cuts in reported inflation were an effort to reduce the federal deficit without anyone in Congress having to do the politically impossible: to vote against Social Security. The inflation-calculation changes had the further benefit to government fiscal conditions of pushing taxpayers artificially into higher tax brackets, thus increasing tax revenues. The changes afoot were publicized, albeit under the cover of academic theories. Few in the public paid any attention.
John Williams maintains an alternate “shadow” CPI data set which aims to reverse many of the adjustments made since then, to present a clearer picture of “actual inflation.
As his public graphs (the underlying data set is available on a paid subscription base only) demonstrate, the ShadowStats methodology computes inflation significantly higher than the “official” data.
The reason I don’t use the ShadowStats data for my articles is simple: it’s on a subscription-only basis, which also limits my ability to share the data publicly—which ultimately just isn’t compatible to my analytical approach. The government’s numbers have the virtue of being freely accessible.
There is, however, another independent inflation data set which is freely available: the Everyday Price Index (EPI) maintained by the American Institute for Economic Research.
The AIER has been critiquing the official BLS data for decades, and the EPI is the culmination of that criticism.
AIER developed the Everyday Price Index (EPI) to address the widespread perception that the Consumer Price Index (CPI) does not reflect the day-to-day experience of Americans. As we continue to study and refine the EPI, we find that the divergence between inflation measured by the CPI and an index that measures direct experience is mostly a product of 21st-century changes in the economy.
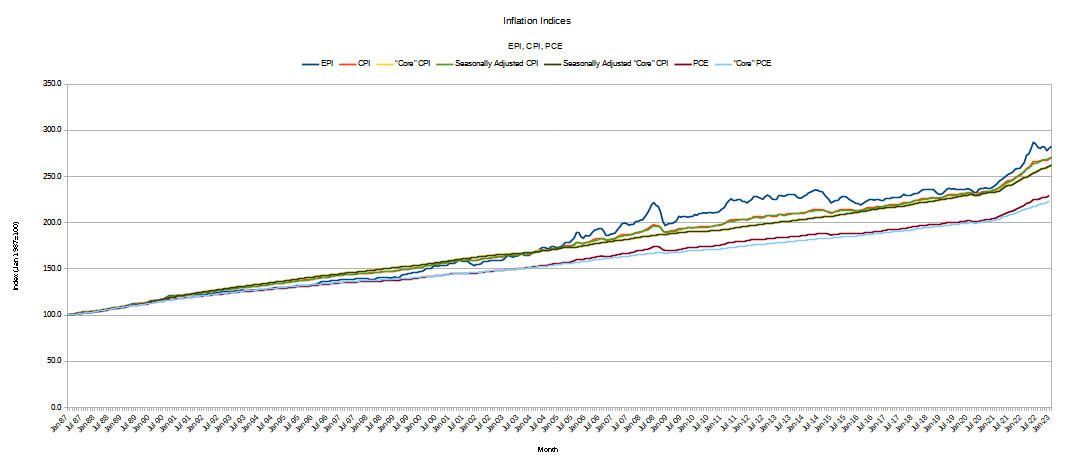
The AIER data gives us an independent view of inflation against which we can compare the CPI to determine to what extent the CPI potentially mis-states actual consumer price inflation.
While there can be significant variance between the EPI and CPI, as well as between the EPI and Personal Consumption Expenditures Price Index (PCE), we can immediately see that the variances are not nearly as great as the ones asserted by the ShadowStats charts, and there are even periods where the CPI arguably overstates consumer price inflation.
Looking at the year on year percent changes in the various indices, we see that the EPI is considerably more volatile than either the CPI or the PCE metrics, or their “core” analogs which have the data for food and energy removed (food and energy prices are considered to be too volatile to present a reliable picture of long-term inflation).
However, while there is greater volatility, the macro trends are not that far off from both the CPI and the PCE metrics, and so we may have a measure of confidence that the CPI and PCE data have sufficient precision to warrant using them for analyzing broader trends.
Indeed, when we zero in on inflation from 2017 onward, we can see that the various metrics are beginning to converge in 2023.
The EPI had the highest consumer price inflation peak, although as of February, 2023, the EPI as well as both unadjusted CPI and PCE as well as seasonally adjusted CPI and PCE, including their “core” variants, differ in year on year inflation by roughly a single percentage point.
With the overall CPI and PCE data thus confirmed to be reasonably reliable data, we can thus proceed to use the CPI to delve into the details of consumer price inflation, a breakdown the EPI data does not provide.
External comparisons and validations such as the EPI are important particularly for consumer price inflation for the simple reason that inflation continues to have significant impact on everyone. The dramatic failures of Silvergate Capital, Silicon Valley Bank, and Signature Bank of New York have occupied much of the media’s attention recently, but we do well to remember that much of what precipitated those failures was the Federal Reserve’s efforts to contain and reduce inflation.
Indeed, one of the signature failures of the Fed’s rate hike strategy has been its inability to contain the damage inflation produce by distorting relative price of goods and services. When prices are rising and falling, not just overall, but also in relation to each other, effective household budgeting is made considerably more difficult.
And the relative prices are continuing to shift, as even the BLS notes.
The index for shelter was the largest contributor to the monthly all items increase, accounting for over 70 percent of the increase, with the indexes for food, recreation, and household furnishings and operations also contributing. The food index increased 0.4 percent over the month with the food at home index rising 0.3 percent. The energy index decreased 0.6 percent over the month as the natural gas and fuel oil indexes both declined.
The index for all items less food and energy rose 0.5 percent in February, after rising 0.4 percent in January. Categories which increased in February include shelter, recreation, household furnishings and operations, and airline fares. The index for used cars and trucks and the index for medical care were among those that decreased over the month.
Yet even while food prices continue to be a major contributor to overall consumer price inflation, the price of some food items—most notably eggs—has actually declined.
One standout from the report is the price of eggs, down 6.7% on a monthly basis. That's compared to the last CPI print, where prices for eggs were up 8.5% month-over-month from December to January due to the avian flu outbreak. (Year-over-year though, egg prices are still up 55.4%.)
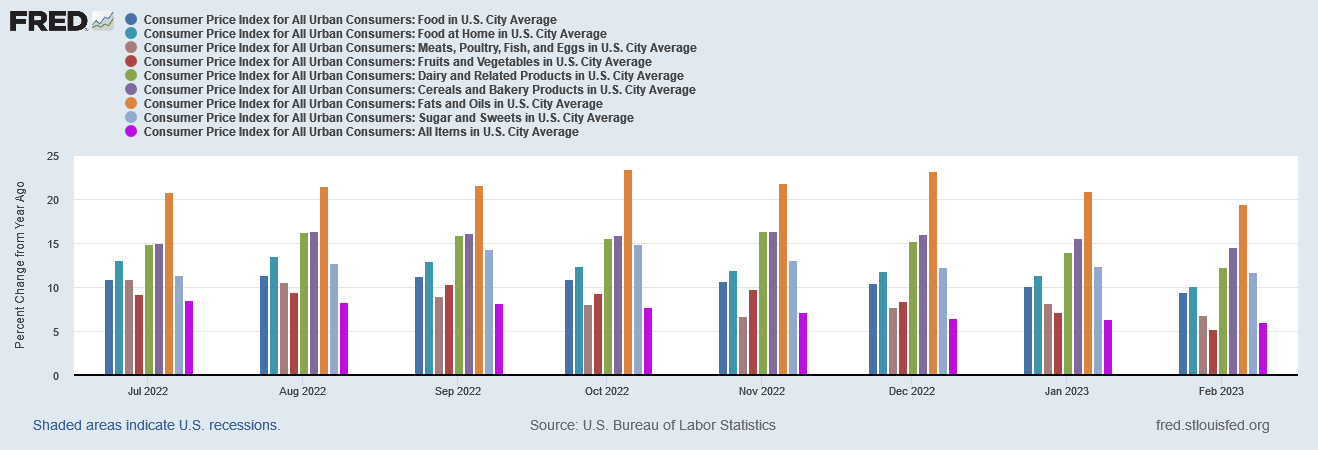
While the decline in the price of eggs is undeniably good news, year on year food price inflation is still significantly higher than headline consumer price inflation for most food categories.
Focusing on the last half of 2022, we see that, while consumer price inflation overall has declined, food price inflation, while declining, has declined less than headline consumer price inflation, and in February only the “Fruits and Vegetables” category came in below headline CPI.
These same food categories also have displayed significant volatility even at the month on month level of measurement.
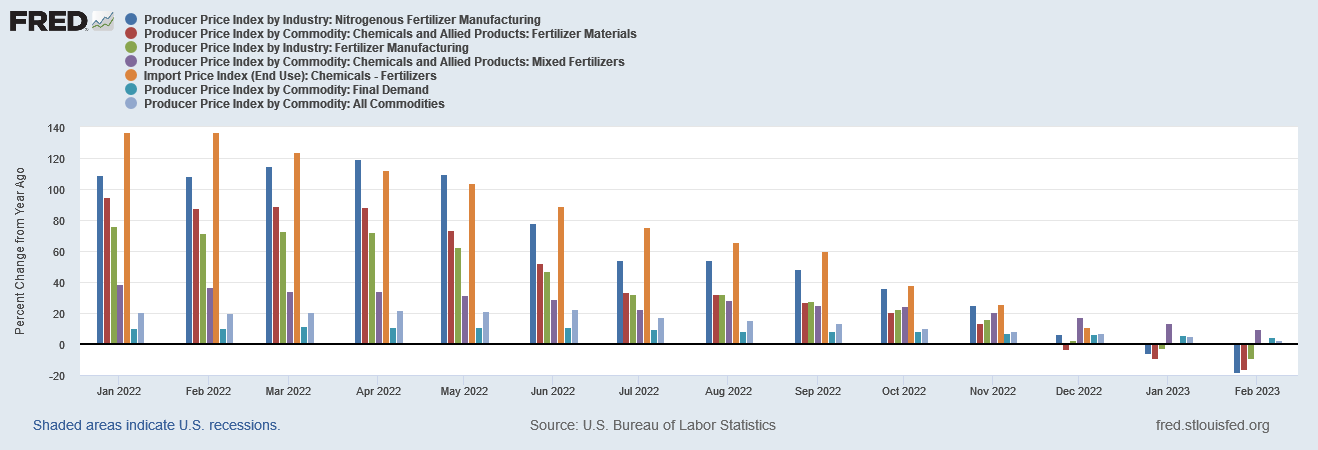
While food price inflation remains very much a significant portion of overall consumer price inflation, there is one indicator that may suggest this will not be the case for much longer—producer price inflation for a variety of fertilizer types and materials is also declining, and for many categories has even gone negative.
While fertilizer prices underwent significant inflation post-COVID, that has largely passed for virtually every fertilizer category.
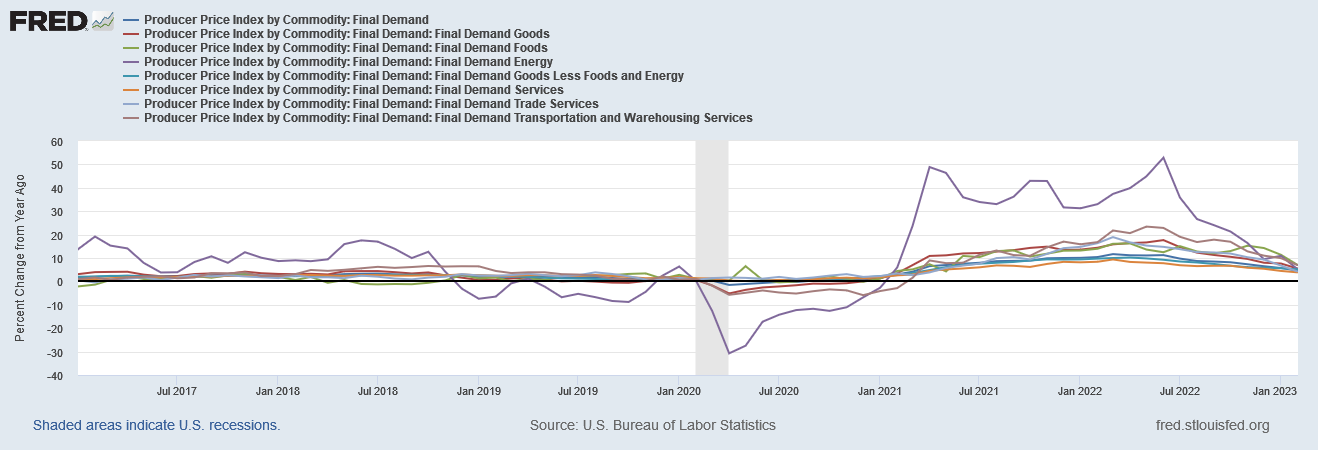
Producer prices are also signalling that there may be further decreases in consumer price inflation across the board, with major categories of producer prices showing marked declines in recent months.
Many economists view producer prices as a predictor of consumer price inflation1—if producer price inflation is trending down the expectation is that consumer price inflation should soon trend down as well.
The Producer Price Index looks at inflation from the viewpoint of industry and business. This method measures price changes before consumers purchase final goods and services. As a result, many analysts consider it to predict inflation before the CPI.
Yet even as the inflationary trends are all down, and the signals for future inflationary trends continue to be down, in key categories consumer price inflation remains elevated.
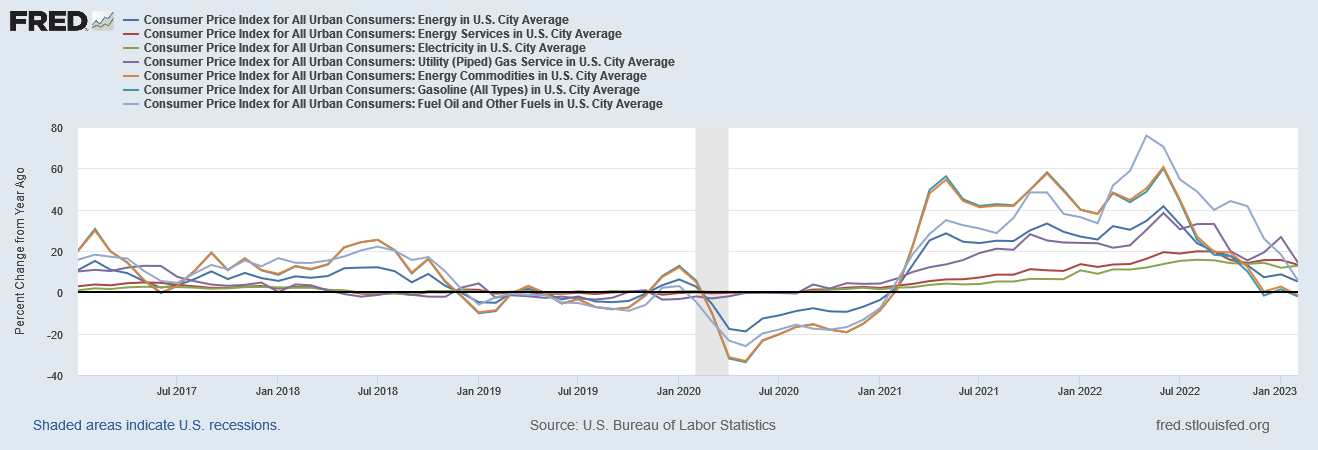
Energy price inflation has receded from the stratospheric peaks it achieved last summer, but energy usage within the home (electricity, gas, fuel oil) remains significantly above headline consumer price inflation.
Meanwhile, shelter price inflation is still slowly working its way back towards equilibrium.
Shelter price inflation is one area where we have to look beyond the official government data to get a complete picture. Because of how the primary CPI components that address shelter prices—Rent of the Primary Residence and Owner’s Equivalent Rent of Residence—incorporate new leases vs renewals, these metrics tend to be trailing indicators of shelter price trends.
To get the leading indicator perspective, we have to rely on industry metrics such as the Zillow Observed Rent Index.
Taken together, we see that rental increases largely peaked in February of last year, and only now is the ZORI metric coming in below the other two.
With shelter price inflation and energy price inflation still for several categories outpacing headline consumer price inflation, there can be no doubt that inflation, while receding, is still very much an outsized influence on most consumer purchasing behavior. Inflation is coming down, but as it is coming down from an historic peak, it is still far too high for most people to be comfortable with where the trend is, broadly speaking.
That inflation is still high means the Fed is still under political pressure to tweak monetary policy to force inflation down. Last week’s banking crises have not changed that at all.
Yet the higher Powell pushes interest rates, the greater the loss banks have to take on their portfolios of US Treasuries and other interest-bearing assets—the very force which, after building for a year, toppled three banks in quick succession last week.
Powell and the Federal Reserve are truly in a “damned if you do, damned if you don’t” dilemma. No matter whether the Fed pivots towards supporting the banks and easing interest rates (thus accelerating inflation or stays the course and raises interest rates by another 25 or 50 bps at next week’s FOMC meeting, the end result now leads not towards an healthier economy, growing and expanding once more, but towards a sicker and weaker economy, with either stagflation running rampant or the financial system in ruins.
Now that Powell’s rate hikes executed to date have started breaking the more vulnerable banks, even a 25bps rate hike is fraught with risk of doing further immediate damage. Even though it is proper to recognize that the banks which are likely to fail first have had an entire year to work out how to resolve the losses they cannot help but incur as the market value of their securities portfolios decline, it is hardly prudent for any central bank to knowingly and intentionally exacerbate the risks.
Given the inflation challenges that are still present, doing nothing or even easing runs the risk of having consumer price inflation heat back up. Should inflation return to 8-9% or even higher, Powell will be forced to concede his rate hike strategy has failed (which, of course, it has).
The challenge here is not so much a “contagion” risk but rather a latent and fairly broad existing instability. The failure of banks to proactively address the reality that they made a losing bet on low-yield securities means every effort by the Fed to raise rates compresses the timeline they have left to deal with that reality. Literally almost every move the Fed has available at this point carries significant downside, either in financial system stress, consumer price inflation stress, or perhaps even both.
It will be tough for Powell and the FOMC to decide next week which road to take on interest rates when all roads seemingly lead straight off the proverbial cliff.
Majaski, C. “Producer Price Index (PPI): What It Is and How It’s Calculated”, Investopedia. 15 Mar. 2023, https://www.investopedia.com/terms/p/ppi.asp.







Yes, they are indeed ‘damned if they do and damned if they don’t’! If inflation rises substantially, the current administration will be voted out by a disgusted nation. If too much of the banking system fails - and there exist very few politically acceptable tools to correct that - the collapse would be a nightmare for everyone.
Some analysts are saying that this is how the centralized digital currencies are going to be implemented, because of the ‘crisis’. I’m wondering: any creative minds out there see another economic pathway possible? I’d sure like to think there is one!