

BLS Begins 2025 With More Lou Costello Labor Math
New Year. New Administration. Same BLS Bad Data On Jobs.

The more things change, the more they stay the same.
Here we are in a new year with a new Presidential Administration, and here we are slogging once again through a corrupted and definitely untrustworthy Employment Situation Summary report from the Bureau of Labor Statistics.

Total nonfarm payroll employment rose by 143,000 in January, and the unemployment rate edged down to 4.0 percent, the U.S. Bureau of Labor Statistics reported today. Job gains occurred in health care, retail trade, and social assistance. Employment declined in the mining, quarrying, and oil and gas extraction industry.
As jobs numbers go, the January Employment Situation Summary is not bad, but it’s not great. Unlike Goldilocks, it’s not even “just right.”
As jobs reports go, the January Employment Situation Summary is just a mess. The numbers and the trends from the two halves of the report do not reconcile with each other, and do not show complementary trends.
That reality can only mean one thing: The BLS is greeting 2025 with a fresh dose of Lou Costello Labor Math—fudging, futzing, and potentially goal-seeking the numbers until every last drop of common sense has been squeezed out of the data and left in a glass on the kitchen counter.
As a result, the headline jobs numbers are wholly unreliable. Even the trends underneath must be approached with caution.
The Bureau of Labor Statistics is not starting 2025 at all well.
Because corporate media insists on approaching the Employment Situation Summary credulously, we must once again peel back the layers and look at the detail to understand some of what corporate media has managed to miss yet again.

January, The Month Of Revision
January is structurally a challenging month for the Bureau of Labor Statistics, because January is the month when it revises and updates all of its benchmark employment estimates, using the Quarterly Census of Employment And Wages.
In accordance with annual practice, the establishment survey data released today have been benchmarked to reflect comprehensive counts of payroll jobs for March 2024. These counts are derived principally from the Quarterly Census of Employment and Wages (QCEW), which counts jobs covered by the Unemployment Insurance (UI) tax system. The benchmark process results in revisions to not seasonally adjusted data from April 2023 forward. Seasonally adjusted data from January 2020 forward are subject to revision. In addition, data for some series prior to 2020, both seasonally adjusted and unadjusted, incorporate other revisions.
Regular visitors here might recognize the Quarterly Census of Employment and Wages (QCEW), as that is also the foundation for the Philadelphia Federal Reserve’s Early Benchmark Revisions of State Payroll Employment.
The Federal Reserve Bank of Philadelphia produces quarterly early benchmark estimates of monthly state employment for all 50 states and the District of Columbia. Our state estimates incorporate the more comprehensive job estimates released by the Bureau of Labor Statistics’ (BLS) Quarterly Census of Employment and Wages (QCEW) to augment the sample data from the BLS’s Current Employment Statistics (CES).
The BLS issues benchmarked revisions of its monthly CES state employment estimates in March of each year by incorporating its QCEW data available through September of the prior year. Since the QCEW data are available quarterly, the Federal Reserve Bank of Philadelphia researchers are able to create our own early benchmark estimates on a more timely basis.
A couple of the Philly Fed’s early estimates in particular have been notable for essentially shredding the BLS narrative on jobs.


As a consequence of these annual benchmark revisions, the data as presented in the January Employment Situation Summary starts off as structurally skewed each and every year. As the 2024 benchmark revision data shows, the amount of the skew is substantial—literally hundreds of thousands of jobs “adjusted” each month of the year.

Further degrading the January report is the sobering fact that in 2024 the revisions for each month were negative.
In other words, on a month-by-month basis, the BLS overestimated the number of non-farm employees in this country each and every month in 2024. Each month they overcounted the size of America’s payrolls by approximately 626,000 workers.
Every. Single. Month.
From an analytical perspective, that type of consistency in the direction of error indicates a structural defect in the BLS’ Establishment Survey. If the revisions were the byproduct of inevitable statistical “noise”, we would see a mixture of over- and under-estimation month on month.
When we look at the monthly revisions going back over the past four years, we see evidence of a growing problem in the Establishment Survey. In addition to the consistency red flag in 2024, the amount of the monthly revision is getting larger.
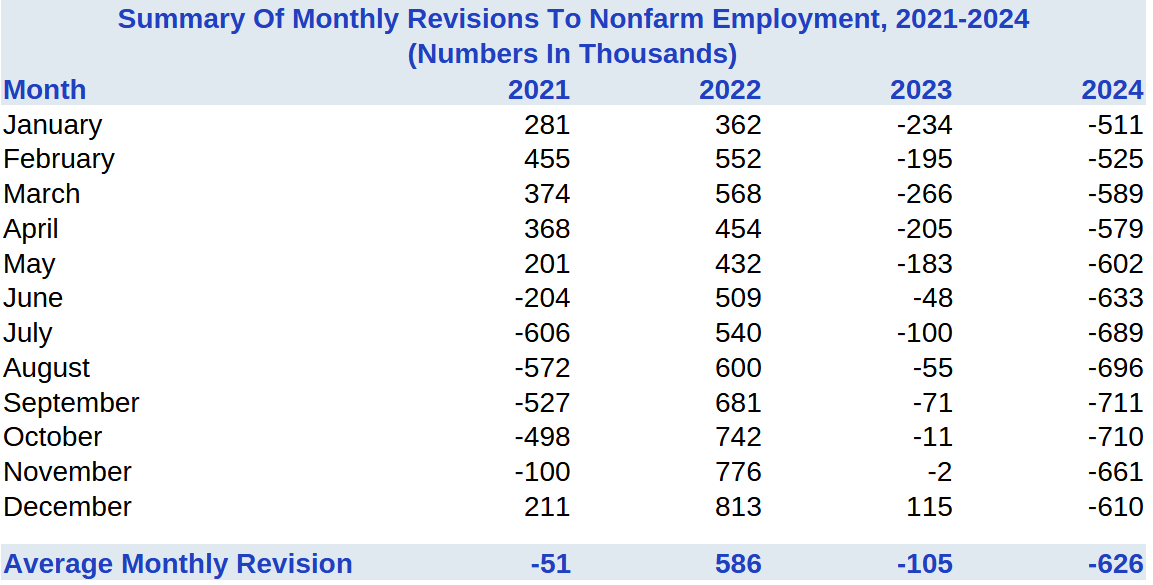
Intriguingly, in 2022 the Establishment Survey uniformly underestimated payroll size, suggesting the error in the Establishment Survey was in the opposite direction. Note, however, that 2022 and 2024 show the greatest absolute value in the average monthly revision. When the Establishment Survey is consistently off in the same direction every month is when the survey is off by the greatest amount, either over or under.
What the benchmark revisions do confirm is that net payroll gains declined every year between 2021 and 2024.
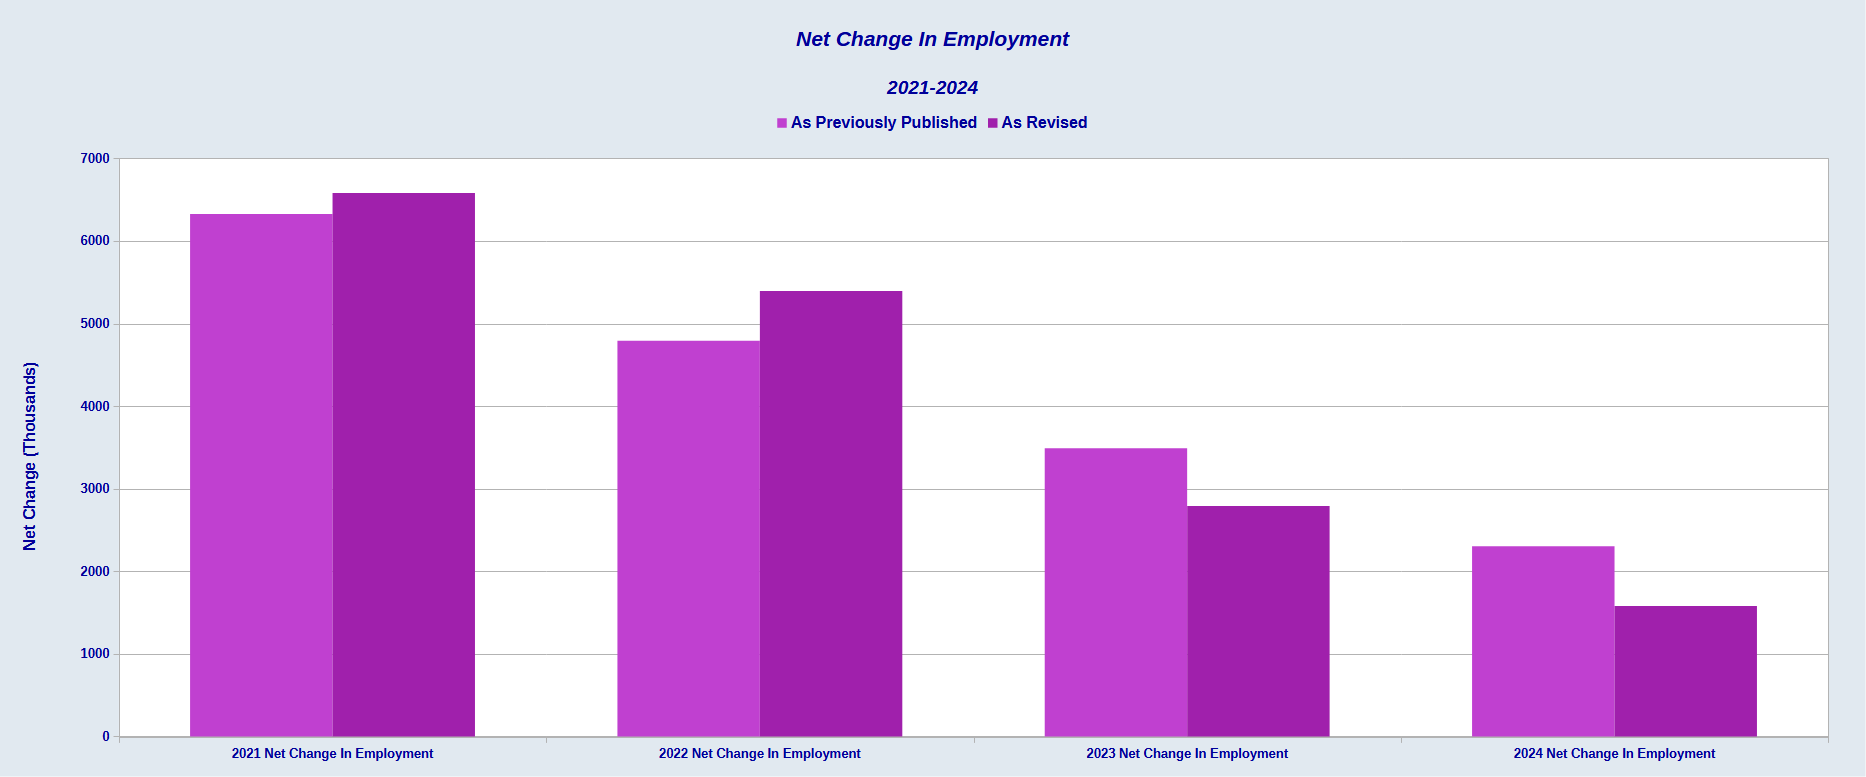
While the revisions flipped from under-counting in 2021 and 2022 to over-counting in 2023 and 2024, with and without revision, net payroll gain has been declining steadily.
Ideally, a healthy labor market should show either increasing payroll growth or an approximate steady state in payroll growth. Decreasing payroll growth means the labor markets are steadily slowing, and that is not an optimistic trend no matter what the Federal Reserve thinks.
How Does ADP Compare?
In addition to the Philadelphia Fed’s quarterly early benchmark estimates, we can also compare the BLS Establishment Survey to ADP’s National Employment Report, which is an independent measure of payrolls in the United States. On an annualized basis, ADP confirms slowing job growth in this country.

Whatever flaws exist in the BLS Establishment Survey portion of the monthly Employment Situation Summary report, ADP confirms at least this downward trend in payroll gains.
When we compare the monthly changes in 2024 between ADP and the BLS, we see broadly the same shifts in payroll gains and in the same direction. ADP is neither consistently greater nor smaller in its monthly estimate.

This indicates that ADP is at least not injecting the same errors into its estimates of payroll growth as the BLS. Since ADP is showing similar trends to the BLS data, while the BLS data is suspect in terms of specific months’ data, the short term and even the long-term trends do seem to be fundamentally confirmed.
When we index the ADP data along with total nonfarm payrolls and total private payrolls per the BLS starting in January, 2021, we see the long term trends do largely align between ADP and the BLS.

Does this mean we should have confidence in the BLS Establishment Survey data?
No.
Both ADP and the BLS Establishment Survey data are directly challenged by the trends shown in the other part of the jobs report: the Household Survey data showing overall employment levels in this country. When we add the indexed Household Survey data to the other indexed data sets, we see the Household Survey’s Employment Level deviates significantly from the rest of the data.
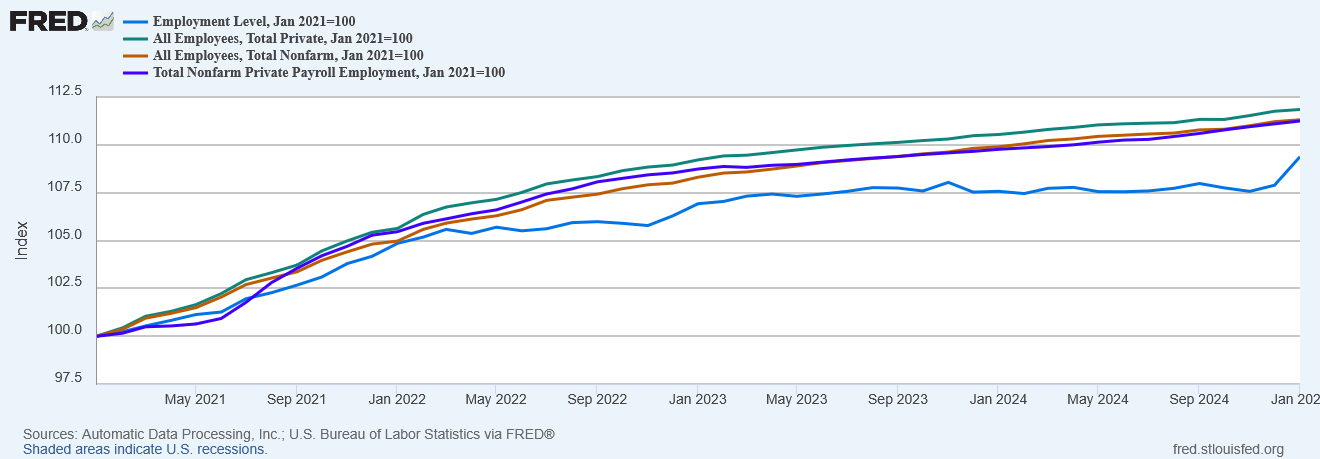
The Household Survey data shows a significant slowdown in job growth beginning in 2022 from which the jobs market in the US has not really recovered.
We should note that these slowdowns were largely confirmed in 2022 and again last year by the Philadelphia Fed’s early benchmark estimates.
Since ADP shows the same trends as the BLS Establishment Survey and not the Household Survey, and since the Philadelphia Fed independently confirms the Household Survey and not the Establishment Survey, while ADP might not be suffering from all of the same errors as the Establishment Survey, we are presented with data which indicates the ADP National Employment Report potentially shares at least a few structural errors in common with the Establishment Survey, so that when they are wrong they are wrong in the same direction and largely to the same degree.
Thus we are challenged to give the ADP report much more credibility than the BLS Establishment Survey side of its jobs report. ADP might be a little more reliable than the BLS data, but there are not an abundance of reasons to believe it is significantly more reliable.
Still, the ADP data does appear to confirm at least one negative trend from deep within the BLS detail: Manufacturing jobs in this country are on the decline.

As regular readers of All Facts Matter already know, I see this as a particular problem in the US economy, and one that I very much hope President Trump succeeds in reversing as he moves forward with Agenda 47.

Despite corporate media’s relentless cheerleading on the economy, the ADP data, while it gives significant reason to question its accuracy, is nevertheless showing the same flaws in the US economy and in US jobs markets as the BLS data.
That’s not a good thing.
The Household Survey: The “Other” Side Of The BLS Jobs Report
Given the clear structural flaws in the BLS Establishment Survey, it is only natural to want to place greater reliance on the Household Survey, the other and less remarked portion of the Employment Situation Summary.
That the Philadelphia Fed offers independent confirmation of labor stagnation the Establishment Survey and ADP both miss certainly serves to make a case for the Household Survey being more reliable. However, the headline Employment Level numbers at the very least make having complete confidence in the Household data unwise.
Despite the BLS revising the Establishment Survey data down, in January the BLS’ seasonal adjustment of the Household data showed a dramatic shift up.

Not only is that surge a dramatic departure from the trend towards stagnation and even decline that has prevailed recently, but it is a suprising shift away from the raw data as well.
Even when we look at the month on month changes in the Employment Level, January is a surprising deviation.

That “January Surprise”, however, is the result of the BLS gathering all months’ year-end revisions into a single change, and not backfilling throughout the year.
This year’s adjustment was large relative to adjustments in past years. It reflects both updated methodology and new information about net international migration in recent years.
In accordance with usual practice, BLS did not revise the official household survey estimates for December 2024 and earlier months. However, to show the impact of the population adjustments, table B displays differences in selected December 2024 labor force series based on the old and new population estimates.

According to the January report, during 2024 the Household Survey undercounted the Employment Level by a net of 2,000,000 jobs, which it then adds into the January 2024 data.
While the BLS does not back out that revision in any presentation, we can easily do so by subtracting it from the January 2025 data. The month on month changes for the end of 2024 and the beginning of 2025 then appear quite differently.

Without that 2,000,000 bump in a year end adjustment, the January change in the employment level would be considerably less on a seasonally adjusted basis and even negative on an unadjusted basis.
As that 2,000,000 bump is a cumulative increase, the apparent “surge” overall employment for January per the Household Survey data is in fact an illusion. If anything, the Household Survey data shows continued softening in the labor markets month on month, in both the seasonal and raw data.
That assessment of the Household Survey is confirmed by the continued rise in those not in the labor force.

Eliminating the year end adjustment for that survey demographic would reduce but not eliminate that rise in January.
Further, with the year-end adjustment included, the January change in the unemployment level shows an encouraging decline.

We should note that backing out the year end adjustment of 106,000 would make that decline greater.
Unfortunately, that bit of good news is largely mooted by the ongoing rise among those not in the labor force. When we take into account the overall impact of the year-end adjustments in the Household Survey data, what we see is that any decline in the unemployment level is merely a shifting of non-working individuals from the unemployment category to the “Not In Labor Force” category.
In other words, the Household Survey data is still not showing any actual sustained growth in employment.
Sloppy Data But Bad News
That the BLS jobs data is sloppy and structurally flawed has at this point been proven in abundance. That corporate media can still take the monthly jobs reports at face value is quite a remarkable demonstration of commitment to narrative even at the expense of credibility and common sense.
Whether the large revisions being made are the result of deliberate malfeasance or simple ignorance is, at this point, almost moot. The end result is the same: sloppy data with diminished utility for developing a complete picture of the state of US labor markets. The end result is data that does not add up without a goodly dose of vaudevillian mathematical mangling, which I have long labeled Lou Costello Labor Math in homage to the classic Abbott and Costello skit “7 times 13 is 28”.
Even so, that sloppy data has, contrary to the bloviations of government experts and the corporate media chattering class, consistently and persistently shown significant and growing weaknesses within the US labor market.
That sloppy data has shown for months that this country is in a jobs recession. We are not producing anywhere near the number of jobs this country needs to ensure the working age population is gainfully employed.
That sloppy data has for over a year sounded the alarm on manufacturing in this country. This in particular is a trend Donald Trump must work to reverse, if he is ever to fulfill his Agenda 47 campaign promise of making the United States a manufacturing superpower. We cannot be a manufacturing superpower at the same time the economy is losing manufacturing jobs.
Most of all, that sloppy data still manages to show how corporate media is either gaslighting the public or simply does not care enough about accurate reporting to take the time to fully analyze and understand the data. Every time corporate media talks up the strength of the economy and the resilience of labor markets, they are spouting mostly pure nonsense.
Weak jobs markets mean more and more people are seeing prosperity slip out of their grasp.
Weak jobs markets mean more and more people are not earning sufficiently to generate the consumption upon which the US economy is highly dependent. No job means no paycheck means no money means no buying of anything.
Weak jobs markets are a major reason people are struggling to pay their bills and put food on the table. Consumer price inflation hits people hardest when their wages are unable to rise to match the rise in consumer prices.
A great many people have reacted to the incoming Trump Administration with burst of hope and even optimism that this country is perhaps starting to move in a positive direction. Perhaps they are right—one certainly hopes they are.
Thus far the jobs data has yet to show that jobs markets are moving in a positive direction.
We are in a new year, and we are at the start of a new Presidential Administration, but we are still stuck with the same bad jobs data and bad jobs news from the Bureau of Labor Statistics.
Peter, if this was a shooting contest, you just put around thirty bullseye shots into this corrupt government target. Thanks!
I’d like to point out two things. One is that if the BLS is overcounting jobs Every Single Month then that’s FRAUD, and DOGE should fire every government employee complicit in releasing these deceptive figures! The other point is regarding productivity. If job increases are in “social assistance “, those are mostly unproductive taxpayer-funded jobs that just increase the national debt, without much increase in productivity. Meanwhile, jobs lost in mining, oil exploration, and other jobs that actually improve productivity are being lost, and that’s a decrease in our nation’s standard of living.
I believe Trump’s team understands all about productivity, and is aiming to restructure the economy back towards increasing productivity. Yee haw!