Inflation Heats Up As Expected…But More Than It Should
November CPI Data An Object Lesson In Details
Always beware the accurate prediction.
If a prediction matches up with the exact value predicted, be suspicious of both the prediction and that value.
That is the takeaway from the November Consumer Price Index Summary. While it reported inflation matched Wall Street predictions, a closer inspection of the underlying data makes that match curiously convenient.
The Consumer Price Index for All Urban Consumers (CPI-U) increased 0.3 percent on a seasonally adjusted basis in November, after rising 0.2 percent in each of the previous 4 months, the U.S. Bureau of Labor Statistics reported today. Over the last 12 months, the all items index increased 2.7 percent before seasonal adjustment.
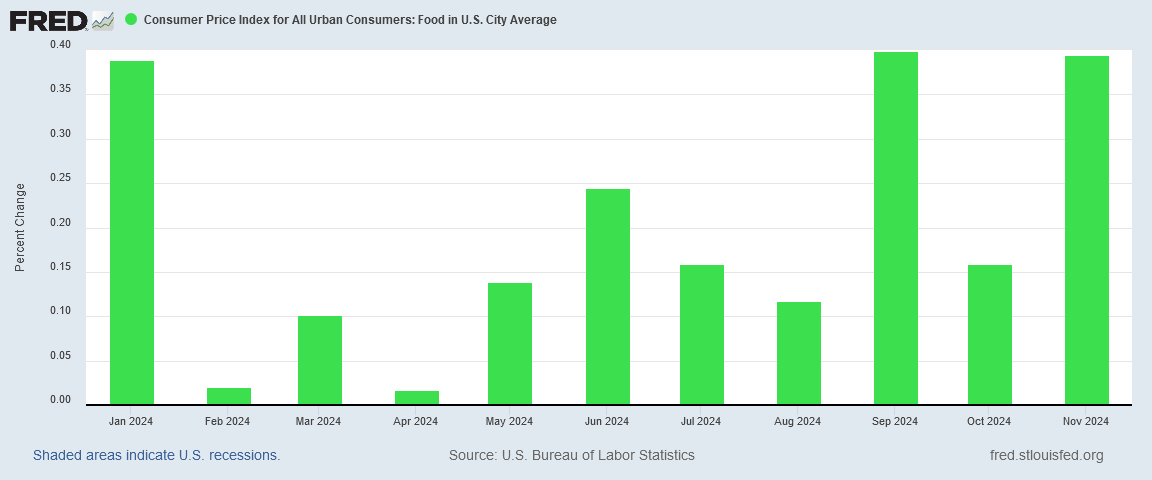
The index for shelter rose 0.3 percent in November, accounting for nearly forty percent of the monthly all items increase. The food index also increased over the month, rising 0.4 percent as the food at home index increased 0.5 percent and the food away from home index rose 0.3 percent. The energy index rose 0.2 percent over the month, after being unchanged in October.
The headline number confirms what I have been saying for a while—namely, that inflation is on the rise. However, when we peel back the layers of data underneath, we see that the headline inflation rate is being reported higher than it should be.
We need to peel back those layers to understand what is going on, and what the November CPI report is telling us. As usual, those are the details corporate media prefers to ignore, and which give the fuller picture of how inflation distorts and damages the overall economy.
On the surface, the Consumer Price Index Summary report was not at all surprising. As I had noted last week, there was going to be at least some inflation.
Most likely, we will see an incremental uptick in year on year consumer price inflation, just as the InflationNow nowcast suggests (InflationNow has a pretty good track record for accuracy, and is rarely off by more than a couple tenths of a percentage point).
The report certainly seemed to bear that out. Headline and core inflation both rose to 0.3% month on month.
As I had expected, food price inflation rose to 0.4% month on month.
Overall, Wall Street took the inflation numbers in stride, having largely priced in the higher inflation data.
However, what Wall Street failed to notice was that the actual month on month inflation numbers were significantly above where the Cleveland Fed’s InflationNow nowcast had projected.
That variance disappears when we look at the inflation rate year on year, however.
For the past several months, the InflationNow nowcast has been fairly accurate. This was a rare month where the nowcast underestimated inflation rates.
Obviously, there were some unexpected results in the November data. For starters, there was a bit of energy price inflation month on month.
This was unexpected. As I had commented in Substack Notes earlier in the week, the expectation was for more energy price deflation.
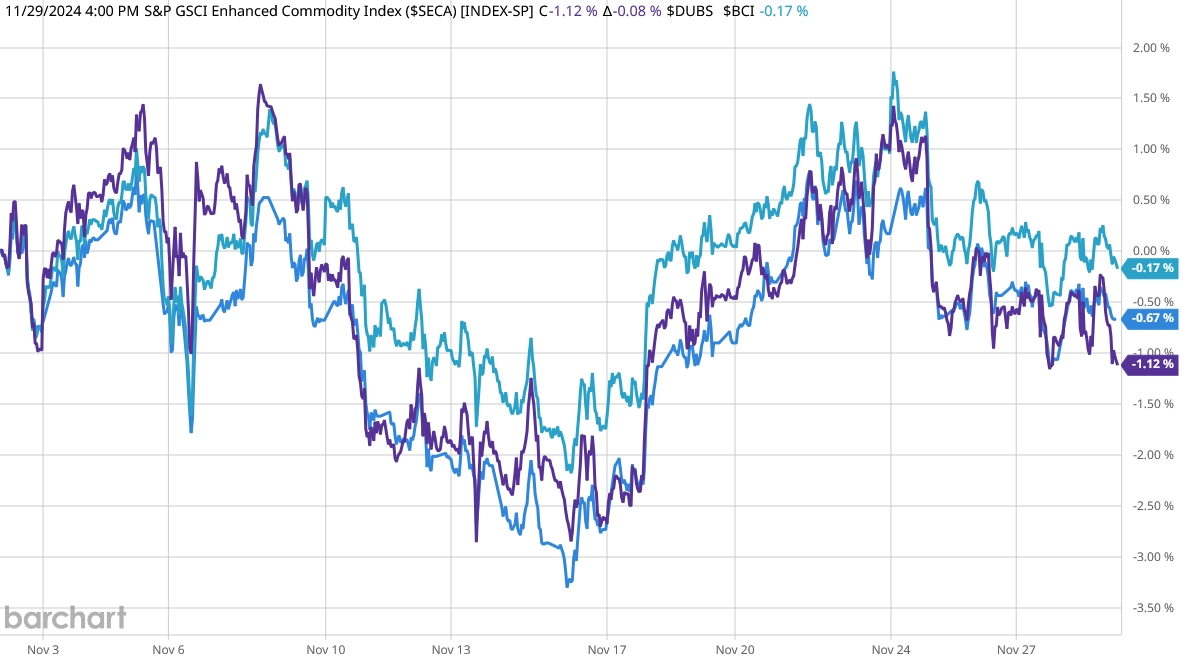
There is no doubt that all the signals were for the CPI energy index to decline. Energy prices were down across the board for November, especially crude oil prices.
How did energy prices end up showing inflation for the month?
Two words: “seasonal adjustment.”
The raw energy price index data does show continued deflation. Only when the BLS applied their seasonal adjustment algorithm did the data flip into inflation.
The numbers that are routinely reported by the media are the seasonally adjusted numbers, and in most months the seasonally adjusted numbers are the ones I use most frequently. As a rule, if the seasonal adjustment is done properly, it should rarely if ever produce anomalous results such as these.
We should note, however, that when we look at energy price inflation year on year, comparing the seasonally adjusted chart to the unadjusted chart, this variance largely disappears.
Is the BLS seasonal adjustment process flawed? That is quite possible, especially when we consider some of the other variances within the data. We may reasonably conclude, however, that the seasonally adjusted energy price index is probably overstating at least month on month inflation. With all market indicators showing energy prices themselves heading down on the month, energy price deflation is almost certainly the more accurate representation of the current data.
Goods prices were another surprise. The pricing signals were all pointing towards continued goods price deflation. Most notably, commodities were, like energy, down on the month—commodities are best apprehended as the precursors to most manufactured goods, as they are the raw materials for any manufacturing process.
Just as with energy, we see the seasonally adjusted data diverge from the raw data for durable goods pricing.
Before seasonal adjustments, durable goods were showing deflation.
Nondurable goods also flipped from deflation to inflation as a result of the seasonal adjustment process.
While this was the first such divergence in three months for nondurable goods, it was also the largest variance between the seasonally adjusted data and the unadjusted data since March.
When we look that base indices, we see a clear break in the seasonally adjusted charts.
For durable goods, that break occurred in August.
For nondurable goods, it was only in the past month that the seasonally adjusted and raw charts chose to diverge.
Seasonal adjustment calculations are intended to smooth out volatility that is cyclical in nature. Accordingly, we would not expect a trend from the raw price index data to be completely reversed in the seasonally adjusted data. Yet that is what seems to be happening at least with goods and energy prices.
Consequently, we may reasonably conclude that goods prices are also overstated in the seasonally adjusted data. Overall headline inflation is still rising, but it is likely not rising as much as is currently being reported by the BLS.
Another aspect of the CPI report that may be overstating current inflation is shelter.
The shelter component of the Consumer Price Index tends to lag housing markets. As a result, there is a certain structural inaccuracy built into that part of the CPI.
We can get a sense of how much the CPI shelter price index varies from actual inflation in rents by comparing it to a more forward index of housing rents, such as the Zillow Observed Rent Index (ZORI). When we do, we see two dramatically different inflation curves.
While the CPI shelter price index still shows elevated inflation rates for apartment rents, the ZORI indicates that rents are declining.
To a degree, we should expect this behavior. As the shelter component in the CPI is a trailing indicator, it both understates shelter price inflation during periods of rising inflation and overstates that same inflation during periods of deflation. The ZORI data suggests we are in a period of deflation for rents, which means that component of consumer price inflation may also be overstated.
Even food price inflation warrants a bit of scrutiny here. While the seasonally adjusted data does show the greatly elevated food price inflation that I had forecast last week, the raw food price index data showed a disinflationary shift in food prices month on month.
Once again, however, that variance disappears when we look at the food price inflation rate year on year.
Once again, this discrepancy is best understood as an artifact of the seasonal adjustment process rather than an actual rise in food prices month on month.
Food price inflation is still happening, but it may be contributing less to headline inflation that the CPI report indicates.
What should we make of the report? Is the data completely corrupted and tainted by poor seasonal adjustment calculations?
With inflation data especially, we should always approach the data with a certain skepticsm. Even without anomalous results between the seasonally adjusted data and the raw price index data, the constant caveat with inflation data should always be “Your Mileage May Vary”. Depending on how one shops, and depending also in what part of the country one lives, the experience of consumer price inflation could easily be greater than what the CPI report shows. It could also be less.
This does not mean that we should assume that there is no inflation being reported. Even on an unadjusted basis, services, for example, still shows inflation.
When we look at the raw headline and core inflation rates year on year, we see that core inflation did not go down in November.
Even without seasonal adjustments, the headline inflation rate still rose last month. It may not have risen as much as the seasonally adjusted data indicates, but the inflation rate did rise.
There are good reasons to question the inflation data compiled by the BLS, and flaws with how that data is seasonally adjusted is only one of them. We certainly should not make the mistake of equating the Consumer Price Index to actual consumer prices. Rather, we should remember that the Consumer Price Index is a broad brush overview of consumer prices across the whole of the US economy, and that there are quite a few layers within that data.
When we peel back the layers within the CPI data, we see exactly what I said would be there. We see both inflation and deflation. We see that in the data because that is what we can see happening in the US economy—there are prices which are rising and prices which are falling.
That some prices rise and some prices fall tells us once again that the impact of inflation is most of all one of distortion. Prices are not merely rising or falling in absolute terms, but are rising and falling with respect to each other. That goods prices are falling magnifies the degree to which service prices are rising. That energy prices are falling makes us more aware when food prices are rising. These distortions within consumer prices are the damage that inflation does to an economy.
The November CPI report shows that inflation is heating up, and that consumer prices are rising. Peel back the layers of data, however, and the report also shows how inflation is distorting consumer prices.
Inflation is still doing its damage to the economy, and for all its likely flaws, the November CPI report shows us that.


Your assessments always make me feel like I’ve read the truth at last.
Now that you have this data, Peter, I’m looking forward to your assessment of how China’s deflation is likely to affect the US economy. No rush, just whenever seems like the appropriate time. Thank you in advance!