Inflation Is Cooling Down, But So Are Disposable Incomes
Food And Energy Are Still Painfully Expensive
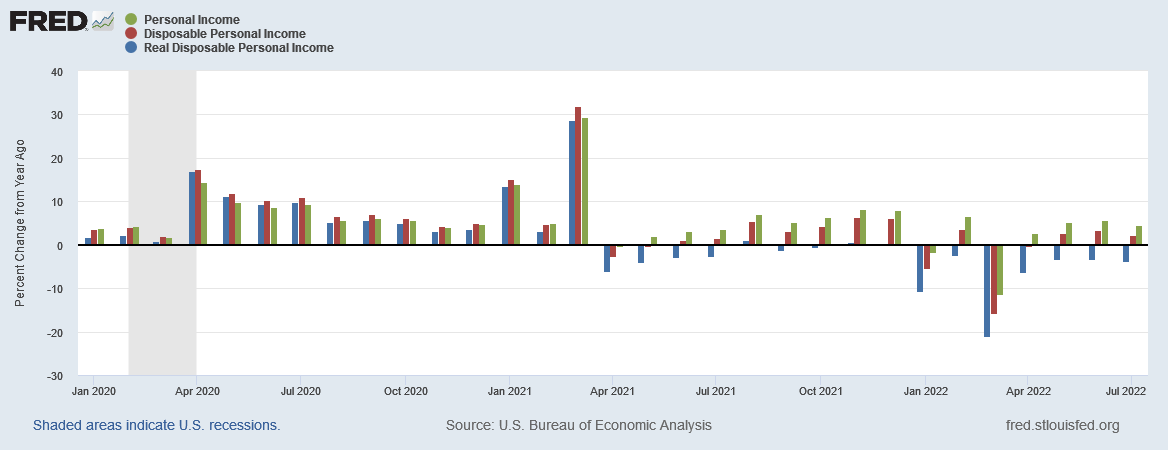
As anticipated, the BEA’s Personal Income and Outlays Report for July showed consumer price inflation cooling somewhat. However, while disposable incomes notionally rose for the month of July, compared to July of 2021 real disposable incomes declined yet again, as they have every month this year.
Personal income increased $47.0 billion (0.2 percent) in July, according to estimates released today by the Bureau of Economic Analysis (tables 3 and 5). Disposable personal income (DPI) increased $37.6 billion (0.2 percent) and personal consumption expenditures (PCE) increased $23.7 billion (0.1 percent).
Inflation Came In Where Projected
It is worth noting that my assessment of where PCE inflation would come in was largely accurate.
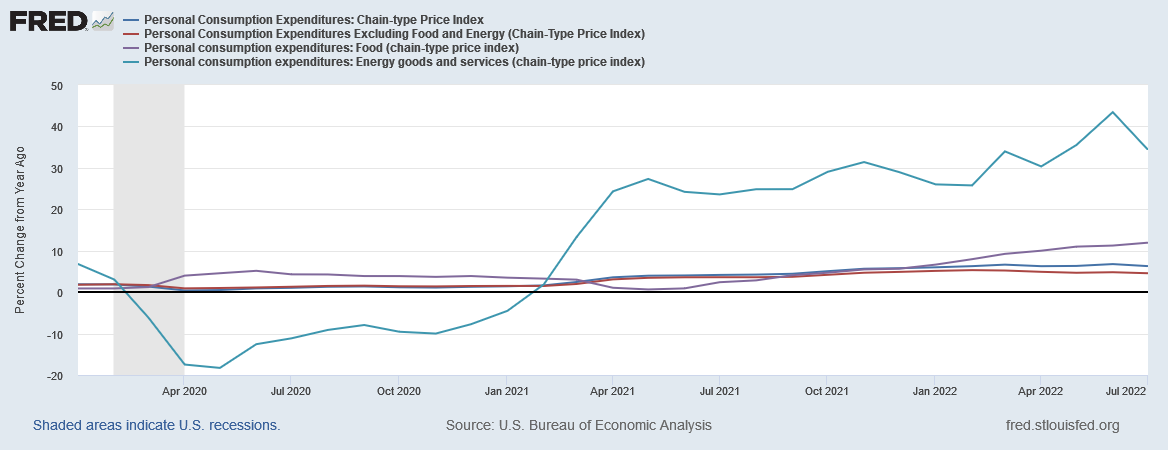
I anticipated that PCE inflation would be between 6.2% and 6.4%, with Core PCE Inflation coming in between 4.7% and 4.8%. The BEA reported PCE inflation at 6.3%, with Core PCE inflation coming in at 4.6%
The relevance of this is that it confirms the utility of the Cleveland Fed’s Inflation nowcast for gauging where inflation might be headed in the near term, and also the utility of indpendent indices such as Datasembly’s Grocery Price Index for gauging how certain subindices are likely to behave. Ultimately, the percentages themselves are less informative about inflation than the overall trends and differences in magnitude among the various elements of a price index. Knowing good data tools for cross-reference and sanity checks is helpful to everyone.
The Media Missed The Mark—Again
In what is ever a recurring theme on the corporate media, they largely glossed over crucial internal elements of the PCE to trumpet the headline numbers.
From the Associated Press:
According to Commerce Department report Friday that is closely watched by the Federal Reserve, consumer prices rose 6.3% in July from a year earlier after posting an annual increase of 6.8% in June, biggest jump since 1982. Energy prices made the difference in July: They dropped last month after surging in June.
So-called core inflation, which excludes volatile food and energy prices, rose 4.6% last month from a year earlier after rising 4.8% in June. The drop — along with a reduction in the Labor Department’s consumer price index last month — suggests that inflationary pressures may be starting to ease.
From CNBC:
A key measure of inflation closely watched by U.S. policymakers showed that price increases slowed in July, the Bureau of Economic Analysis said Friday.
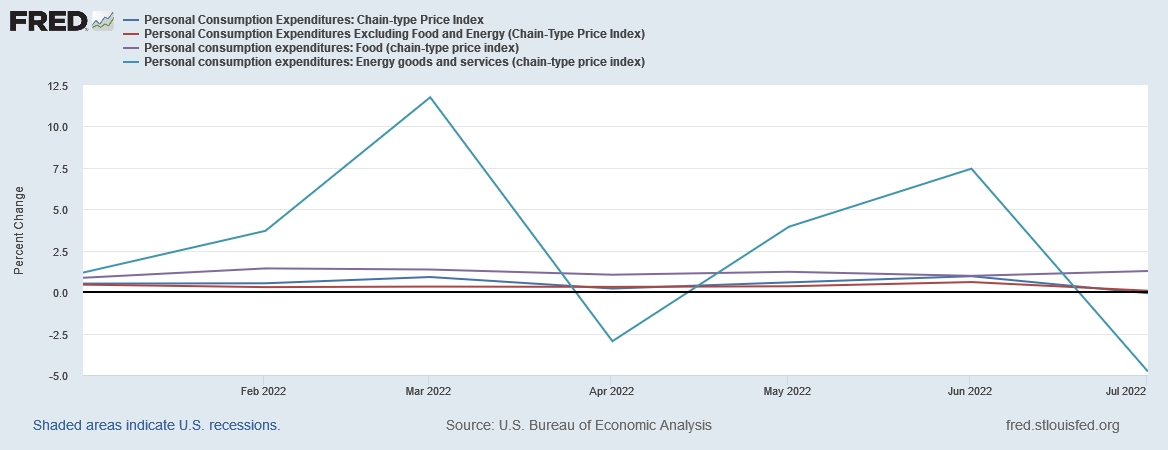
The personal consumption expenditures price index came in with a year-over-year rise of 6.3% in July, down from 6.8% in June. The index actually fell 0.1% month over month.
Nor is the corporate media alone in failing to grasp the essential realities of inflation. Most economists surveyed by Dow Jones apparently were also largely focused on the headline numbers rather than dissecting the internals of the inflation metric.
The core PCE index, which excludes volatile food and energy prices, showed a 4.6% rise year over year and a gain of 0.1% month over month in July, coming in softer than forecasts on both counts. Economists surveyed by Dow Jones were expecting 4.8% for the core year-over-year reading and 0.2% for the month-over-month change.
Bloomberg perhaps take the clueless crown with its banal and factually false pontifications about a “robust labor market” driving the numbers.
The weaker-than-expected report suggests the backbone of the economy started the third quarter on rockier footing than previously thought. While a robust labor market paired with sizable and sustained wage increases has supported consumer spending in recent months, widespread inflation is eroding those gains.
As I have detailed previously, the labor markets are not “robust”.
Moreover, while wages and incomes have risen from June, year-on-year real disposable incomes are still down significantly.
Less real disposable income means less money to spend no matter what inflation is doing—and Americans have been experiencing declining real disposable income all year long.
Energy Prices Have Declined From June, But Are Still Up From 2021
While energy price inflation has eased significantly, it is still a very real and dominant economic force at the moment. Within the PCE data, energy price inflation fell from 43% year on year in June to 34% year on year in July. While any decline is welcome, it must not be forgotten that even July’s “cooler” inflation data shows energy prices are greater than they were this time last year by as much as one-third.
That level of year-on-year increase is why 20 million US households are behind in their electric bills, to the tune of nearly$18 billion.
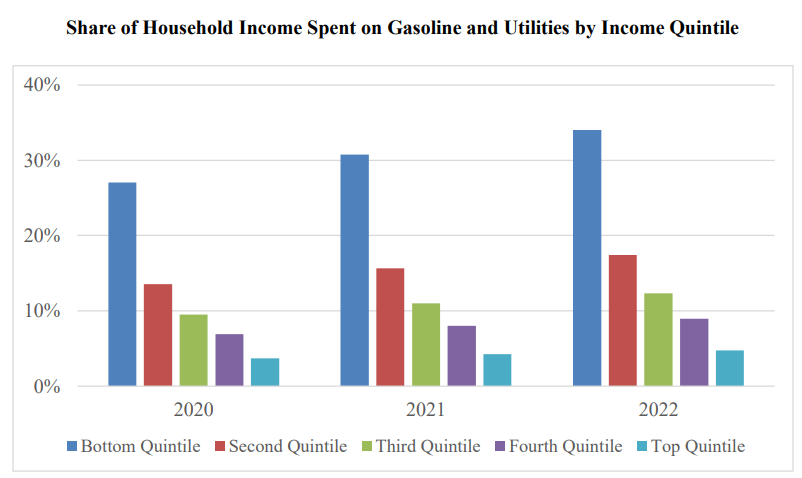
Inflation might well be easing overall, but at 34% energy price inflation can plausibly be termed energy price hyperinflation, and must be viewed as an unsustainable rate of increase particularly for lower income households, who are spending more and more of their monthly budget on energy.
Do not expect the corporate media to highlight this particular nuance to the inflation data.
Food Price Inflation Is Getting Worse, Not Better
What the corporate media also failed to mention is that even within the PCE itself, food price inflation is getting worse, not better, rising from 11.2% year on year in June to 11.9% year on year in July. Even month-to-month food price inflation increased, rising from 0.98% in June to 1.27% in July.
While inflation overall might be easing, food price inflation once again is getting worse, not better, just as was true for food price inflation within the CPI data.
Even more distressing is the reality that food price inflation for food purchased for home consumption is rising faster than food price inflation for eating out, both at the month-on-month level and the year-on-year level.
This is not a new trend, but one that has been an ongoing phenomenon for over a year (which means it cannot be blamed on Putin, Russia, or Ukraine).
Headline Numbers Are Good News, And That’s It
The Personal Income and Outlays report demonstrates yet again how the headline data can often obscure the less attractive truths contained within a particular data set. Headline income levels, and even headline inflation, are all seemingly moving in the right direction within the report for July, but that positive top layer of data obscures layer after layer of problematic and negative data within the report.
Headline inflation may be cooling off, but food price inflation is heating up, and energy price inflation remains just one new geopolitical crisis away from jumping back into the stratosphere. These are not good trends for either subindex, and they are not good trends for the report as a whole.
The headline numbers are all the good news there is in the report. Everything underneath is either problematic at best or outright negative. It is not a positive assessment of Americans’ current economic circumstances at all.


If inflation is defined as an increase in prices (which is erroneous), and inflation increases moderate; i.e., prices are not increasing as fast as they had been, it won't help too much if the new inflated prices don't come down. We're stuck with the same income paying for higher prices. Am I missing something?