At first glance, the July Producer Price Index summary echoes the Consumer Price Index report: Inflation has returned during the month of July.
The Producer Price Index for final demand increased 0.3 percent in July, seasonally adjusted, the U.S. Bureau of Labor Statistics reported today. Final demand prices were unchanged in June and declined 0.3 percent in May. (See table A.) On an unadjusted basis, the index for final demand advanced 0.8 percent for the 12 months ended in July.
As you will recall from yesterday’s discussion of the CPI, the producer price inflation increase is on par with the rise in consumer price inflation.
Perhaps unsurprisingly, we see within the PPI data some of the same dichotomies as are in the CPI data set, deviations from observed real world prices which give us reason to question the accuracy of the PPI itself. As with the CPI, energy is the big standout here.
Digging further, however, we also see signs that, while producer price inflation rose in July, it may resume its downward trend before too long. If the emerging trends in the PPI hold, there is a substantial deflationary impulse still to move through the US economy.
That the PPI is reporting inflation during July is somewhat counterintuitive, given that last month’s report was showing deflation and decline throughout.
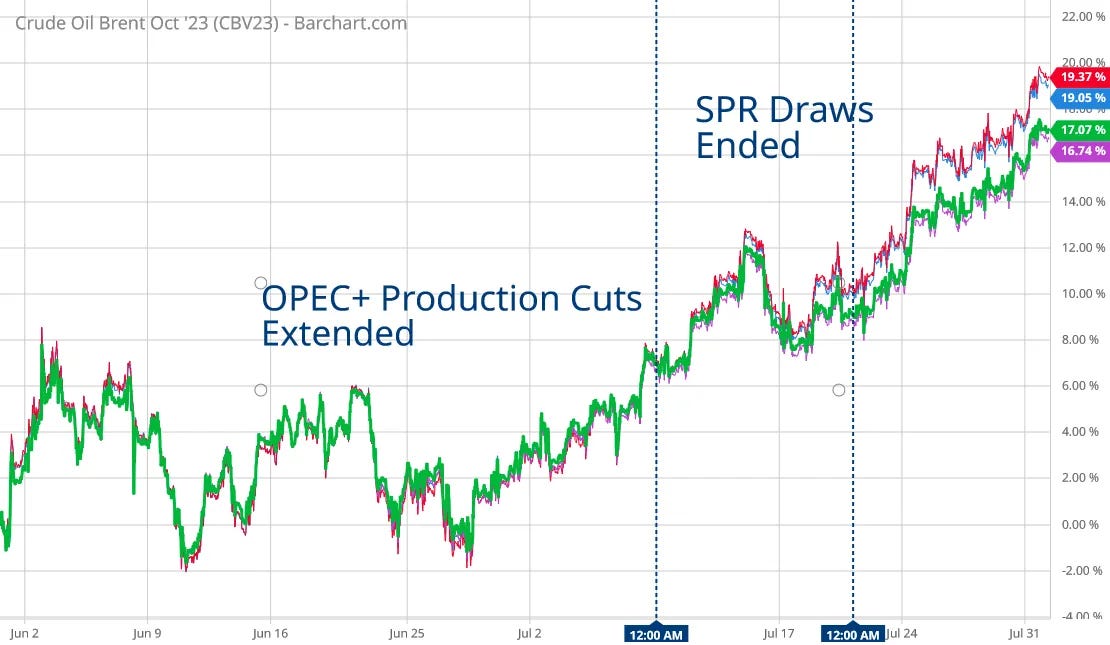
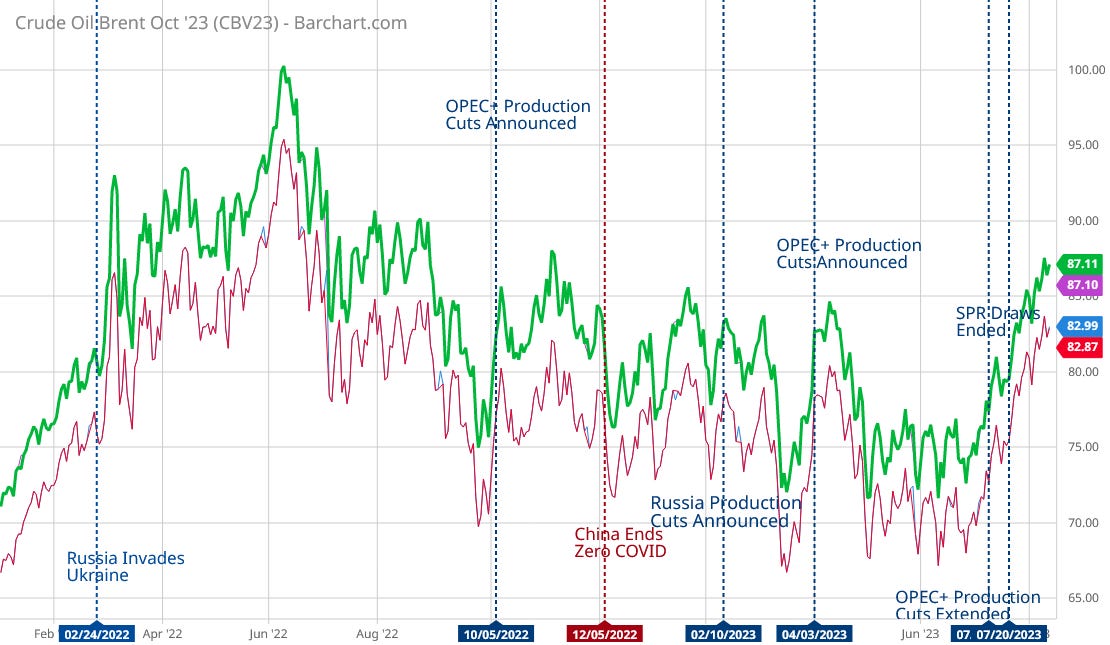
However, the nature of economic data is that it is forever a moving target, with new influences and factors emerging all the time. In July, the energy picture in particular changed. There were at least two important events during July that produced significant upward pressure on crude oil prices: OPEC extended its production cuts for another month at least, and the US government ceased releasing crude from the Strategic Petroleum Reserve.
In the same time frame when these events unfolded, oil prices went from holding stead to rising.
As we saw throughout the energy supply chain yesterday, energy prices were up on several fronts.
If we index the EIA spot price data to the beginning of June, we get percentage price increases that are considerably more than what appears in the energy price index or the energy commodities price index.
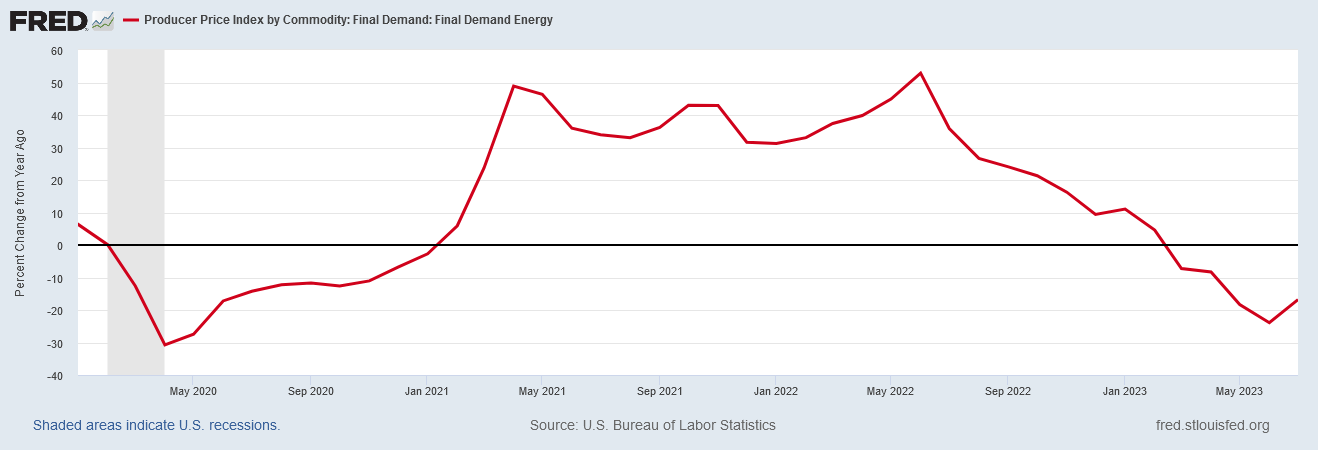
This stands in contrast to what even the PPI says about “final demand” energy: that it declined year on year but only slowed month on month.
Year on year, energy price inflation per the PPI continues to decline, albeit at a slower pace than in June. That’s a 16% decrease in July year on year vs a 23% drop in June.
Month on month, energy price inflation per the PPI rose by 0.3% during the month of July, a marked slowdown from the 1.6% month on month increase in June.
Much as with the Consumer Price Index, the price data for the Producer Price Index failed to note any of the significant new pricing pressures coming from the OPEC+ reductions on crude oil productions or the White House turning off the spigot to the Strategic Petroleum Reserve. As with the CPI, the PPI for Final Demand Energy is quite likely understating the situation, which also suggests the PPI itself has understated actual producer price inflation.
However, while the PPI for Final Demand Energy is likely understating current inflation, we should not overlook the reality that the PPI has, broadly, been showing a significant disinflationary/deflationary trend for the past twelve or thirteen months.
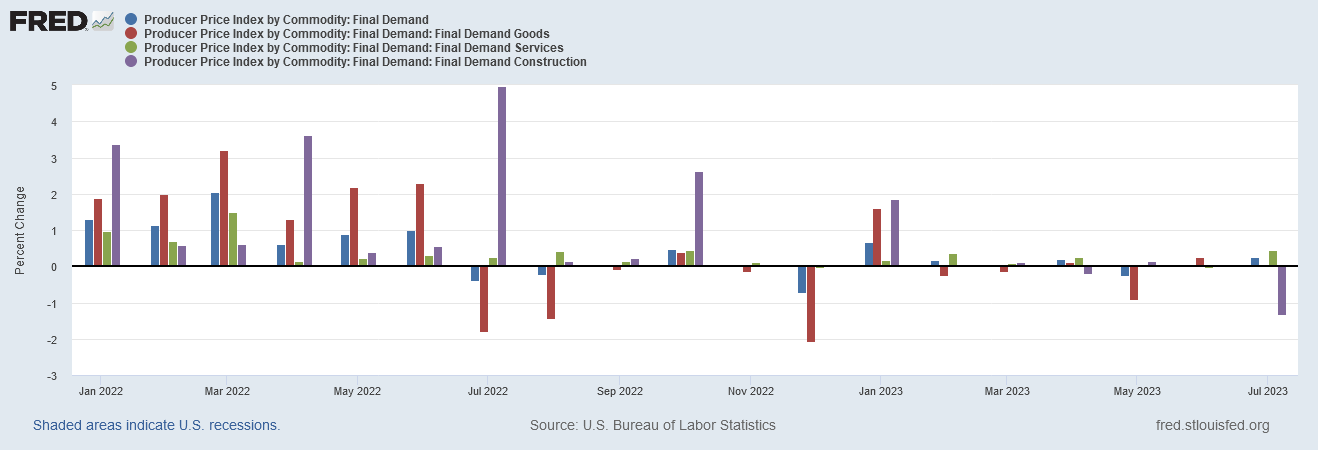
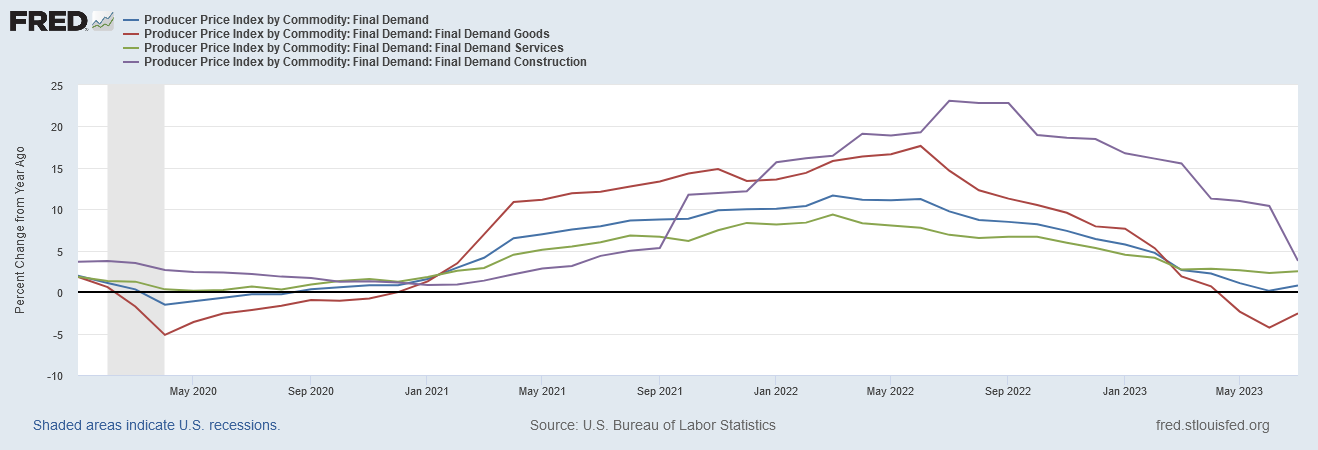
When we look at the month on month percent changes to the major components of PPI for Final Demand, one trend is unmistakable: After June of 2022, upward price pressures all but vanished.
Year on year percent changes to PPI for Final Demand show similar inflection point in the same time frame.
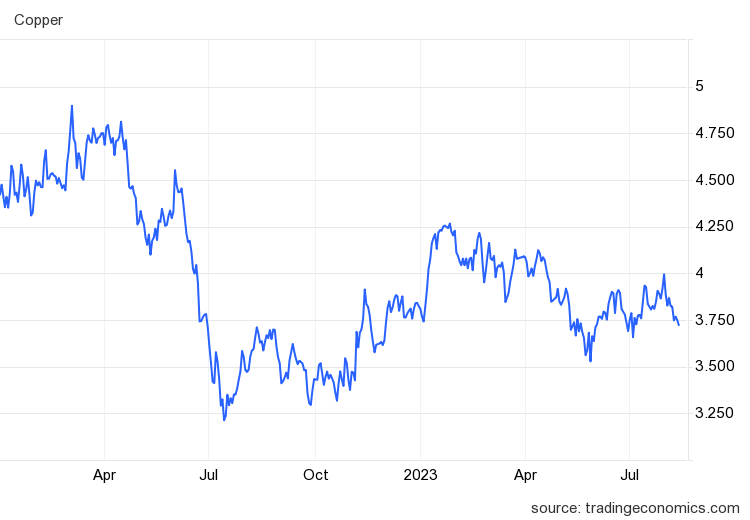
Give the obvious questions of accuracy and credibility within the PPI data set already established, we should not automatically conclude this is a clear deflationary signal. However, we see in that same time frame price declines in a number of industrial commodities.
In June of 2022 there was a drop in copper prices.
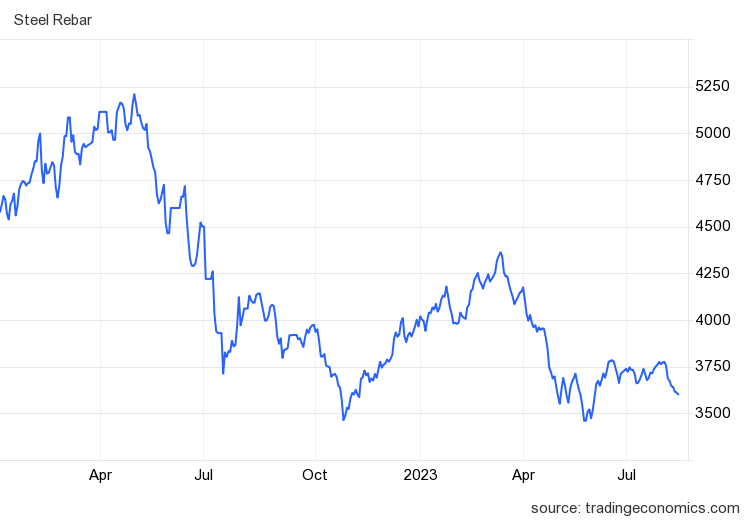
There was a similar drop in steel rebar prices.
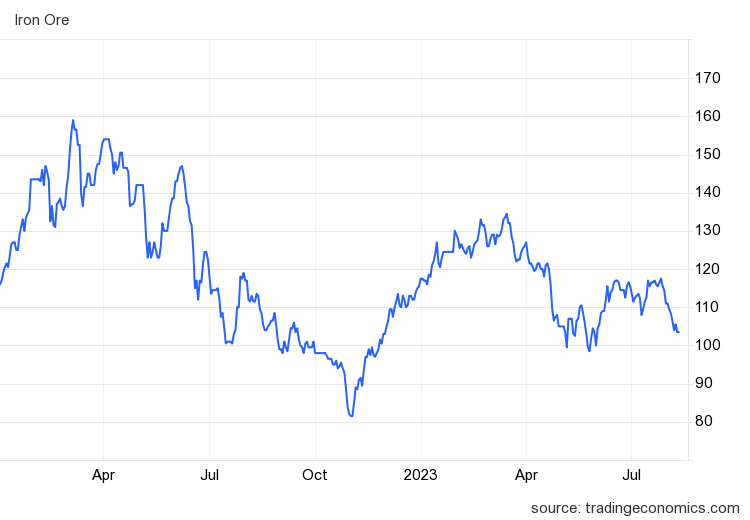
There was a similar drop in iron ore prices.
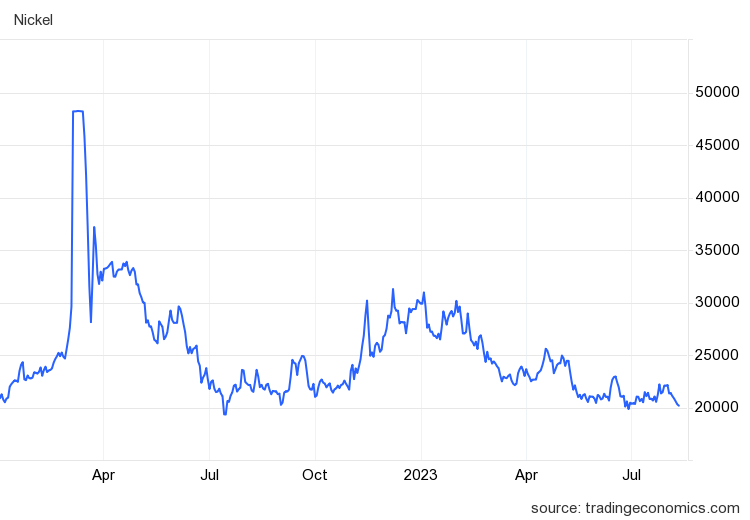
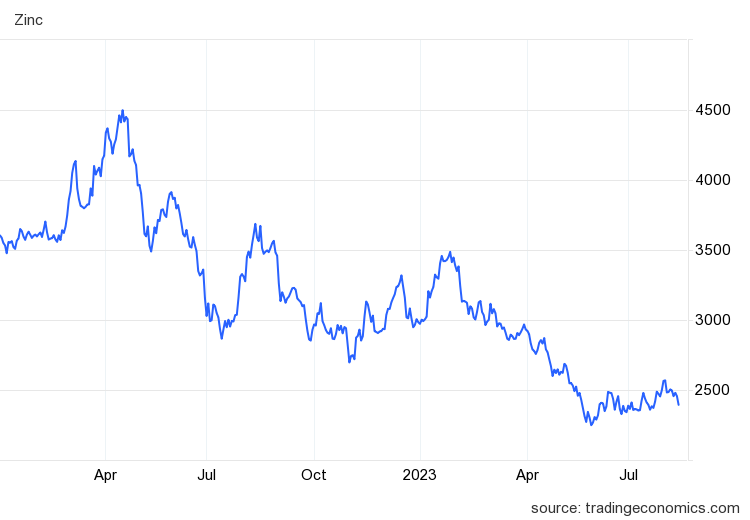
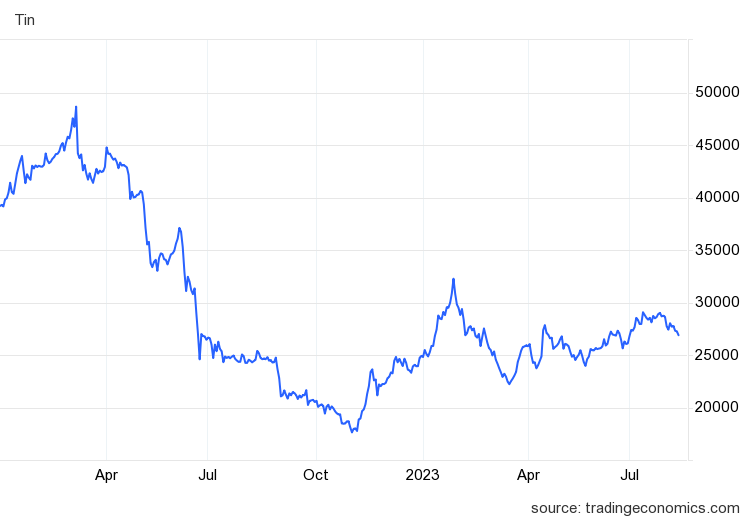
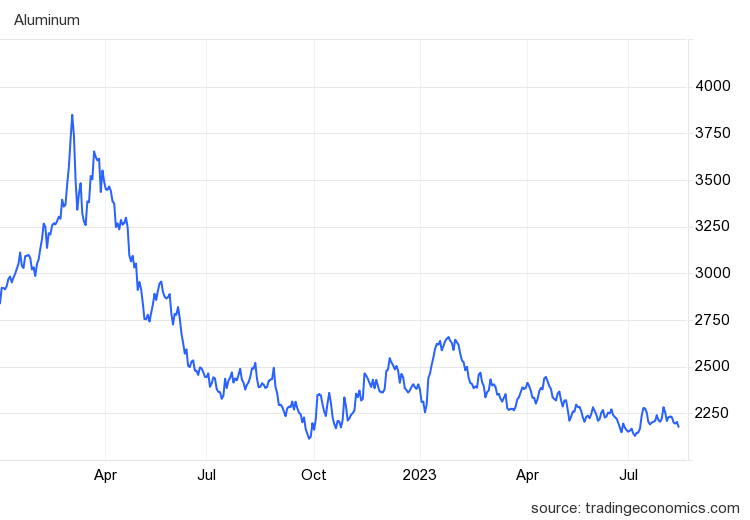
The spring of 2022 saw a number of commodity prices drop, including nickel, zinc, tin, and aluminum.
While not all of these commodity price declines began in June of 2022, none of them started after.
June 2022 was also the high-water mark for oil prices.
A drop in commodity prices during the spring of 2022 would result in the abatement of price pressures as recorded in the PPI. Accordingly, these multiple declining price trends indicate the shift in the PPI towards disinflation and deflation after June, 2022, may be presumed to be confirmed.
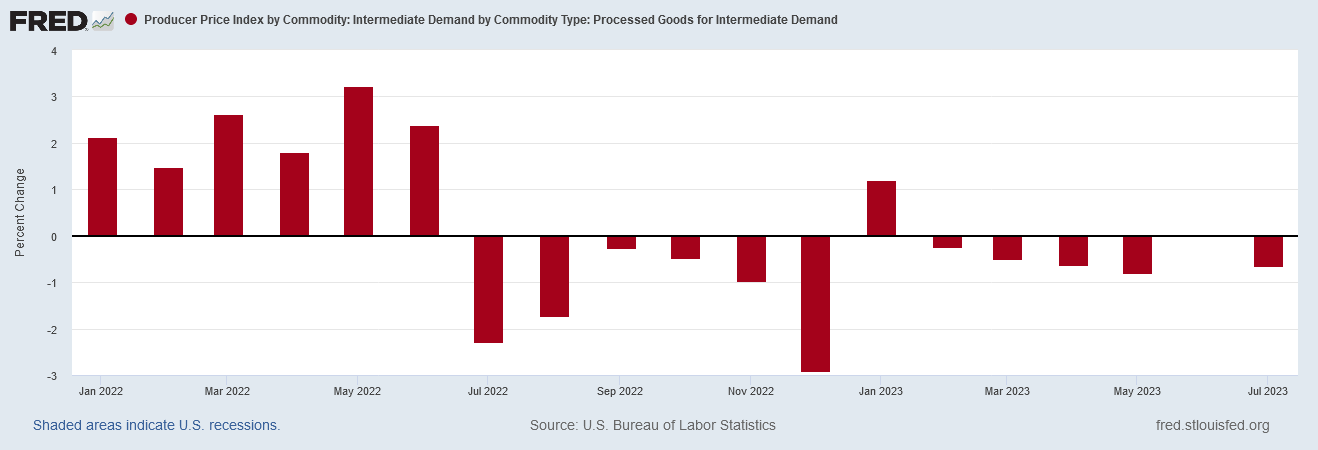
The confirmed disinflationary/deflationary shift in the PPI last summer also compels us to look seriously at the PPI for Intermediate Demand. Unlike the PPI for Final Demand, the PPI for Intermediate Demand is still showing a definite deflationary impulse.
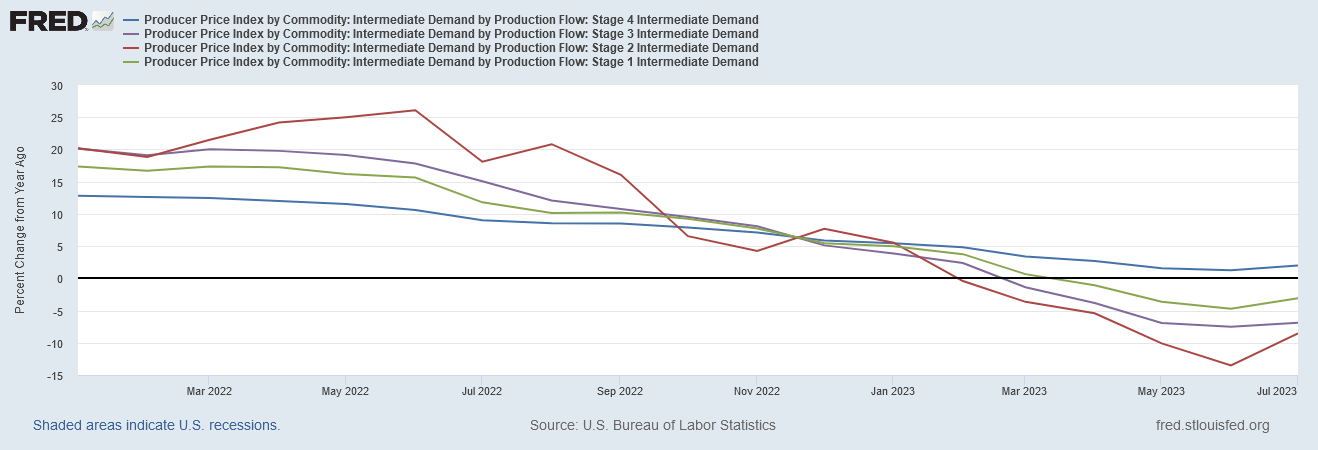
When we look at the stages of Intermediate Demand, we see the same overall disinflationary/deflationary trend even in the year on year percent changes.
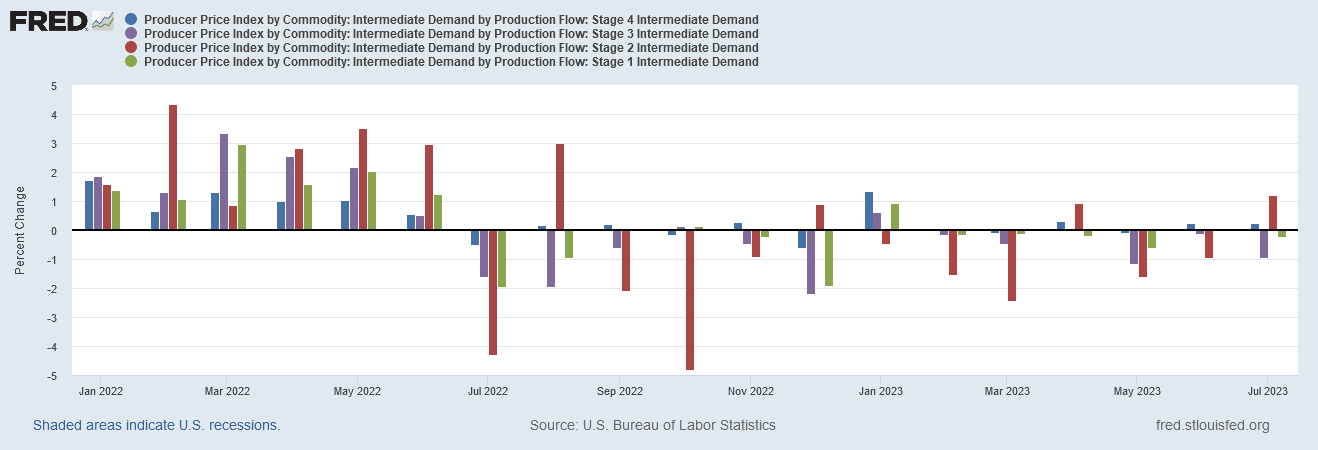
Month on month, the stages of Intermediate Demand still show significant trends of disinflation and deflation.
While there is in July some indication that some stages of Intermediate Demand are showing a smidgen of inflation, the overall picture since June of last year is still one of disinflation and deflation across the board. Certainly the recent drops in the commodity prices shown above are consistent with continued disinflation and deflation at least for the very near future.
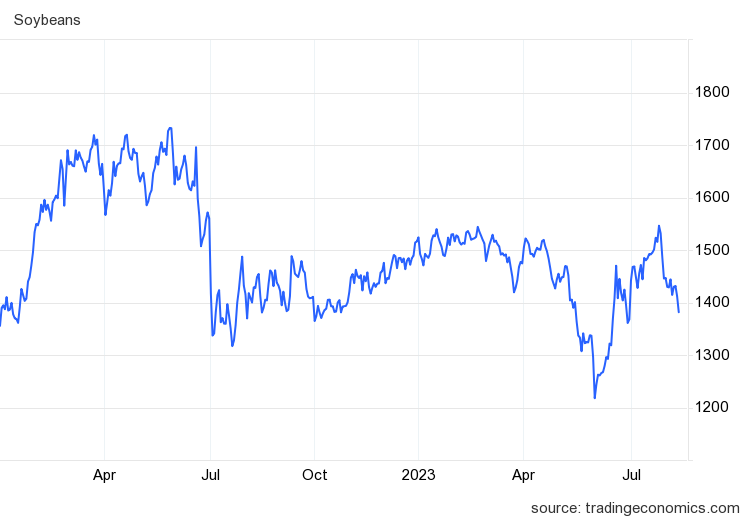
Even food commodities are for now still indicating more downward price trends than upward. When we look at the futures contract for soybeans, for example, we not only see the same downward inflection point in June of last year, we see what may be a similar inflection point just last month.
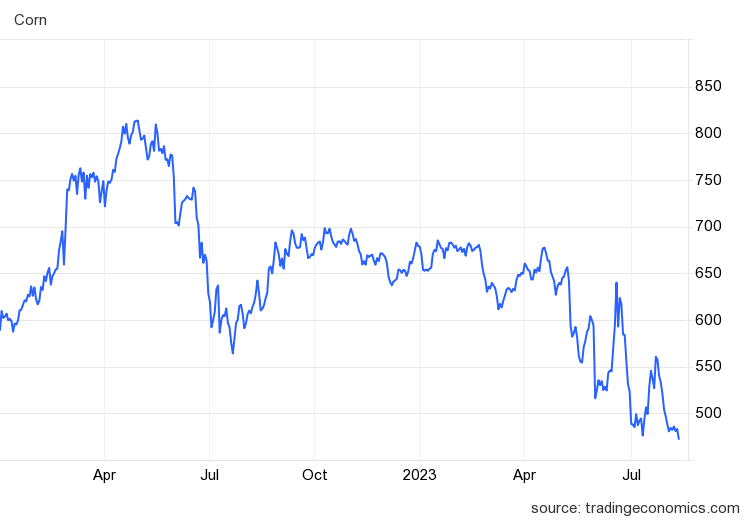
We see the same trends in corn prices.
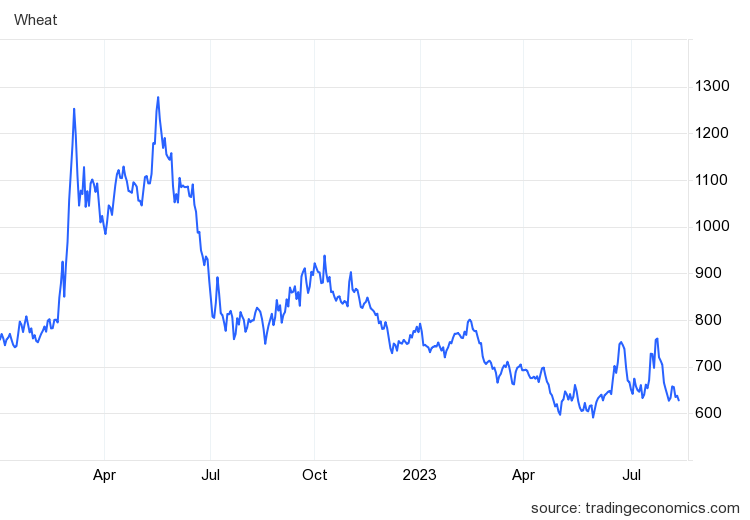
Even wheat prices are still showing a downward price trend, which is surprising given the recent collapse of the arrangements allowing shipments of grain from war adversaries Ukraine and Russia to traverse the Black Sea unmolested.
While we are seeing some signs of food price inflation, there is also significant indication of food price disinflation, and perhaps even food price deflation as well.
Thus while the Producer Price Index goes a long way towards confirming the present-day rise in inflation as reported in the Consumer Price Index, the PPI also makes a substantial argument that the future holds strong disinflationary and deflationary trends as well. At least some prices are likely to continue to decrease, even if other prices reverse trend and begin increasing after July.
Given the inflationary signals contained in the Consumer Price Index report from yesterday, to speak of disinflation and deflation within the PPI seems rather counterintuitive. If we look at the trends presenting within various modalities of the CPI, we are forced to conclude, broadly speaking, that the next few months at least will show significant price increases.
Yet the PPI, which is widely viewed as a predictor to the CPI, is also suggesting that the future will contain strong disinflationary trends going forward. At least some prices ought to be coming down, or at least rising a lot more slowly.
One resolution to these incongruous predictors is to simply accept the reality that the future is going to be a grab-bag of price trends, with various consumer prices trending up while other consumer prices trend down.
Another possible reconciliation hinges on the view that Intermediate Demand represents goods and services that are still flowing through the manufacturing chain. With PPI for Final Demand showing inflation and PPI for Intermediate Demand showing disinflation/deflation, we might be forgiven for summarizing those dichotomous results as “inflation today, deflation tomorrow.”
What both reconciliation paths indicate, however, is that the US economy is (and really has been) in a stagflationary stupor since last June. Inflation and deflation, as macroeconomic forces, are at present coexisting within the US economy. The end result is consumers are saddled with higher prices while having fewer opportunities for the wage increases that would signify real economic growth.
Inflation and deflation happening concurrently: the ultimate double whammy where consumers are facing a prolonged period of paying more while buying less. That is what the Producer Price Index says is in store for the US.







Great post as usual. My question is how this may all be related to excess deaths which are trending at 10-20%. If we are losing 10-20% of the population in western nations (and the 25-44 age group is hit hardest), what does that mean for all of these economic indicators...it would seem at some point it will show up.
Thank you for bringing clarity in the stagflation fog. We are definitely paying more but buying less.