The June Producer Price Index has one recurring theme, and it is not a good theme.
That theme is “decline”.
The Producer Price Index for final demand increased 0.1 percent in June, seasonally adjusted, the U.S. Bureau of Labor Statistics reported today. Final demand prices declined 0.4 percent in May and edged up 0.1 percent in April. (See table A.) On an unadjusted basis, the index for final demand advanced 0.1 percent for the 12 months ended in June.
In June, the increase in final demand prices can be traced to a 0.2-percent rise in the index for final demand services. Prices for final demand goods were unchanged.
The index for final demand less foods, energy, and trade services moved up 0.1 percent in June after no change in May. For the 12 months ended in June, prices for final demand less foods, energy, and trade services advanced 2.6 percent.
Producer price inflation is not only on the decline, but has been for quite some time. More importantly, when you delve into the details, several producer price categories are in actual deflation, and have been.
In pricing, a decline is synonymous with deflation—and the PPI is signaling a fair bit of deflation. Is this the shape of economic things to come?
The Producer Price Index is exactly what the name suggests1: an index based on pricing quoted or received by various economic producers.
The Producer Price Index (PPI) is a family of indexes that measures the average change over time in selling prices received by domestic producers of goods and services. PPIs measure price change from the perspective of the seller. This contrasts with other measures, such as the Consumer Price Index (CPI), that measure price change from the purchaser's perspective. Sellers' and purchasers' prices may differ due to government subsidies, sales and excise taxes, and distribution costs.
The PPI looks at market pricing from the perspective of the seller, or producer. Similarly, the Consumer Price Index—again, as the name suggests—looks at market pricing from the perspective of the buyer, or consumer.
The PPI is particularly relevant in light of yesterday’s Consumer Price Index data, because the PPI is widely viewed as a leading indicator for the CPI2. Trends in the PPI today will to some degree be reflected in the CPI over the next month or two.
Following this thesis, a deflationary or inflationary trend in the PPI is a strong indication of an inflationary or deflationary trend in the CPI in the near future.
We must keep this in mind when we look at the various elements of the PPI, and in particular the plateaus exhibited by those elements over the past several months to a year.
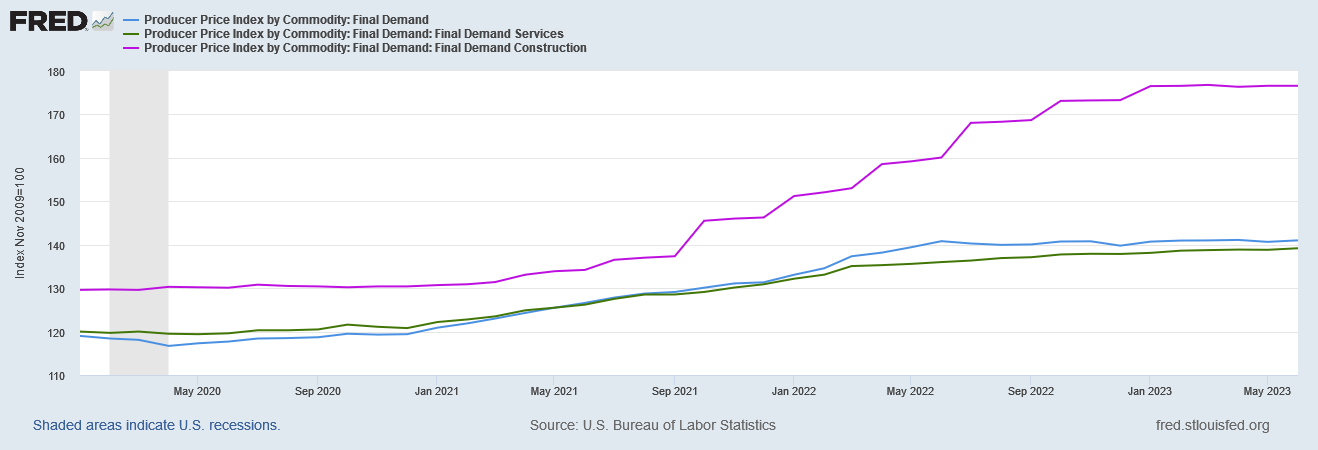
The PPI Final Demand for Services largely plateaued in March of 2022. Overall Final Demand (demand for goods) reached a plateau in May of 2022, and Final Demand for Construction plateaued in 2023.
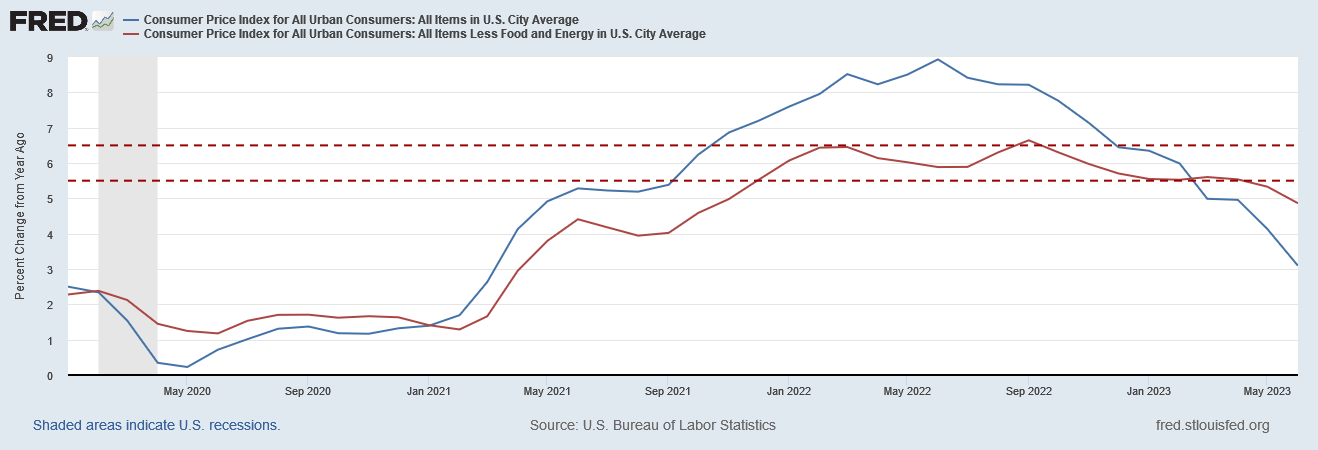
It is worth noting that in this same general time frame we see core consumer price inflation (CPI less food and energy) begin fluctuating in the band 6%±0.5%.
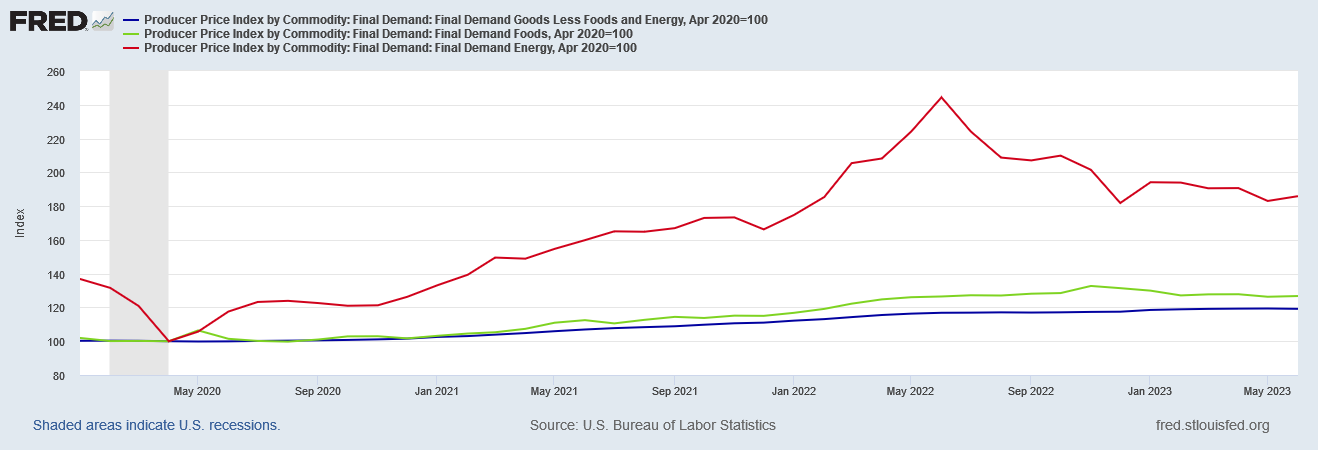
Resetting the Producer Price Indices to the end of the 2020 recession helps to highlight the plateau phenomenon.
Plateaus in price indices are a worrisome sign, as they indicate the rate of inflation is at or near zero. While zero inflation is often stated as the desired economic situation, the dynamic nature of economies in effect makes zero inflation a warning signal that deflation—and thus economic contraction—is not far off.
When the PPI curve (or the CPI curve) flattens out in this fashion, it means that year on year inflation at a minimum is going to trend down.
Most notable here is that overall Final Demand for goods printed at 0.1% year on year. From June of 2022 through to June of this year, aggregate producer prices on all goods rose only 0.1%
That’s not a lot.
If we drill into the Final Demand index we can see that the components either plateaued or declined outright during the spring of 2022.
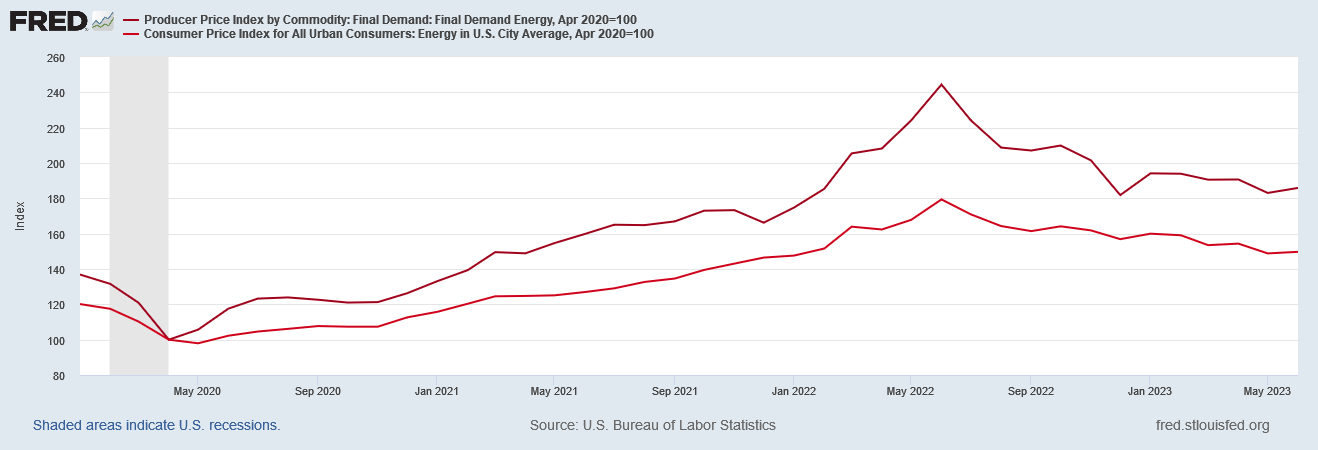
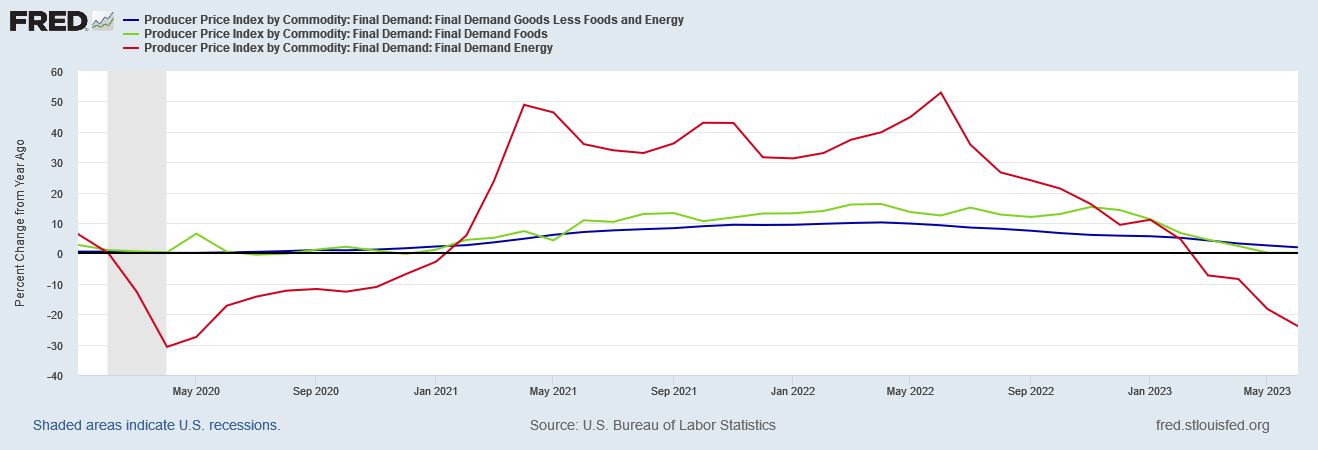
Energy in particular has been in producer price deflation since May of 2022-. Also of note, the PPI Energy index reflects the CPI energy index with nearly identical trends and similar magnitudes.
The general trend of the PPI for energy also aligns relatively well with the spot prices for Brent and West Texas Intermediate crude oil.
When we look at the percent change in the PPI Final Demand for Energy year on year, we see that energy prices are either in deflation or very close to it.
Whether the recent extension of OPEC production cuts will alter this trend will be a point to watch over the next few weeks and in the July PPI and CPI releases.
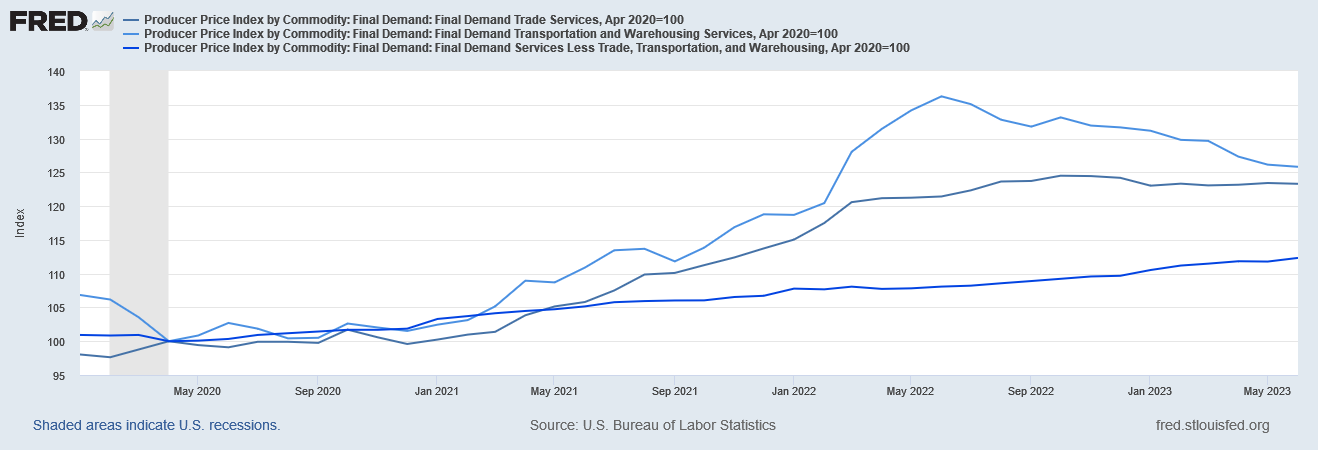
When we look at PPI Final Demand for Services, including trade and transportation and warehousing, we see a slightly different situation. Trade plateaued in March of 2022, Transportation and Warehousing began deflating in June of 2022, yet the Services Less Trade and Transportation shows consistent increase throughout 2022 and 2023 to date.
Viewing these indices’ percent change year on year shows Transportation to be in outright deflation and Trade very close to it, with Services Less Trade and Transportation hovering in the 3%-5% range since April of 2021.
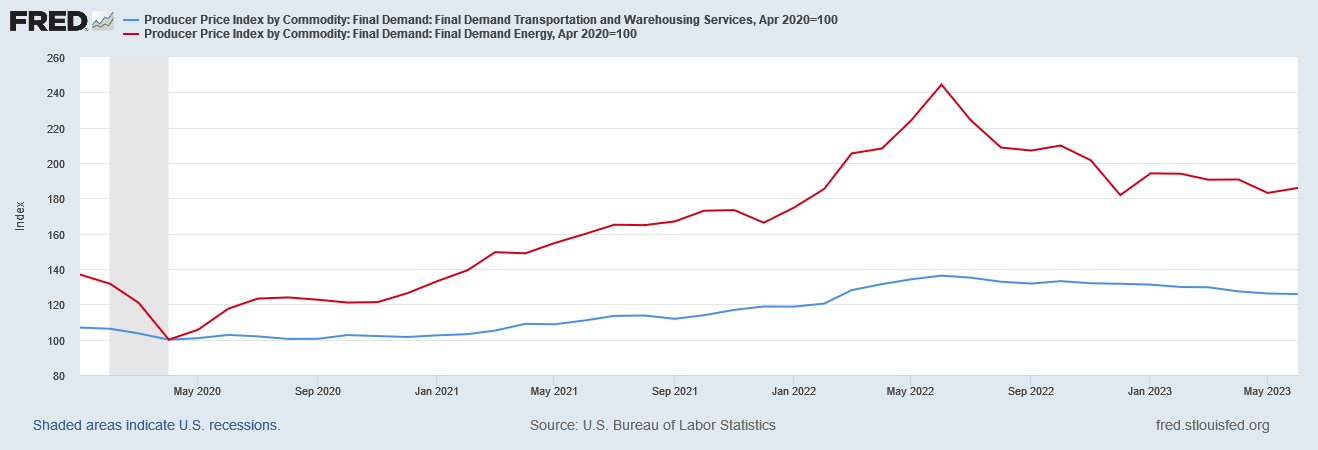
We can probably ascribe the deflationary trend in Transportation to the same forces driving the deflationary trend in Energy. When we compare them directly, we see the magnitude of the shifts differs but the trends line up extremely well.
If OPEC fails to establish a firm floor price for oil with their production cuts, we can expect both the Energy and Transportation indices to continue their decline.
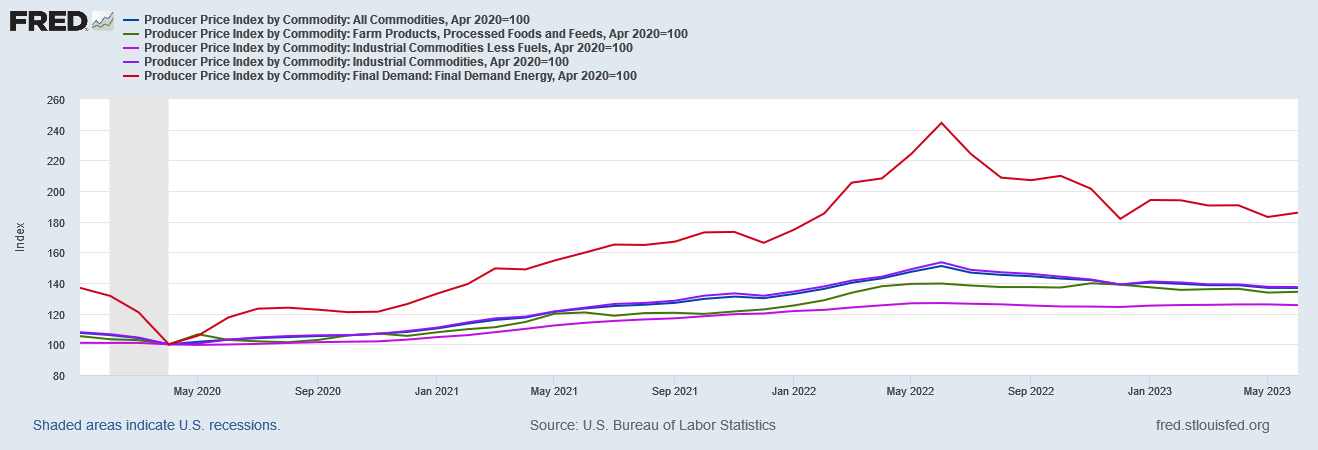
When we begin looking at PPI for various commodity categories, we once again see either a plateau or a decline.
Once again, the trajectory of the curve follows the PPI Energy curve.
The persistence of the trend correlating with Energy proves the Energy PPI metric has especial utility in gauging the future of both producer and consumer price inflation overall—which reflects the importance energy products have in the overall economy.
As the Energy PPI curve is showing deflation, we can expect similar trends in multiple categories of goods and services tracked by the PPI. Unfortunately, the Energy curve is showing a fairly strong deflation signal—which does not bode well for the US economy.
That the same signal carries through to multiple commodity categories, even in the percent change year on year, is equally disturbing.
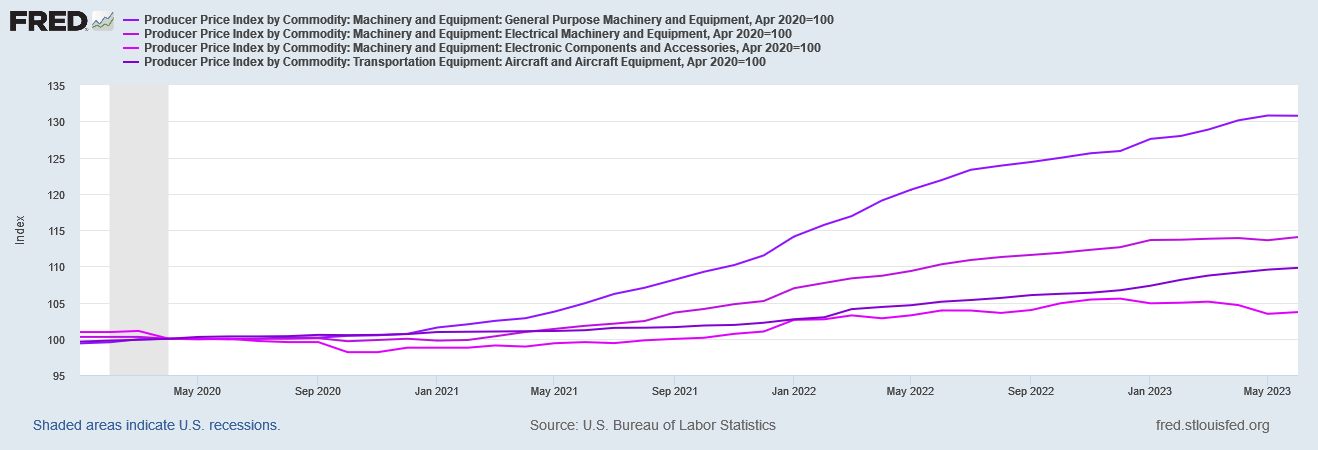
Machinery is one of the few areas where we do not see much of a plateau effect.
We also do not see the same influence from energy producer prices.
Yet even here we see a steady decline in producer price inflation year on year.
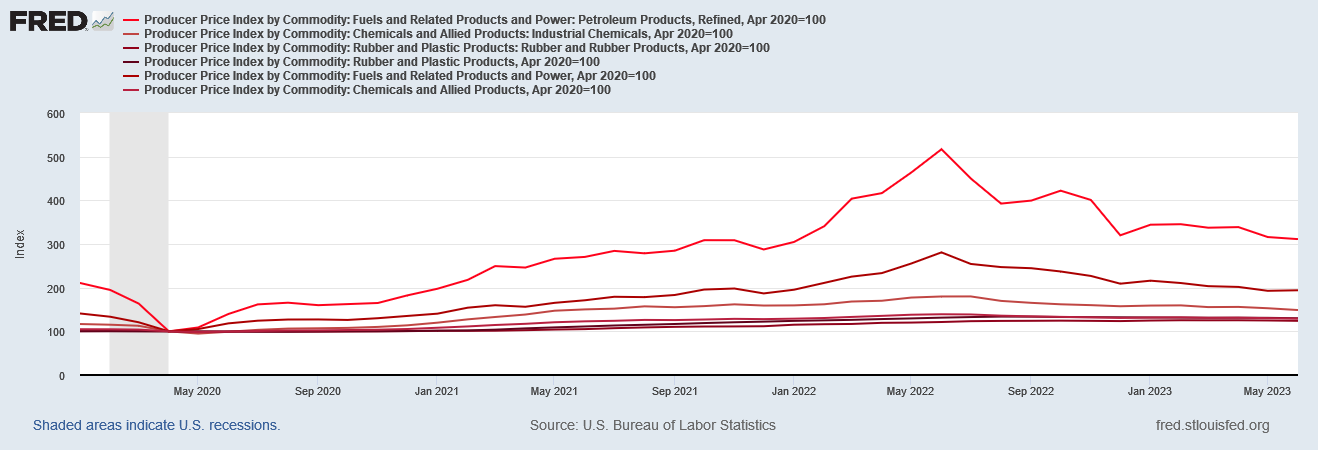
Unsurprisingly, chemicals, rubber, and plastic again follow the energy curve—crude oil is relevant throughout the manufacture of these goods, so the correlation should be self-evident, and it is.
Equally unsurprisingly, we see a very strong deflationary signal in the percent change year on year graph.
In nearly every component of the PPI, we can see strong and sustained either disinflationary or deflationary trends. Moreover, the closer the connection between a PPI component and crude oil (energy), the more we see deflationary rather than disinflationary signals.
What conclusions may we reasonably infer from these trends?
First and foremost we see confirmation of my thesis that oil demand at least in the United States, but very likely globally, is not nearly as strong as market analysts have maintained.
While it is always an open question whether oil demand will pick up going forward, current PPI trends are not indicating a resurgence in oil demand in the immediate future. If this trend holds, then even OPEC’s latest production cut extension is likely to have only a brief impact on spot oil prices, and we will be seeing oil prices trend down once more in the very near future.
Conversely, if we do see oil prices trend down again (they are trending up as of this writing), then that again brings us back to a soft oil demand narrative rather than a strong oil demand narrative—which would also affirm that these are deflationary trends broadly across the economy.
As the PPI is a leading indicator for the CPI, we may also infer that consumer price inflation is likely to continue trending either down or neutral over the near term—again this is likely to be due to softening demand overall.
In other words, there is a fairly strong disinflationary/deflationary signal here.
Yet we must be careful not to extrapolate too much from the PPI signal when gauging the future direction of consumer price inflation. As I noted yesterday, even amidst falling inflation there are categories of consumer goods and services where price inflation is still elevated, and categories where prices are continuing to rise—where there is not much indication of impending deflation.
Once again, we are reminded that the biggest impact of inflation by far is its tendency to distort prices and pricing signals. “Demand” is never a monolithic entity, but is always the amalgamation of the particular demands for various goods and services. Thus while there are strong disinflationary and deflationary signals in metrics such as the PPI, the distortions of the inflation phenomenon itself means that not all prices goods and services will move the same way, in the same direction, or at the same time.
This is also confirmed by last month’s PCE data, which showed both energy-driven disinflation and services inflation, with neither one being terribly impressed by the Fed’s federal funds rate hikes.
The resolution of all these disparate signals indicates that the United States economy is continuing down the torturous path of stagflation, where deflationary and inflationary impulses paradoxically operate simultaneously.
Regardless of which impulse one experiences, it will not be pleasant. We’re in for a bumpy economic ride for the foreseeable future.
Bureau of Labor Statistics. Producer Price Index (PPI). 22 Feb. 2022, https://www.bls.gov/ppi/overview.htm.
Shah, S. Consumer Price Index vs. Producer Price Index: What’s the Difference? 29 Sept. 2021, https://www.investopedia.com/ask/answers/011915/what-difference-between-consumer-price-index-cpi-and-producer-price-index-ppi.asp.












"We’re in for a bumpy economic ride for the foreseeable future."
With the government seemingly not caring about deficits, I think you termed it as mild as you could, it may get a lot 'bumpier.'
Equities get all foamy and excited as these numbers tail off, because the Fed can "pivot" now, but the truth is much more frightening. Credit event dead ahead.