Job Growth Slowed In March. "Good" Bad News Or "Bad" Good News?
Labor Data Is Softening--But Is It Softening Enough?
Jay Powell’s conundrum this Easter weekend: is the Employment Situation Summary for March a case of “good” bad news, “bad” good news, or something in between?
According to the Bureau of Labor Statistics, the US economy added some 236,000 jobs (seasonally adjusted) during March, while the seasonally adjusted unemployment rate dropped from 3.6% to 3.5%.
Total nonfarm payroll employment rose by 236,000 in March, and the unemployment rate changed little at 3.5 percent, the U.S. Bureau of Labor Statistics reported today. Employment continued to trend up in leisure and hospitality, government, professional and business services, and health care.
Normally, job growth is considered a good thing. However, in the mixed-up, muddled-up, shook-up world that is the Federal Reserve’s hyperfocus on narrow data sets instead of the entire data universe, more jobs signifies a growing economy, not the contracting economy pushed into recession it wants so that it can destroy enough demand to bring consumer price inflation back down to ~2%.
(New readers might want to browse through previous articles under the “Recession Matters” archive for further explication of the Fed’s stated objectives in this regard).
As notionally good as 236,000 jobs might sound, in fact it comes in slightly below many forecasters’ expectations.
The economy is expected to add 238,000 jobs in March, according to economists polled by The Wall Street Journal.
The U.S. created an estimated 311,000 jobs in February and 504,000 in January. Both easily surpassed expectations and induced more worries at the Fed.
A 200,000-plus increase in March would still be quite strong. The U.S. added an average of 173,000 new jobs a month in the year before the onset of the pandemic in 2020.
Thus, while the (seasonally adjusted) number of jobs added in March is still characterized as “quite strong”, it is not as strong as the number reported for either January or February, nor is it as strong as was anticipated (although it came extremely close).
We should also note that the 236,000 figure is significantly higher than the independently calculated job creation figure provided by ADP’s ADP Research Institute earlier this week.
Private sector employment increased by 145,000 jobs in March and
annual pay was up 6.9 percent year-over-year, according to the March ADP® National Employment ReportTM produced by the ADP Research Institute® in collaboration with the Stanford Digital Economy Lab (“Stanford Lab”).
With the BLS number printing 67% higher than ADP’s number, we are well advised to take the data with a grain of salt and a healthy dose of skepticism. At a minimum, both numbers cannot be simultaneously correct.
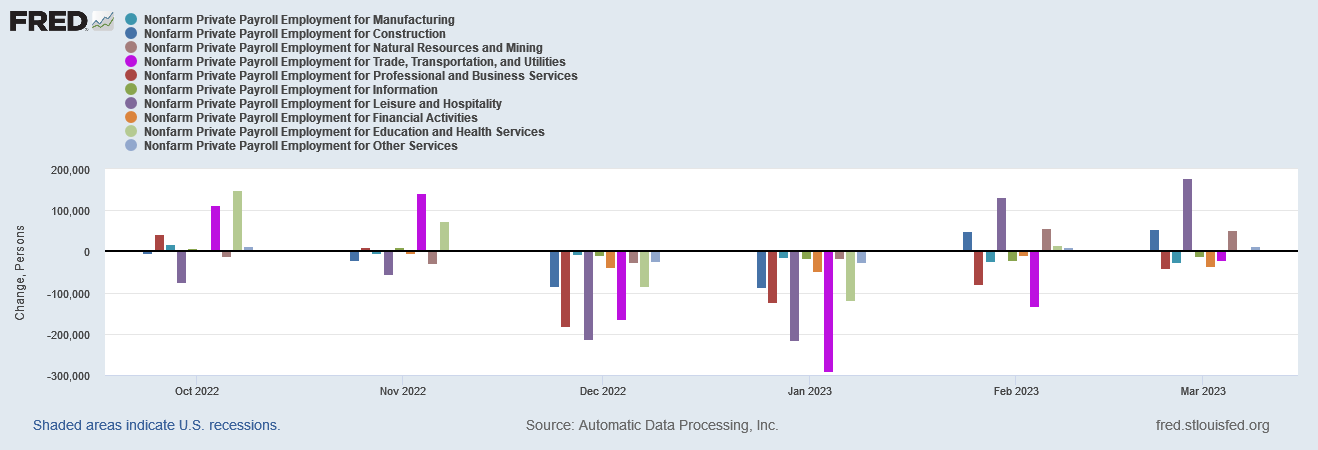
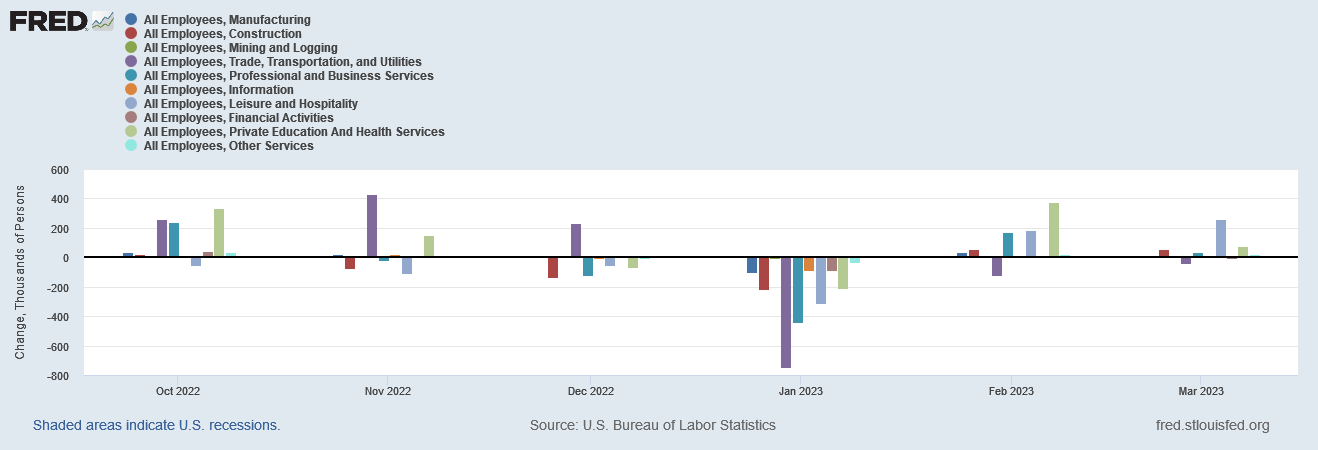
However, while the totals differ, both jobs reports do show broadly similar trends over the past several months. Looking across the various jobs sectors, both reports show by the sector changes in jobs each month a softening of labor demand during the winter and a recent strengthening of that demand since the beginning of 2023.
The ADP report showed the worse softening of labor demand in December, 2022 and January 2023, and a gradual overall strengthening during the past two months.
While the BLS data shows the largest contraction in the January data, the strengthening over the past couple of months is still broadly similar.
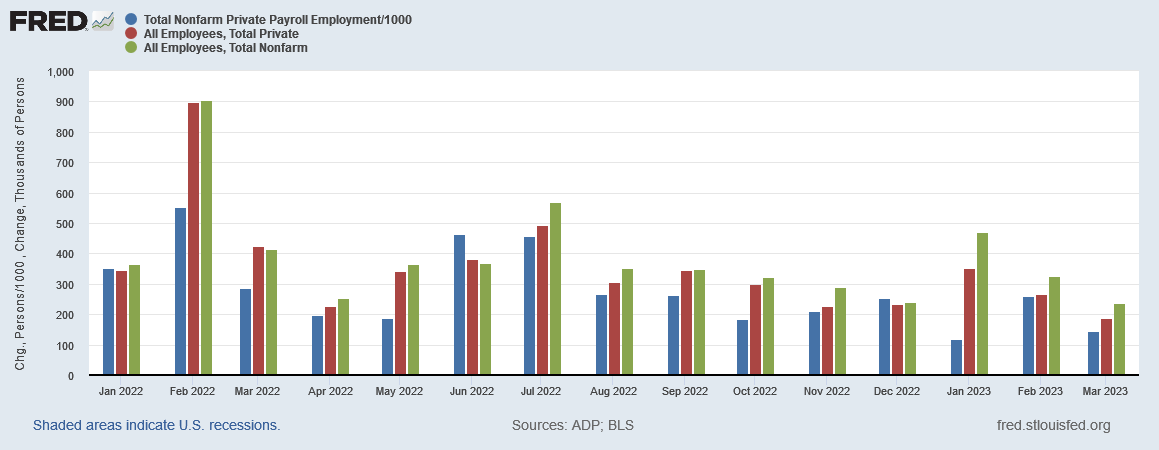
We should also note that the ADP data covers “nonfarm private” jobs, while the headline BLS number covers “nonfarm” jobs. If one focuses on the private-sector jobs created per the BLS, at 169,000 the BLS report and the ADP report are somewhat more in alignment.
As the chart shows, however, the ADP report frequently prints significantly below even the BLS private-sector number, and so skepticism continues to be warranted.
The skepticism is further warranted when we include the seasonally adjusted employment level data from the BLS Household Survey portion of the jobs report.
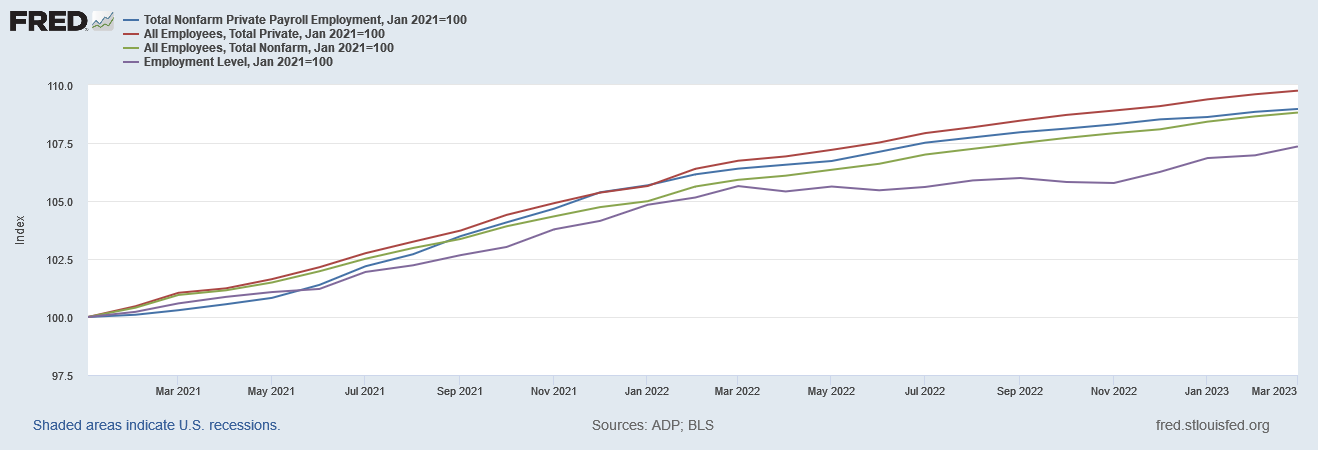
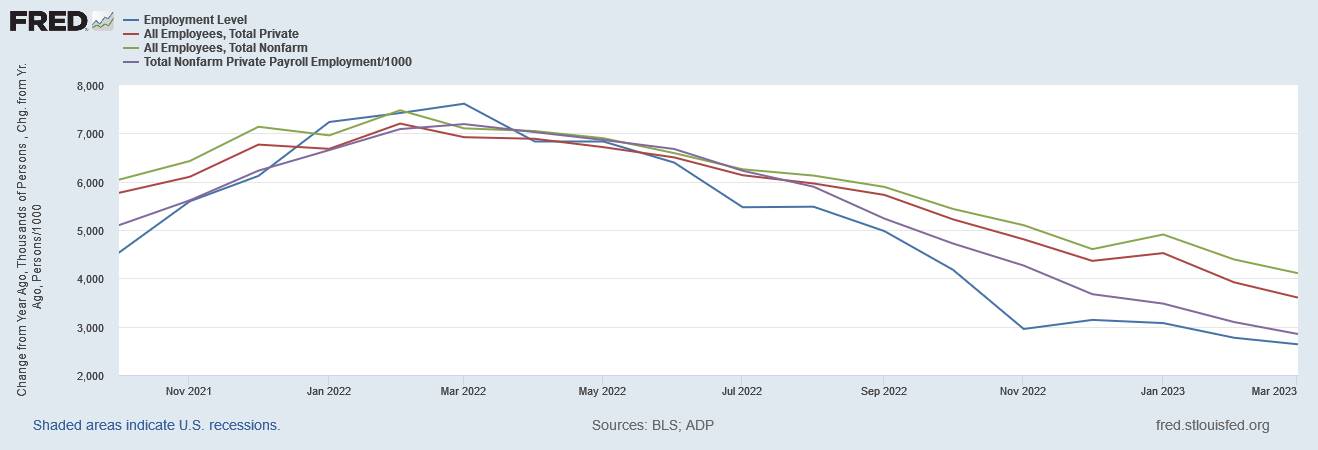
If we index all four jobs numbers to January of 2021, the Household Survey’s Employment Level figure shows the lowest relative amount of growth as of March, 2023—7.4%, nearly a full percentage point and a half below both the BLS Total Nonfarm metric and the ADP Total Nonfarm Private Payroll metric.
Neither the ADP report nor the BLS Establishment Survey data from the Employment Situation Summary ever reflected the extreme slowdown jobs growth that was reflected in the Household Survey data from March through November of 2022. That deviation is the reason the Household Survey data continues to print lower than the other metrics when indexed.
Where all four metrics agree, however, is that the pace of hiring has slowed dramatically, as we can see if we look at the changes year on year in the unadjusted data for all four metrics, in which we again see the slowdown in jobs growth in the Household Survey from March through November and significantly less of a slowdown in the other three metrics.
Intriguingly, the ADP report shows its own departure from the trend line of the two Establishment Survey metrics beginning in August of 2022.
Thus while the Establishment Survey metrics show a more gradual slowdown in job growth than either the Household Survey or the ADP report, all four metrics show the same broad downward trend. From February/March of 2022 onward, jobs markets in the United States have demonstrably “cooled”.
Bear in mind, this is the sort of “cooling” in the jobs market the Fed has said it wanted to see. Is it enough of a cooling trend to satisfy the Fed and allow them to cease making future non-productive federal funds rate hikes?
(Let there be no doubt on that last point—the federal funds rate hikes are demonstrably not having anything near the degree of influence nor the direction of influence the Federal Reserve both assumes and desires).
Certainly it was the view of many Wall Street analysts and prognosticators ahead of the actual jobs number’s release that the jobs number will be “too high” for the Fed to feel good about it.
Ian Shepherdson, chief economist at Pantheon Macroeconomics, expects nonfarm payrolls grew by 250,000 last month and wrote in a note to clients on Thursday this number would be "too high for the Fed."
"FOMC members continue to worry that such rapid job growth will push the unemployment rate to new lows and/or prevent wage inflation from slowing to a pace consistent with the inflation target," Shepherdson added.
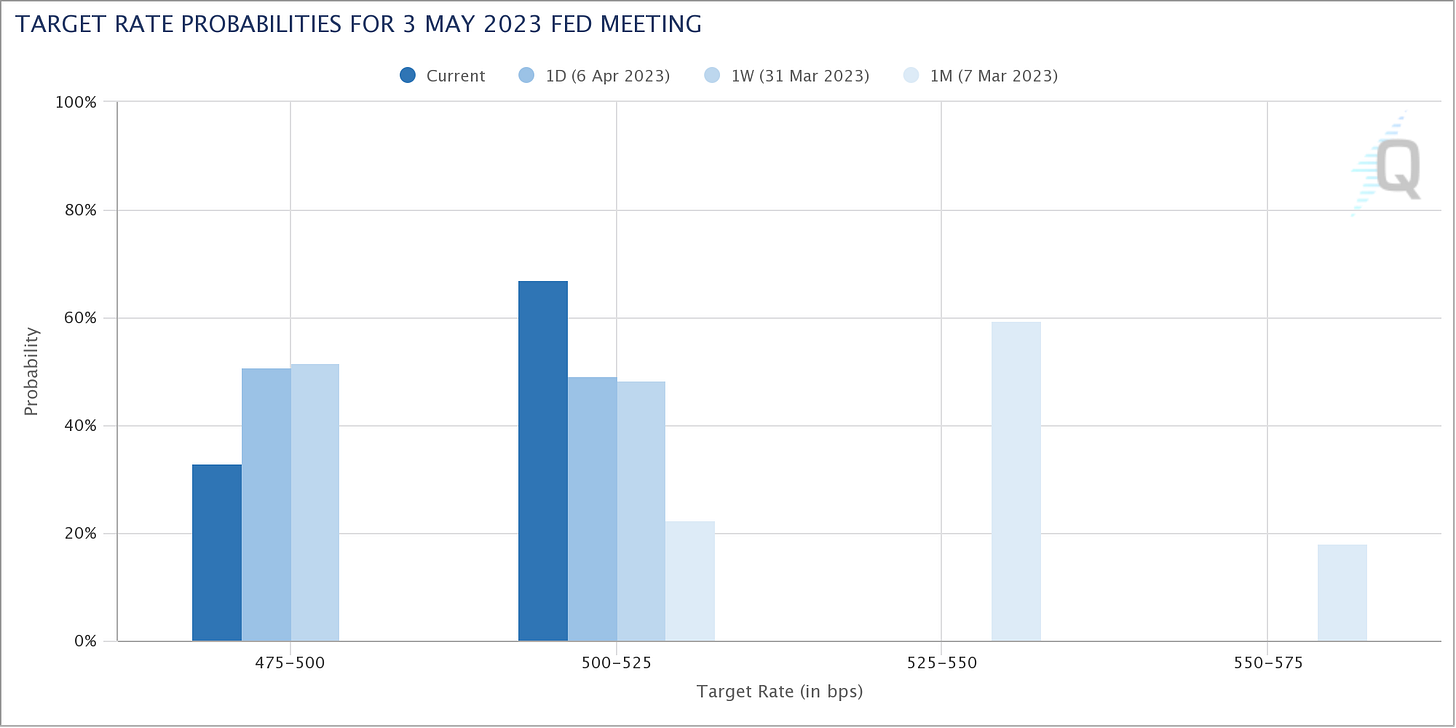
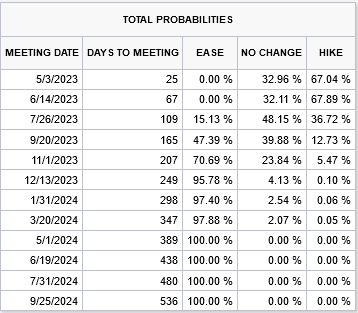
Wall Street overall has reacted to the Employment Situation Summary by beginning to price in another 25bps rate hike at the next FOMC meeting on May 3rd.
However, Wall Street’s expectation is that the expected May rate hike will be followed by one more increase in June, followed by a pause in July, after which rate cuts are almost universally anticipated.
Similarly, Wells Fargo analysts view the trend as the labor markets “cooling” from “hot” to “warm”.
“The employment report can be added to the growing list of indicators that suggest the labor market is softening directionally. While the level of many labor market gauges remain impressive, the weaker direction suggests the FOMC has the end of the tightening cycle within sight.”
Wall Street’s consensus view for now appears to be that the “cooling” in labor markets is not quite enough for the Fed to refrain from yet more rate hikes—at least one more will happen in May, and possibly a second one in June.
Yet we have more evidence than just declining job growth numbers to indicate that labor markets are softening in the US.
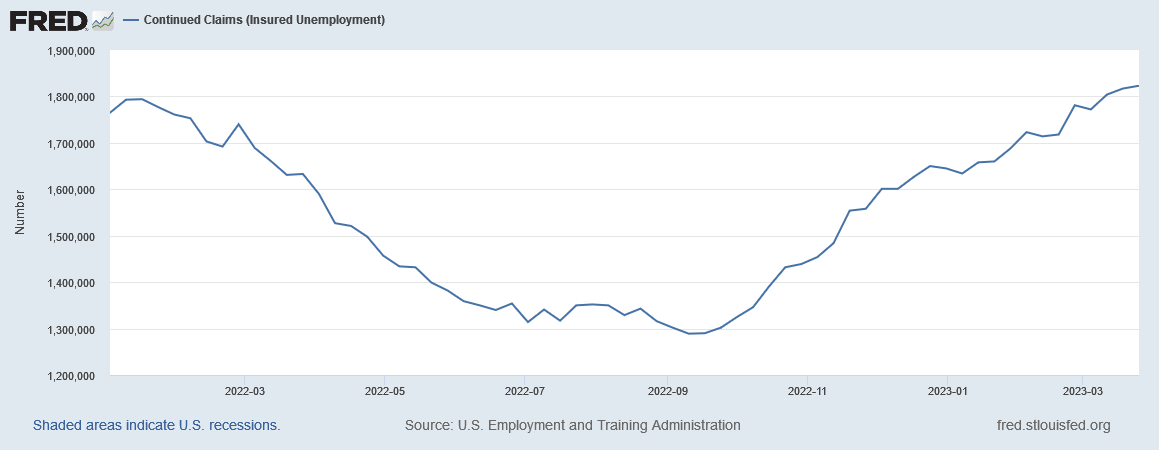
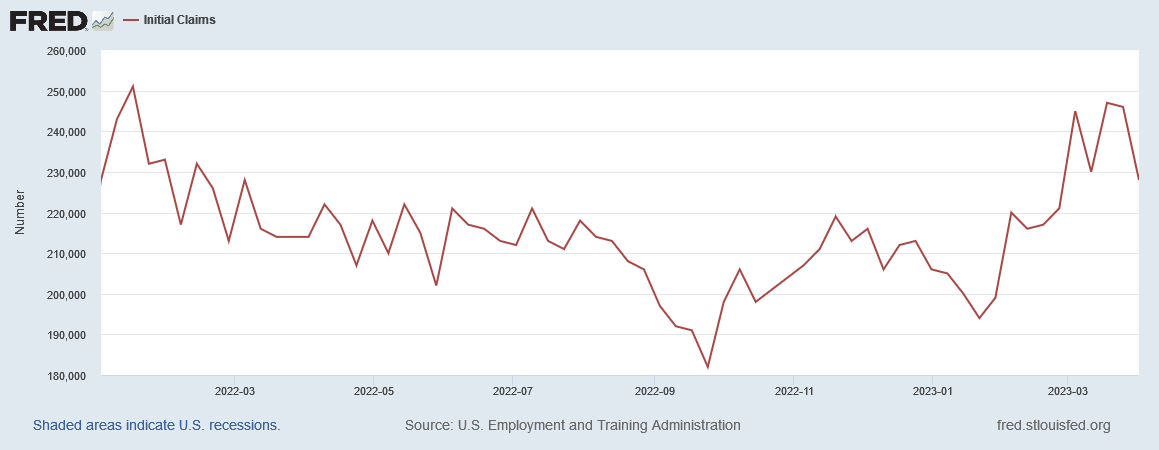
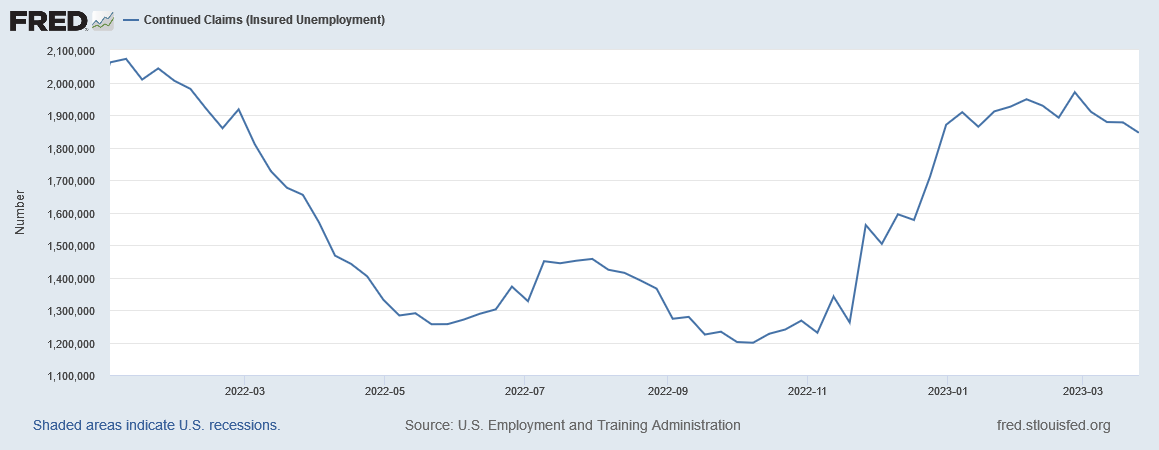
On a seasonally adjusted basis, continuing unemployment claims have been rising steadily since last September.
Seasonally adjusted initial unemployment claims have been broadly trending up since about the same time.
While there has been no cataclysmic wave of layoffs, more people are turning up without jobs and are remaining without jobs for longer periods of time.
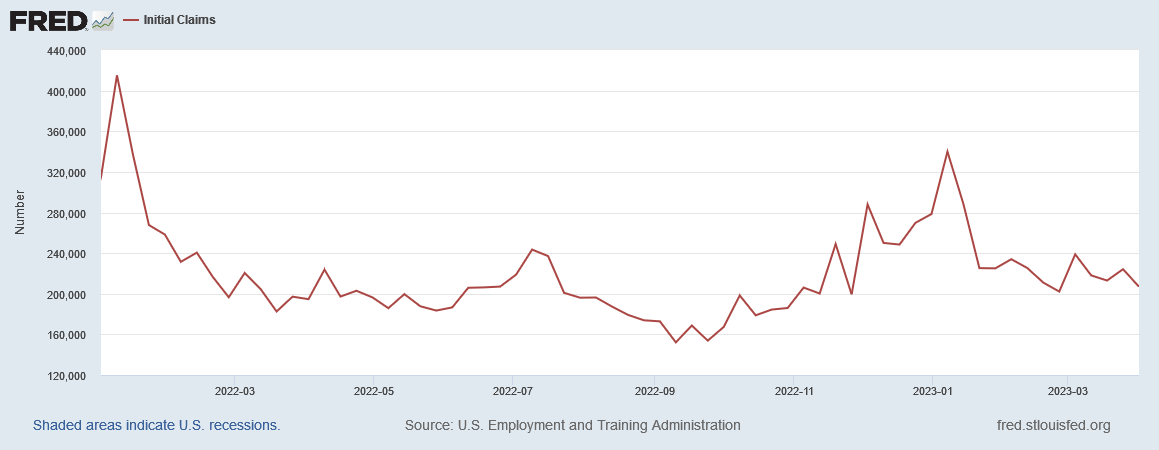
Even on an unadjusted basis, continued claims have been trending up since last fall, with a decline showing up only within the past month.
Unadjusted initial claims also trended up last fall, although that trend reversed beginning with the new year.
On both a seasonally adjusted and an unadjusted basis, unemployment claims are significantly higher than they were six months ago—a softening of the job market by any measure.
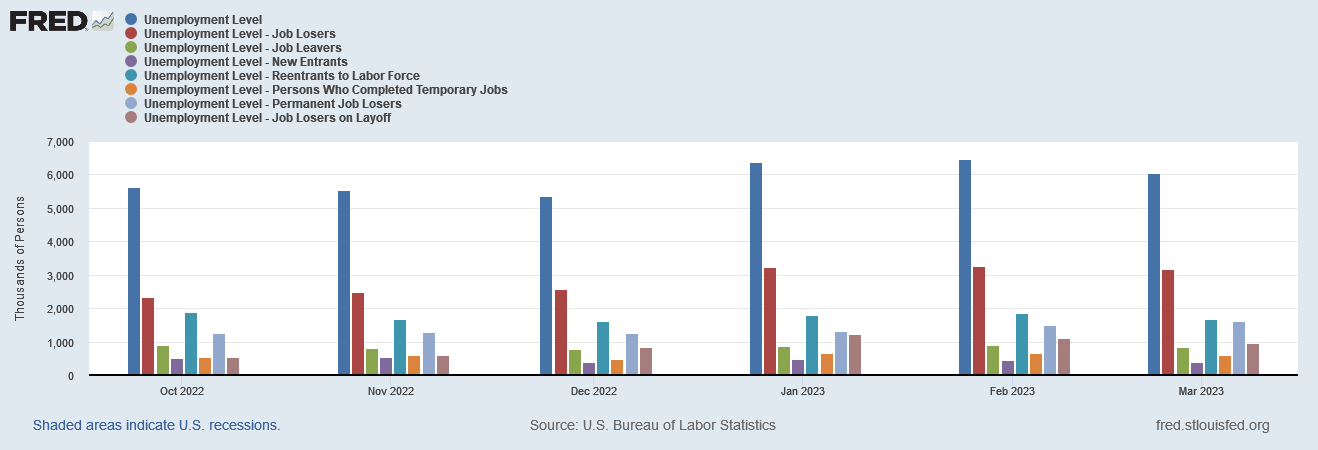
This is reflected in the unadjusted unemployment data as well, which showed total unemployment rising through January before receding somewhat over the past couple of months.
Note that job losers have been showing increasing unemployment, while job leavers have fared much better in that regard. Similarly, those reentering the labor force appear to face a consistent obstacle to employment before landing a job—itself another indicator that the labor market has never been as “red hot” as the prevailing narrative holds.
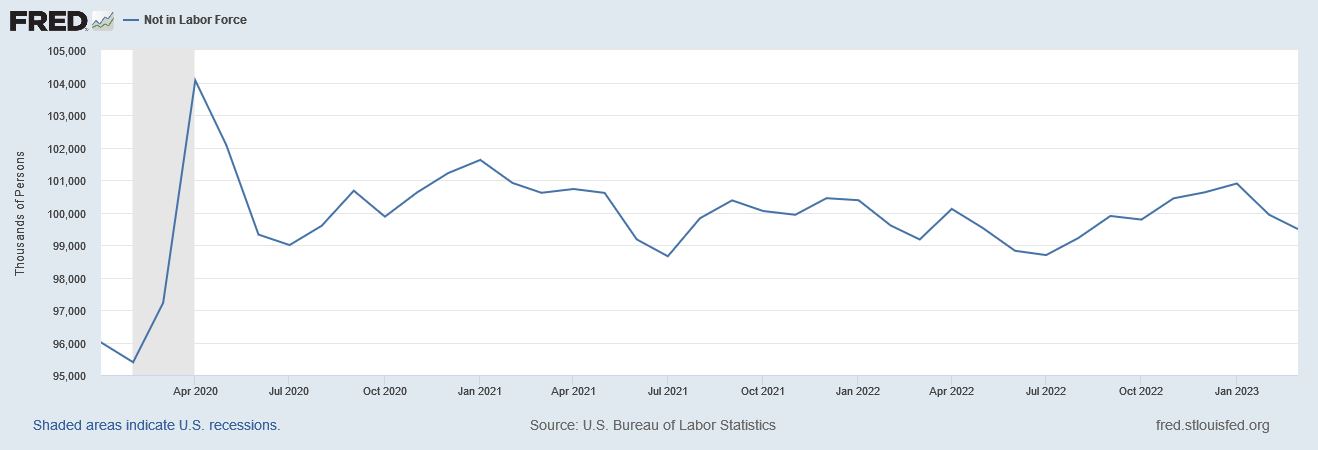
Nor can we overlook the reality that even with recent declines of the “not in labor force” demographic, the US still has over 4 million people forcibly expelled from the labor force during the government-ordered 2020 recession that have yet to return.
It is difficult to see how a labor market that fails to pull these sidelined workers back into the labor force qualifies as “red hot”. While there have been improvements in labor force participation, they remain marginal at best, and extremely problematic. With extended periods of increases among those not in the labor force, the long term trend is still mainly one of standing still, neither improving nor getting worse.
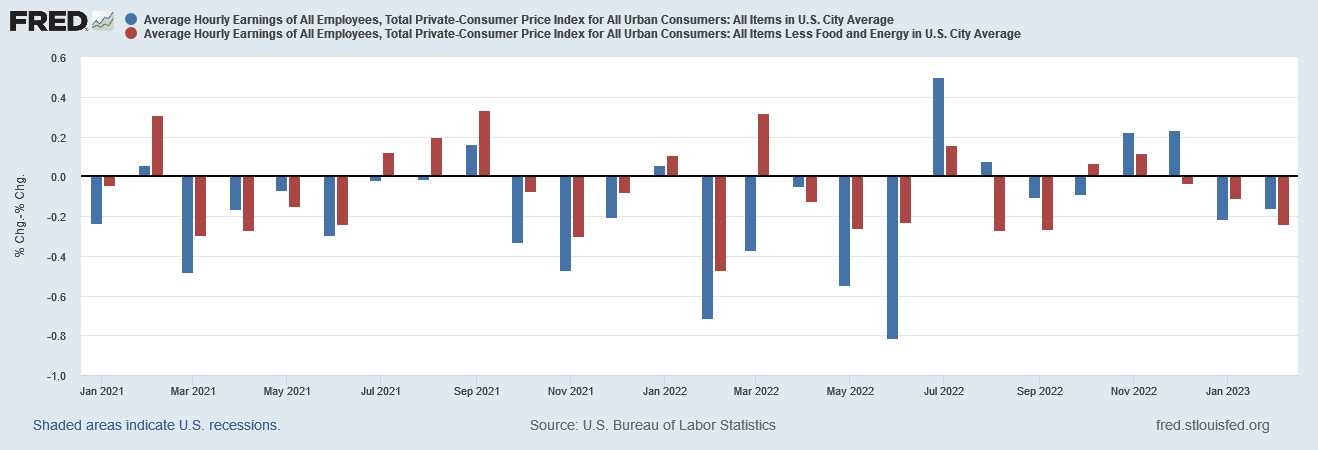
Moreover, while we will have to wait until next week’s inflation data releases to know how average earnings have fared during March, the overall trend throughout 2022 and into 2023 has been that real earnings growth—the percentage increases in nominal earnings less the rate of consumer price inflation—has been steadily negative.
A labor market that leaves workers falling further and further behind economically is anything but “red hot”.
In reality, if the Fed only needs to see solid evidence of a cooler or “cooling” labor market before it can feel comfortable about pausing further hikes in the federal funds rate, that data already exists in abundance. That data has been in abundance for many months now.
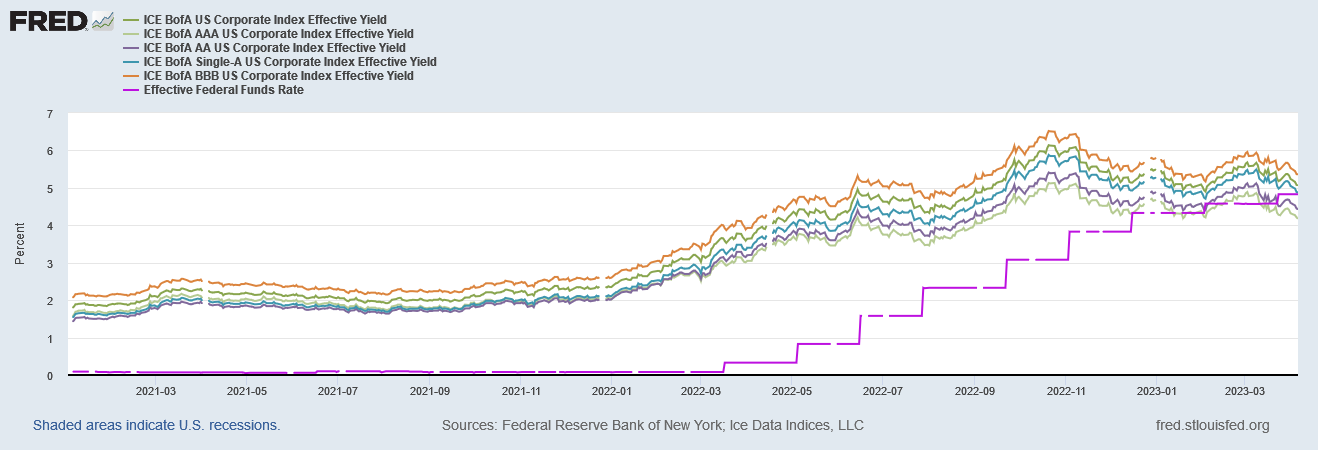
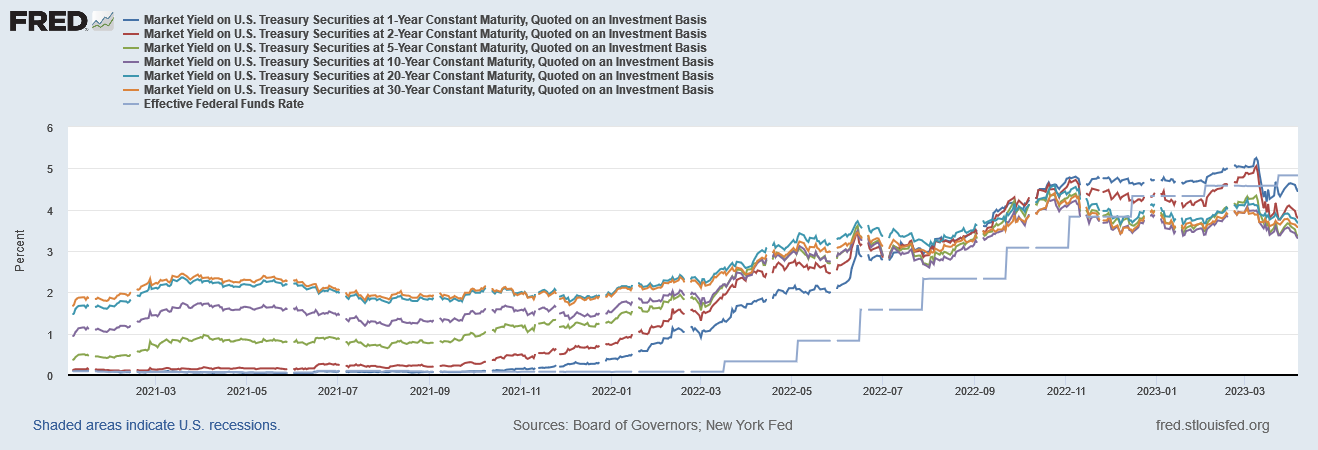
That much of the labor market data began softening during the fall is also noteworthy given that interest rates broadly became impervious to federal funds rate hikes around November of 2022. Both corporate yields and treasury yields began declining after November even as the Fed continued to raise the funds rate a total of 175 basis points.
Not only are there numerous signals that labor markets are softening and have been softening, but they coincide with numerous other signals that all flash the same warning sign: recession.
For whatever reason, the Federal Reserve has opted not to see these warning signals, or perhaps simply not to heed them. For whatever reason, the Federal Reserve has chosen a rate hike path that is pushing the US economy further into recession even as it fails to meaningfully make a dent in consumer price inflation.
The Federal Reserve has chosen the path of stagflation.
While the March jobs data ultimately provides no rationale for continued federal funds rate hikes, the Fed’s track record has been to ignore the broad data set and allow a few narrowly drawn numbers to lead it right off an interest rate cliff. There is little reason to believe the Fed will turn away from the precipice now, even though it should.



Stagflation!
Is that one or two steps before Weimarization?