


The July Consumer Price Index Summary printed exactly what Wall Street expected: cooling headline inflation, cooling core inflation, more energy price deflation.
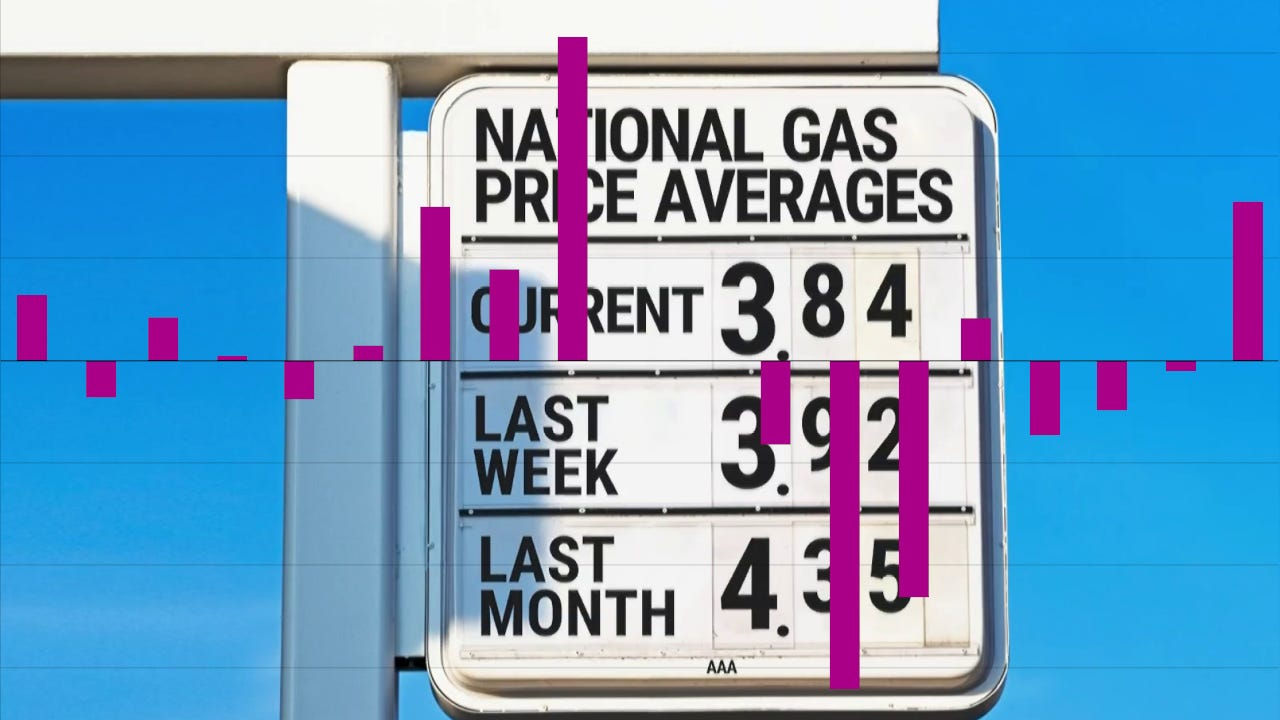
The Consumer Price Index for All Urban Consumers (CPI-U) increased 0.1 percent on a seasonally adjusted basis in July after falling 0.4 percent in June, the U.S. Bureau of Labor Statistics reported today. Over the last 12 months, the all items index increased 3.4 percent before seasonal adjustment.
The numbers were exactly where Wall Street expected them to be.
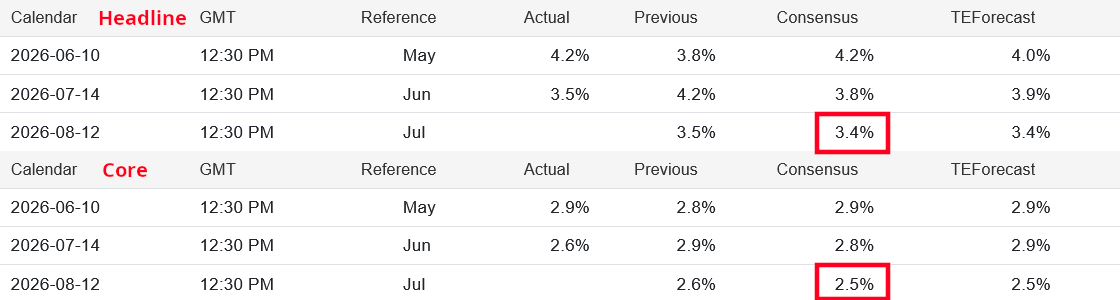
The numbers were right on target as projected by the Cleveland Fed’s inflation nowcast.
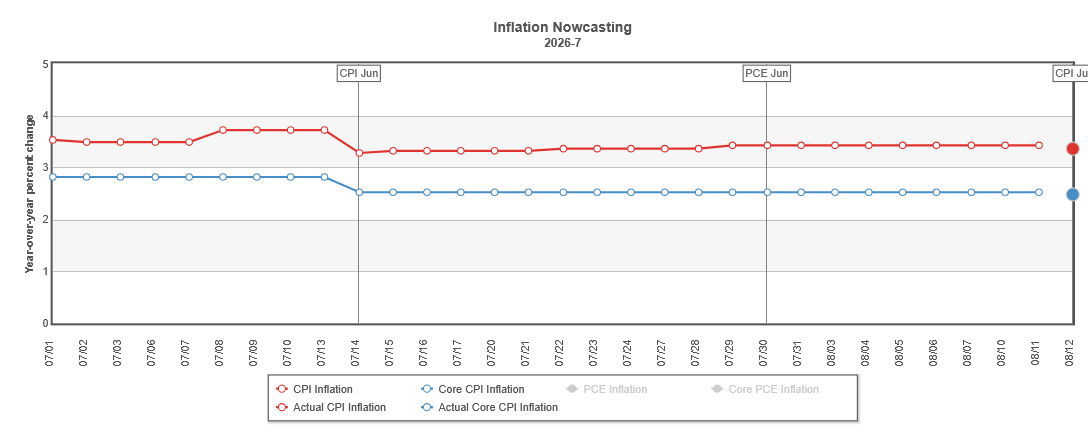
Perversely, while there was no surprise in the headline number, the cooling headline and core inflation numbers are counterintuitive.
Driving the headline disinflation figure was continued energy price deflation, a carryover from June. That is remarkable, considering, as I noted the other day, energy commodities all rose.
Brent Crude: ~24%
West Texas Intermediate: ~20%
RBOB Gasoline: 15%
Energy prices rose in July—a lot. It’s just the energy price index that fell.
If these energy prices did not percolate through to the Energy Price Index for July, they are going to percolate through eventually. They will come in August (most likely) or in September at the latest, but they will come.
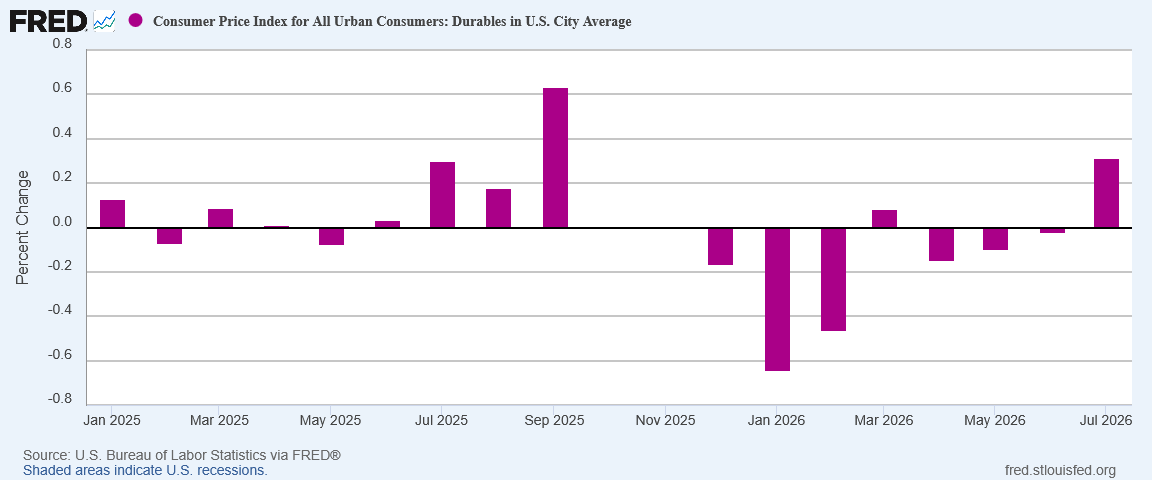
Meanwhile, the inflationary impact from prior energy price hikes on other parts of the CPI remains muddled. Durable goods surged, and so did Services, but the rest of the CPI showed either deflation or disinflation.
There has been no stagflationary crisis from the first wave of the oil supply shock. What happens with prices should the second wave—the “oilpocalypse”—actually unfold is a story yet to be told.
No Headline Deflation This Month, But Significant Disinflation
I said last month that June would be a one-off, and that we would not see deflation repeated at the headline level in July. In that regard, my assessment was accurate.
However, year on year inflation still cooled dramatically from June, by more than I anticipated.
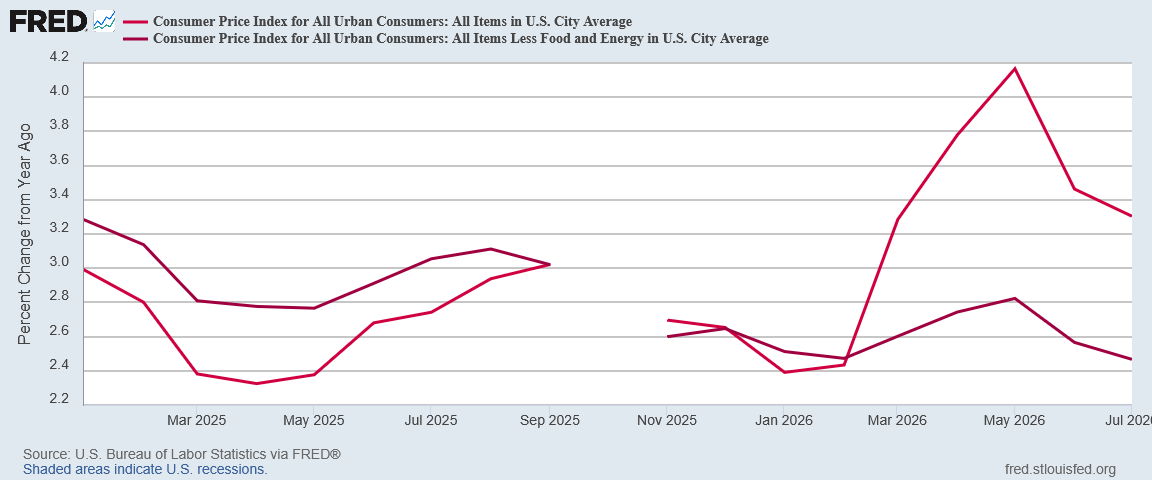
With rising energy prices, that July saw the needed energy price deflation to bring the headline and core inflation rates down significantly is extremely remarkable—which suggests there may be some missing data to help make it make sense.
Even month on month inflation was much cooler than market energy prices indicated.
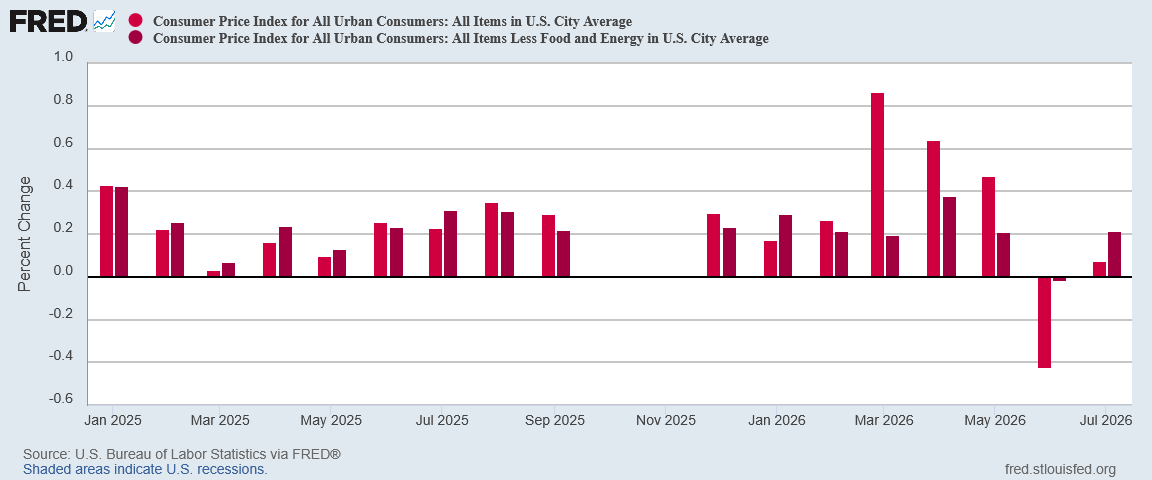
While energy price deflation remains the improbable consumer price metric for July, the larger picture is still that there are not many other inflationary pressures within the US economy.
Consumers always prefer lower prices to higher prices, but the economic reality of expansion is that increased demand necessarily creates inflationary pressures. Similarly, a lack of inflationary pressures suggests that demand is not actually increasing all that much, which would imply the economy has not grown all that much.
That lack of growth is somewhat confirmed by the cooling trend we have seen in the BEA’s Real GDP figures for the past two quarters.
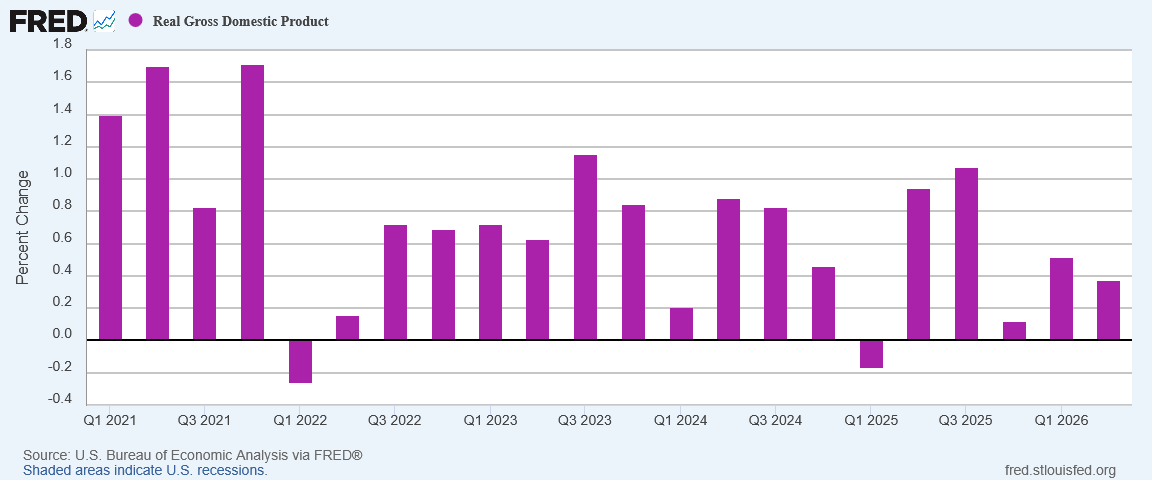
How much of July’s counterintuitive disinflation is the result of a cooling economy? Probably more than economists want to admit.
More Energy Price Deflation?
My prediction for the Energy portion of the CPI was completely refuted by the CPI data. Instead of seeing a return to energy price inflation (and potentially significant energy price inflation), for July we were presented with additional energy price deflation.
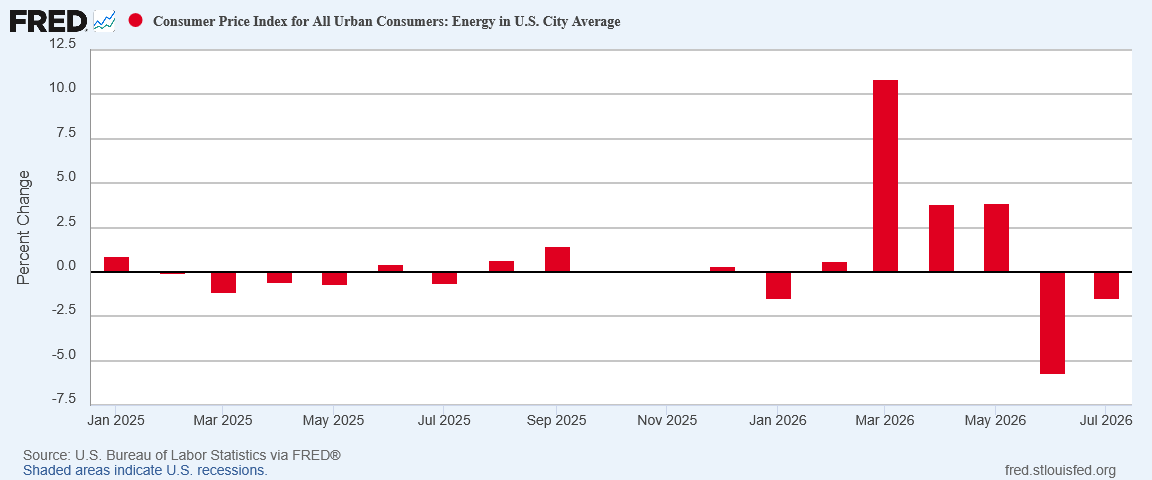
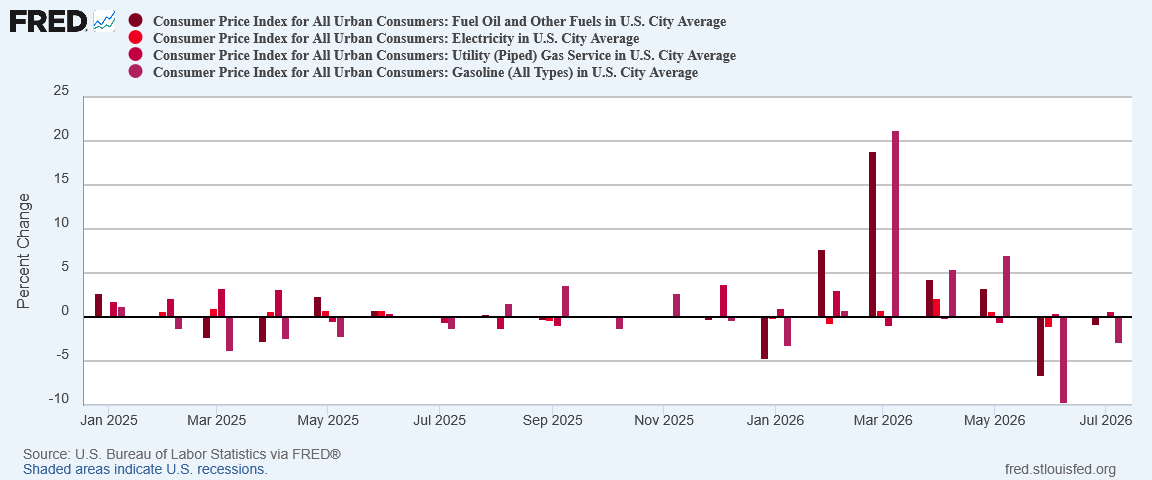
I also did not expect that deflation to be fairly broad-based, yet July saw prices drop for most components of the Energy subindex.
Yet despite what the CPI data says, the futures price for both Brent Crude and West Texas Intermediate (October contract) rose in July.
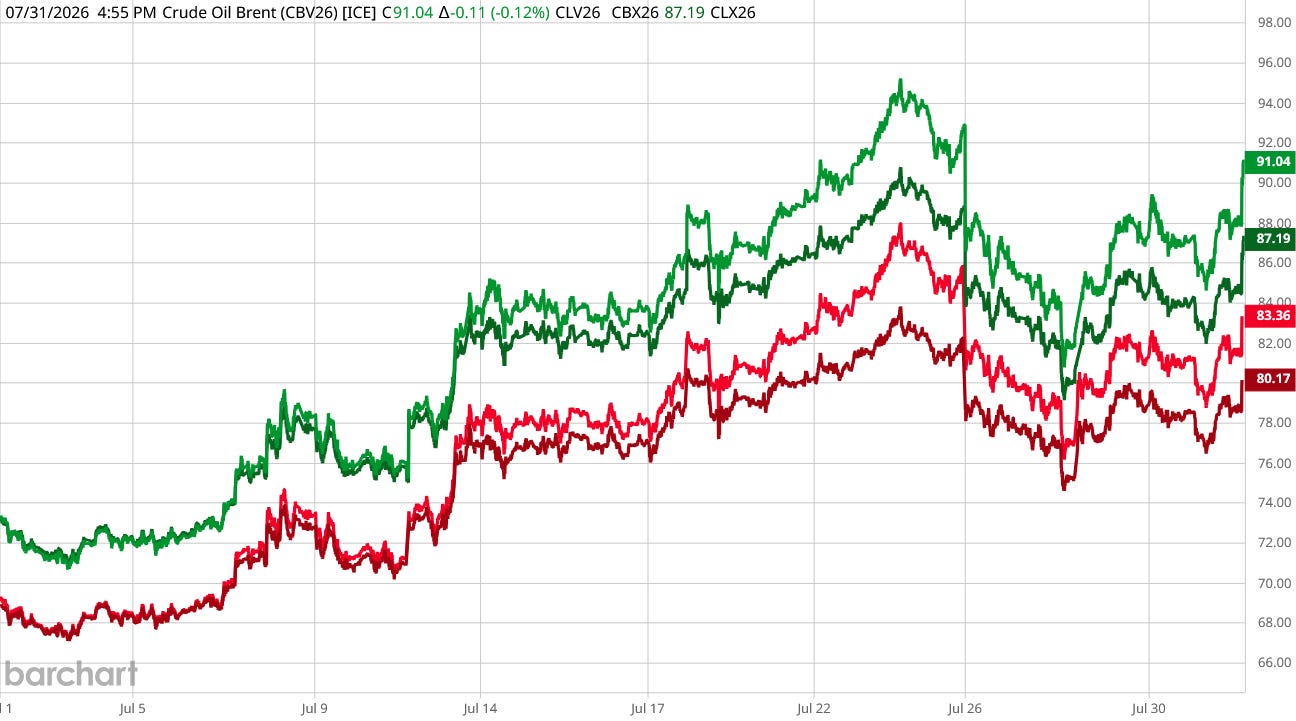
While June saw oil prices trend down throughout the month, that trend reversed almost immediately in July.
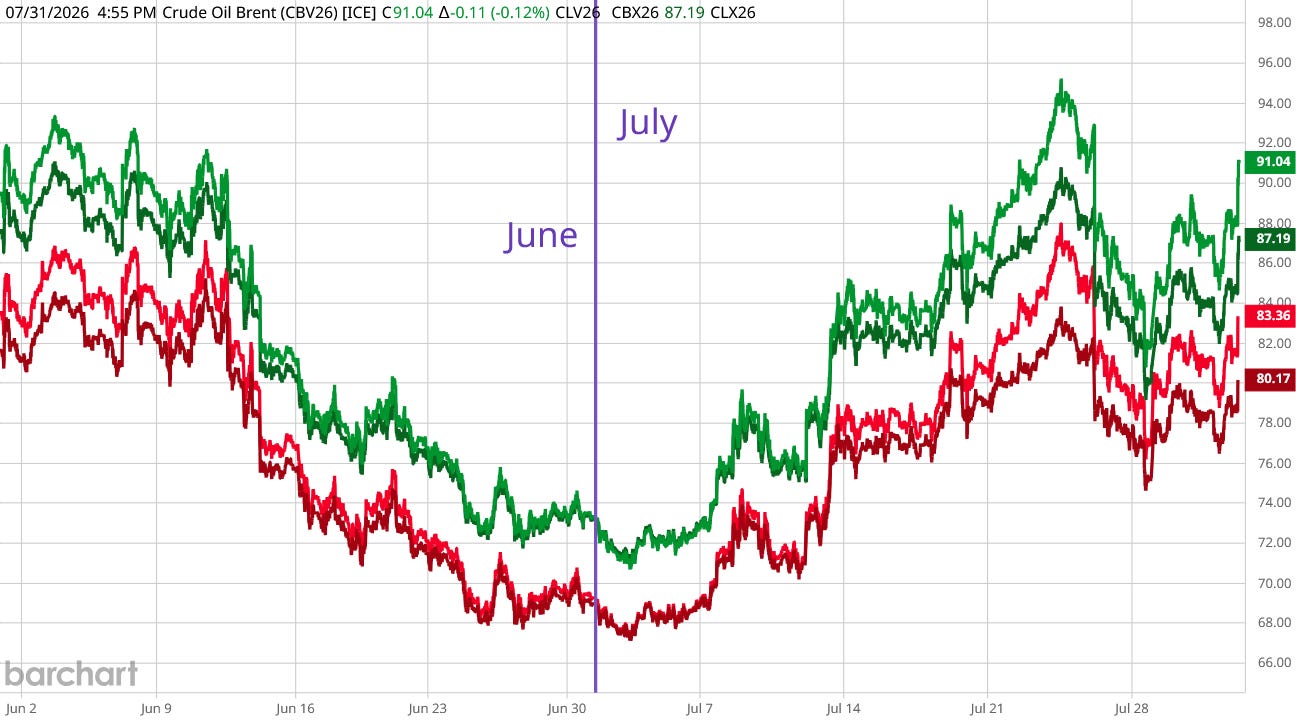
Even though oil prices rose throughout the month, the July CPI data is effectively processing only June market data.
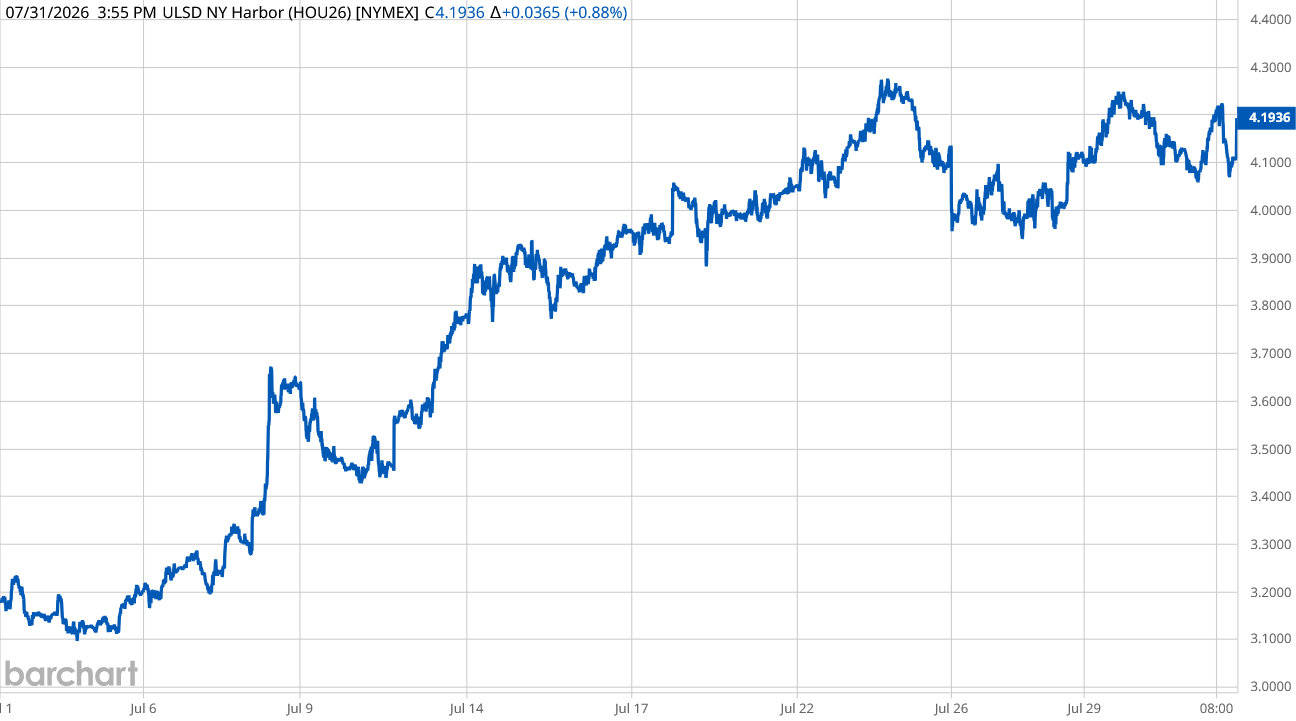
Diesel September contract prices also rose since very nearly the beginning of July.
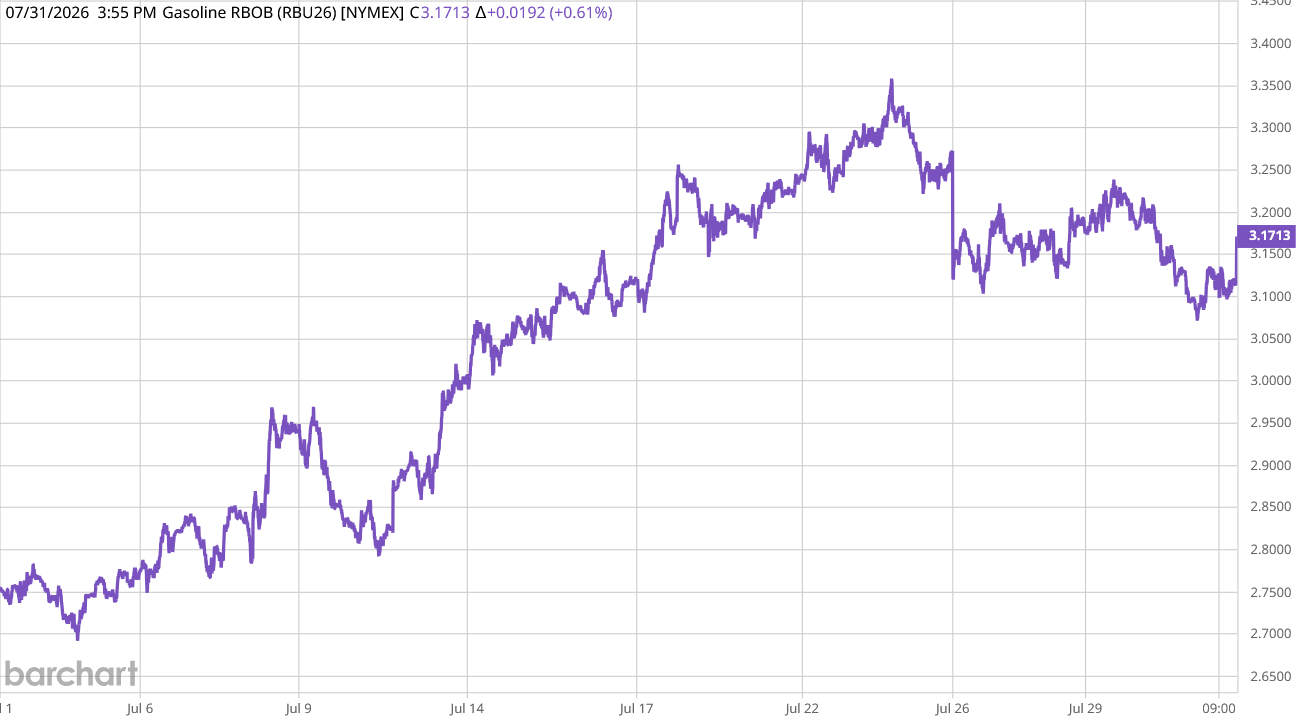
The same holds true for RBOB Gasoline September Contract Prices
Even fuel prices at the pump rose throughout the month.
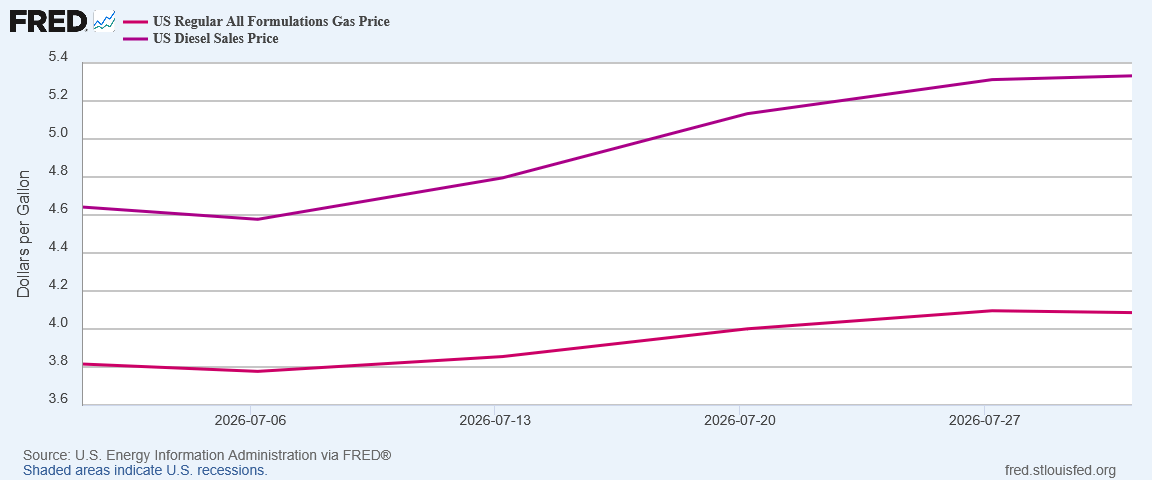
Energy prices rose throughout July, yet none of those price increase appeared in the July Consumer Price Index?
When we recall that March, April and May energy price increases were largely reflected in March, April, and May, that July would have delayed effect appears even more improbable—yet that is what the CPI data says transpired for energy prices in July.
Food Price Inflation Cooled
One clear bright spot in the CPI data was the disinflation for food prices for July.
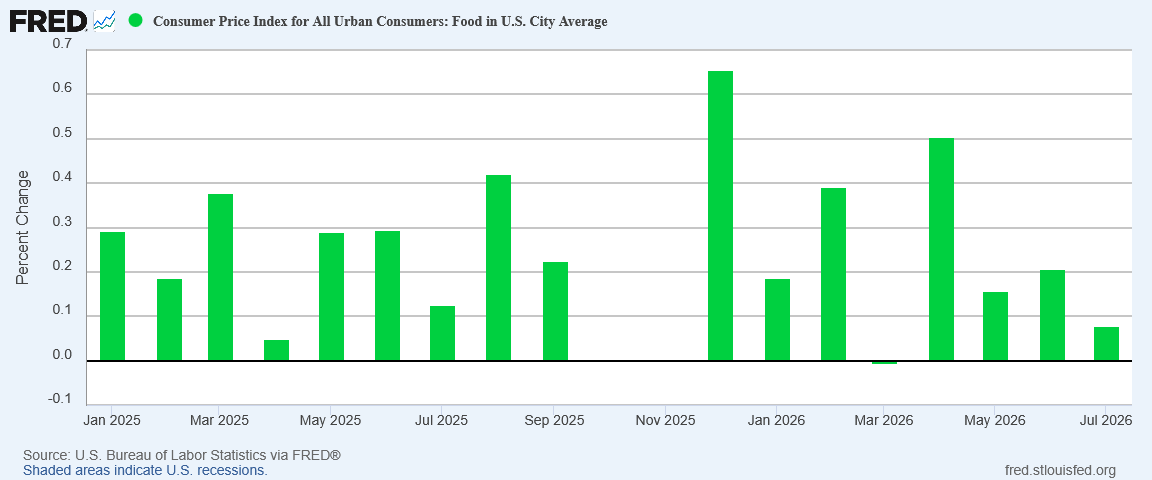
April has seen a sharp increase in food price inflation, but since then a general cooling trend has prevailed for the Food subindex.
Nondurable goods were another welcome bit of news, printing deflation again in July.
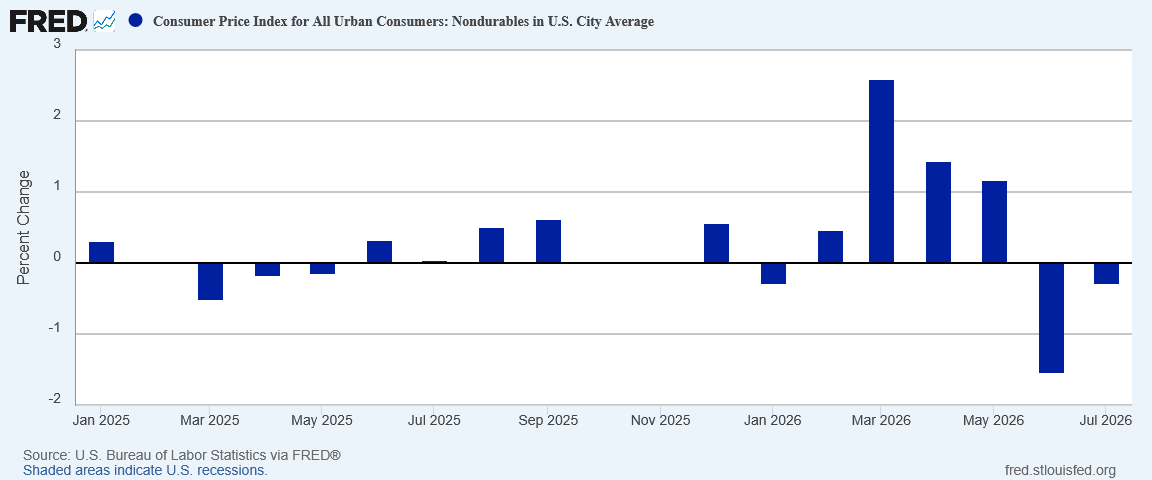
Energy prices are, as has been noted before, a major factor in the nondurable goods deflation.
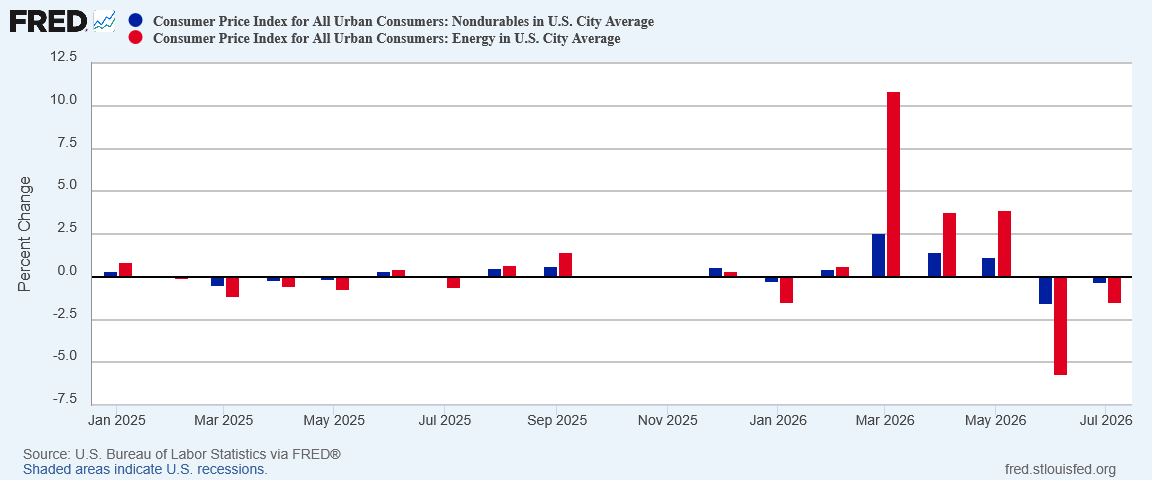
Outside of energy prices, the CPI data reports for July there are literally no inflationary pressures evident among nondurable goods.
Some Inflation Did Increase
Some components did show inflation getting a bit hotter, however.
Durable goods printed significantly higher inflation month on month for July.
Services also posted significantly higher inflation month on month.
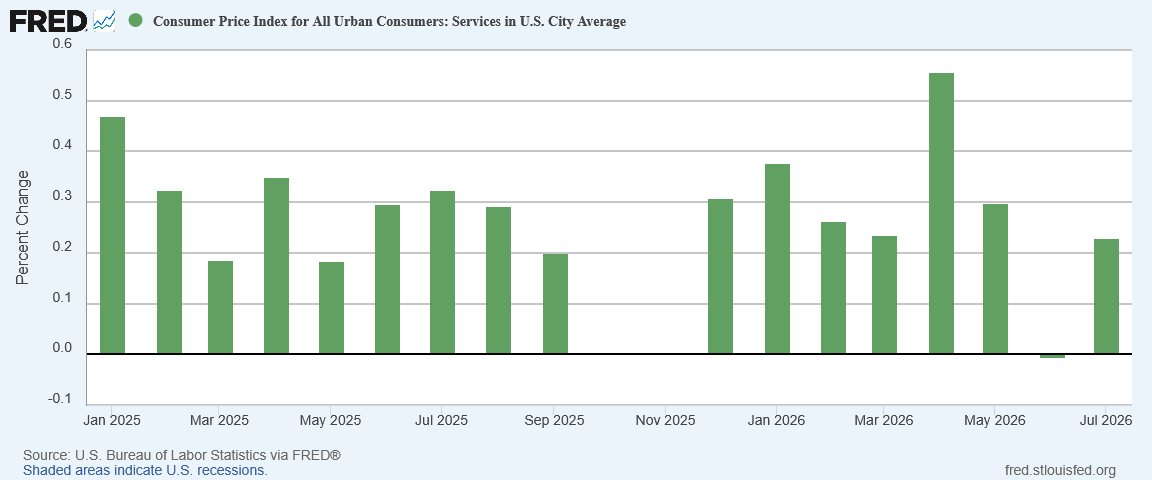
Unlike with Durable Goods, however, the rise in Service price inflation represents more of a reversion to mean after an outlier drop in Service prices for June. Relative to May, Service price inflation has still cooled somewhat overall.
Shelter prices per the CPI data printed marginally higher inflation for July than for June.
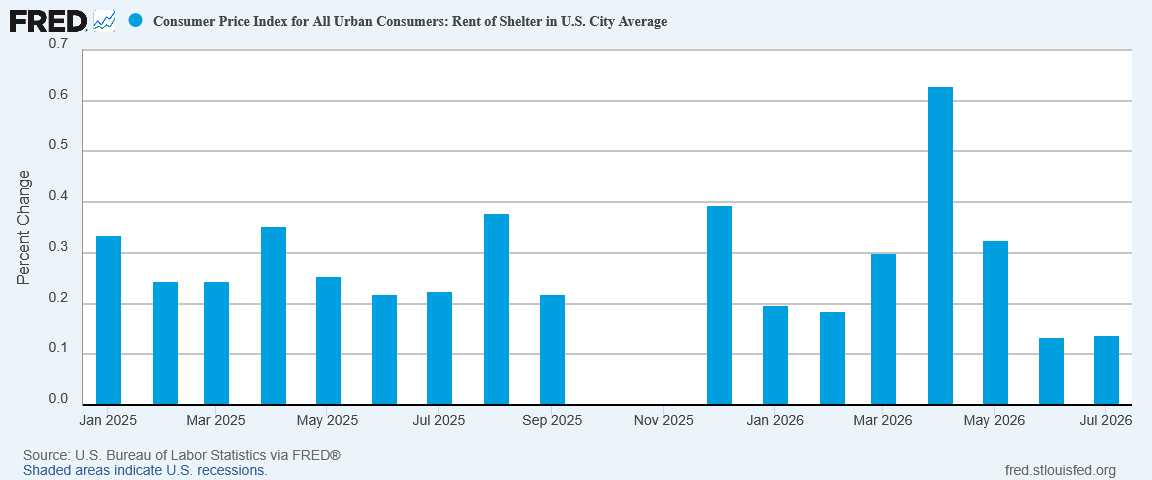
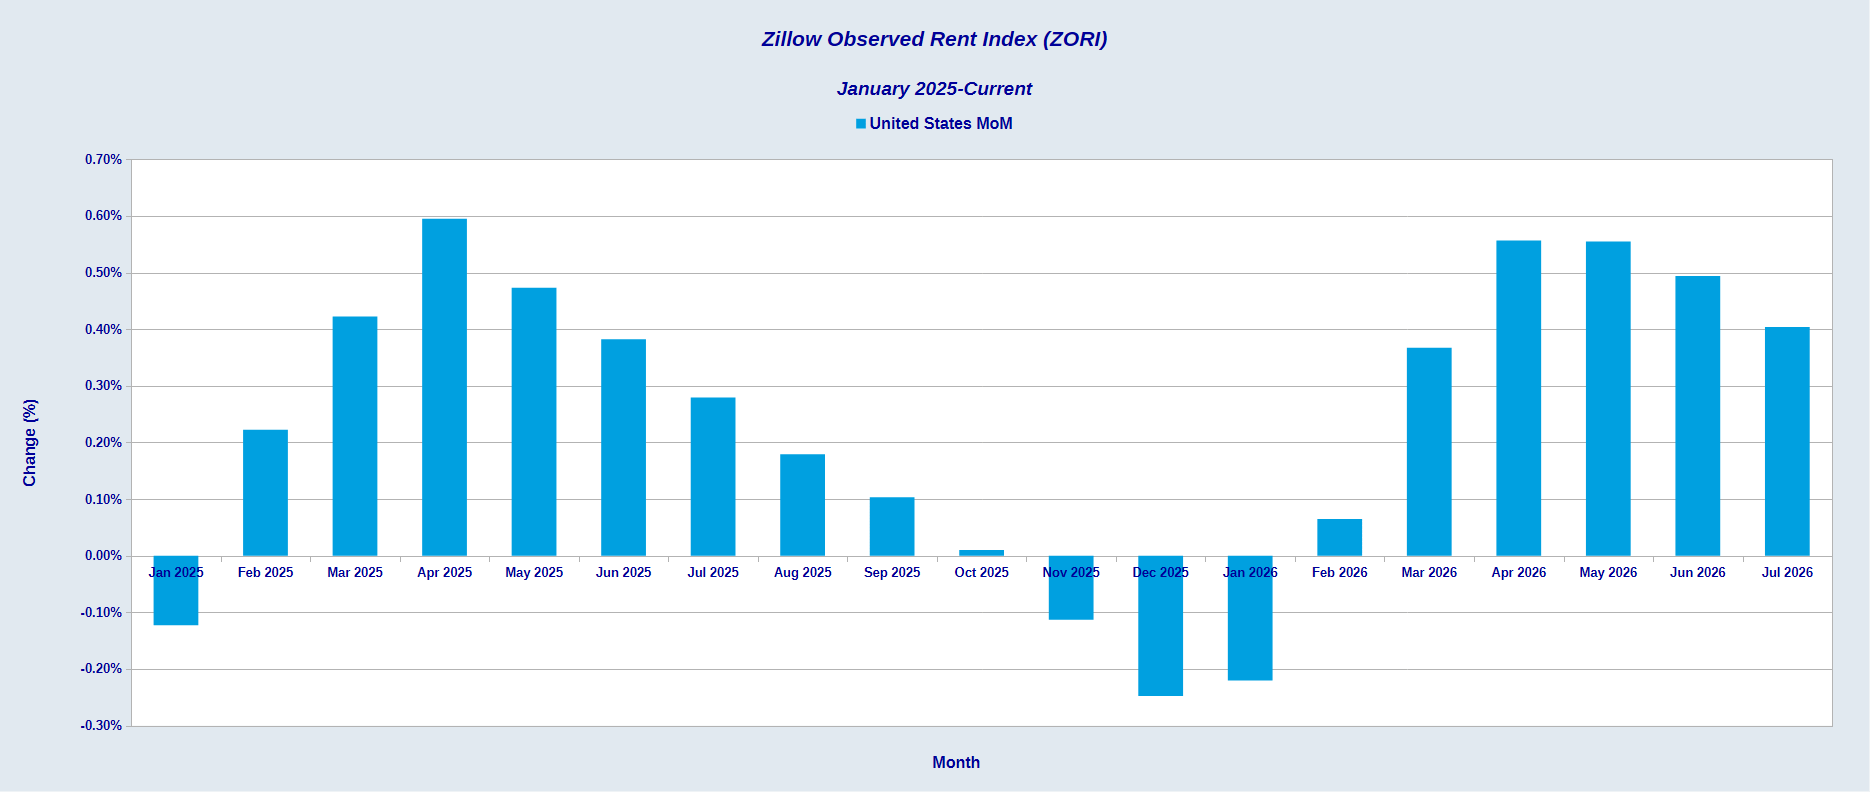
In some regards, this is unsurprising. The BLS data on rents and housing tends to be more backward-looking than forward-looking. When we look at the more forward-looking Zillow Observed Rent Index (ZORI), we see shelter price inflation cooling in July.
While some subindices are printing hotter inflation for July, none of them are printing enough inflation to make a significant dent in July’s energy price deflation.
Not Much Inflation Beyond Energy
If we step back and look at the major subindices side by side, we quickly see that energy is the only component which posted significant price increases year over year. Indexing the CPI components to January 2025, there is almost no significant upward movement in the CPI data except for energy.
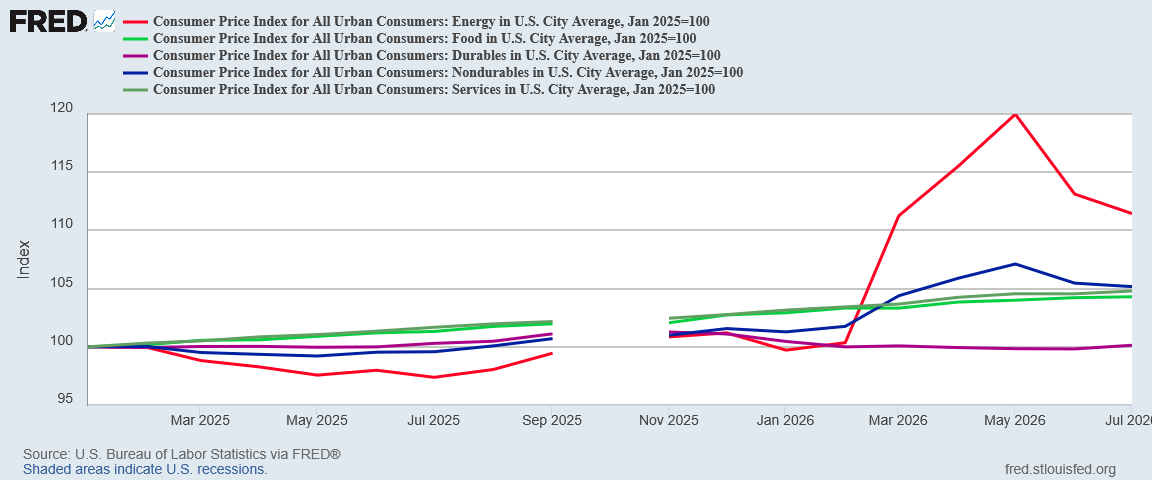
Nondurables shows some increase as a result of Operation Epic Fury, but this is unquestionably also the result of energy prices—which are a part of nondurable goods. Food and services have not seen any appreciable impact attributable to the oil supply shock coming out of the Persian Gulf.
We do not see any real inflationary pressures when we zoom out and use January 2021 as the index baseline.
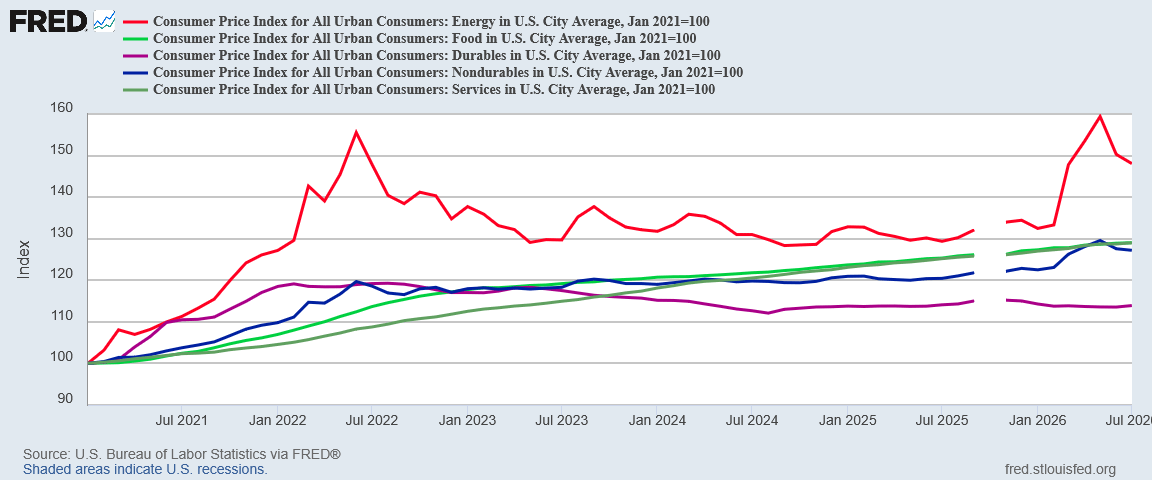
While food and services have shown steady increases since the 2022 hyperinflation cycle, nondurable goods had plateaued before the oil supply shock pushed up nondurable goods prices starting in March.
Durable goods have been in long-term deflation since the hyperinflation cycle, and July’s sudden inflation spike is not large enough to appreciably shift that curve up.
Once again, the lack of inflation even long-term for nondurable goods is yet more confirmation of a cooling economy.
When Will We See The Inflation?
Regardless of what the CPI data set shows for July, there is no doubt that energy prices rose in July. Crude oil, RBOB Gasoline, and diesel all showed significant price increases over the month, yet none of it charted for July.
Curiously, the Producer Price Index for July also failed to capture any of the July energy price increases.
Whether this month or next, those price increases will percolate into the CPI and PPI data sets before too long.
With both Iran and the US continuing their economic brinksmanship over the Strait of Hormuz, not only should we anticipate August or September capturing the July energy price increases, we should be watching for signs of the second wave oil supply shock I call the “oilpocalypse.”
As the Strategic Petroleum Reserve nears its statutory floor, if the Strait of Hormuz remains closed to maritime traffic, losing the buffering effects of SPR releases will push energy prices quite a bit higher. We may yet see Brent Crude move back north of $100/bbl. Without the SPR as a price buffer, $135/bbl would not be an unrealistic threshold for Brent Crude to cross in a stagflationary oilpocalypse scenario.
Will the oilpocalypse happen? We are not going to know the answer to that until it does happen.
What we know now is that oil production within the Persian Gulf is down significantly from pre-war levels, and tanker traffic in the Strait of Hormuz is nonexistent. What we know now is that global oil supply is being reduced; when strategic reserve releases end global supply is likely to be reduced further.
If the Strait remains closed, and Persian Gulf oil remains not on the market, sustained higher prices will result. How much higher oil prices go will decide how damaging the oilpocalypse ultimately will be.
Whether from the oilpocalypse or just from prices finally percolating through to the CPI data set, market price hikes such as we saw in July for energy commodities will show up in energy price inflation. Energy price inflation is going to happen before too long.
The expectation had been that it would happen in July. While that expectation has been pushed back to August, or perhaps September, it will happen.
When it does happen—or, rather, as it happens—there is sure to be a suppressive effect on the overall economy. As is invariably the case with all supply shocks, any sharp reduction in supply necessitates a drop in demand before market equilibrium can be restored.
That is the other economic shoe we are waiting to see drop—the appearance of demand destruction as markets rebalance to absorb a major oil supply shock.
So far the oil supply shock has been largely minimized. When the mitigations of strategic petroleum reserve releases run their course, and the Strait of Hormuz is still closed, that is when we will experience the full force of what no oil through the Strait really means.
The question of the moment is when will we see rising energy prices reflected in the CPI? The more pressing question is when will demand destruction set in, as the oilpocalypse unfolds across the world’s economies?
The answer to both questions is likely to be “soon.”
Already have seen the pump prices moving up here in Illinois. Granted, some of that is due to Pritzker and the Chicaco democrats tax increases!!!
HOW MUCH IS THE NEW ILLINOIS GAS TAX HIKE? – “Illinois drivers will see another gas tax increase July 1. The state tax will rise to 49.6 cents per gallon because of the automatic annual inflation increase built into the 2019 “Rebuild Illinois” infrastructure program signed by Gov. J.B. Pritzker. That means Illinois drivers will continue paying among the highest gas taxes in the country. Pritzker doubled the state gas tax from 19 cents to 38 cents in 2019,” – Dylan Sharkey - https://www.illinoispolicy.org/how-much-is-the-new-illinois-gas-tax-hike/ -
You’ve mentioned the possibility of missing data that would explain some of these mysteries. I’ve heard that Trump has many close friends in the oil industry, so I’m wondering what kind of mitigations from them could exist. I have no clue.
Another mystery - to me, anyway - is the lack of reaction from Wall Street. You’ve shown irrefutable data indicating an oilpocalyse, yet Wall Street has registered no alarm. Why aren’t they freaking out about the impending dire economic results? Again, I have no clue.
But I have confidence that you, Peter, will find the explanations and be among the first to analyze them. Thank you in advance!