According to the Bureau of Labor Statistics and their August Job Openings And Labor Turnover Survey report, companies really really really wanted to go on hiring spree in August.
The number of job openings increased to 9.6 million on the last business day of August, the U.S. Bureau of Labor Statistics reported today. Over the month, the number of hires and total separations changed little at 5.9 million and 5.7 million, respectively. Within separations, quits (3.6 million) and layoffs and discharges (1.7 million) changed little. This release includes estimates of the number and rate of job openings, hires, and separations for the total nonfarm sector, by industry, and by establishment size class.
That they didn’t is presumably yet more proof of how “strong” the labor market in the US really is.
Employment vacancies at U.S. businesses unexpectedly surged in August, a sign that the labor market remains tight and robust despite the Federal Reserve’s efforts to slow the economy.
Job openings totaled 9.61 million for the month, a jump of nearly 700,000 from July and well above the Dow Jones estimate for 8.8 million, the Labor Department said Tuesday in its monthly Job Openings and Labor Turnover Survey.
Of course, when you unpack the BLS’ stewpot of numbers, it is not nearly so certain that the labor market is at all “strong”. “Toxic” is still likely the better alternate adjective.
One of the challenges we have in digesting the August JOLTS report is that while the seasonally adjusted data shows 690,000 job openings added, the raw data shows 83,000 job openings lost.
In only three months this year has the raw data shown the number of job openings increasing month on month. Interestingly, the seasonally adjusted data has only notched job openings gains in two months this year.
That the seasonally adjusted data shows an increase while the raw data shows a decrease is itself somewhat unusual. Examining the two charts on top of each other shows that this is not really the norm.
If we look at the month on month changes going back to the beginning of 2022, we can see that this manner of deviation occurs less than half the time (8 months out of 20, to be precise).
Consequently, we should be a little skeptical about the “seasonally adjusted” data showing large numbers of new job openings for the month of August when the raw data shows fewer job openings.
The other reason to doubt the job openings number is, of course, that once again net hiring and firing failed to reflect the same presumed increased interest in hiring people.
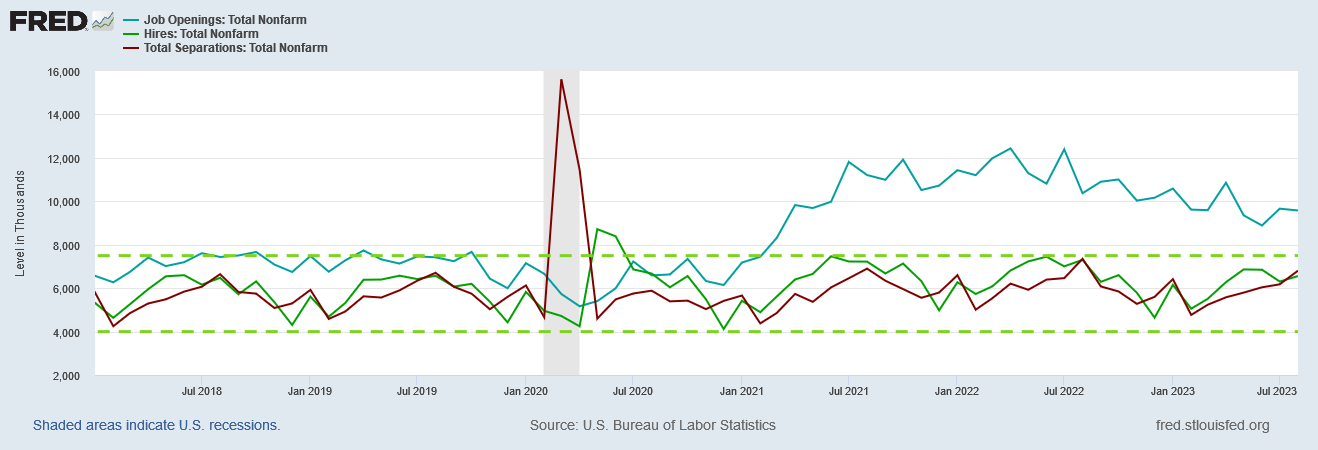
Aside from a very brief hiring burst right after the Pandemic Panic Recession, at no point since the recession has hiring in this country strayed outside an historical range—a range that, pre-pandemic, even job openings largely respected.
Since spring of 2021, job openings have stayed well above the historical upper bound of 7.5 million, but hiring has stayed below it.
It is difficult to fathom that, regardless of how high the purported job openings have been, that hiring has not been able to rise even somewhat to match it.
It is even more difficult to fathom this lack of hiring when there are nearly 4 million more individuals not currently in the labor force than there were at the start of the Pandemic Panic Recession in 2020.
In percentage terms, 43% of the people sidelined by the Pandemic Panic remain on the sidelines—and the businesses reporting these job openings have strangely not been able to bring these people back into the workforce.
If these people are for some reason prevented from returning (i.e., because of disability), then that still argues against a “strong” labor market and rather speaks to an highly constrained on. Effectively, the labor supply has been artificially reduced in a fashion not unlike the OPEC production cuts designed to boost the price of oil.
Yet even if that is the case and there are such artificial constraints, then either labor costs are far lower than is appropriate given the reduced labor pool or the job openings are simply not that crucial to businesses that they are able to go unfilled to such a large degree.
We have even more confirmation that the JOLTS data simply does not add up when we compare job openings patterns in various industries against hiring and separations patterns in those same industries.
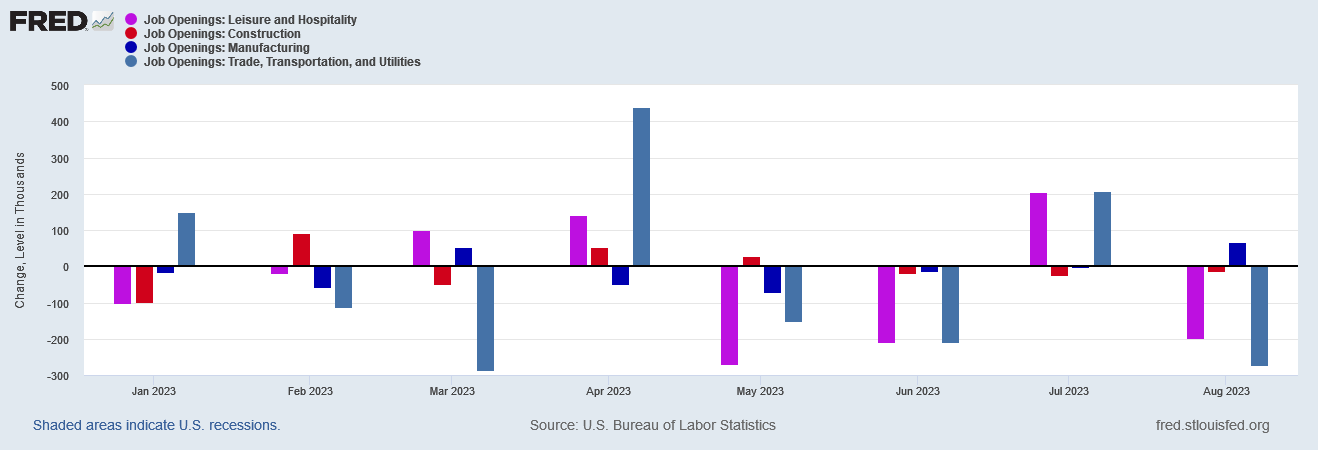
In the unadjusted data, Leisure and Hospitality lost 199,000 job openings, Construction lost 14,000, Trade and Transportation lost 272,000. Manufacturing, however, managed to gain 68,000 in August.
Yet despite Leisure and Hospitality losing job openings, hiring in that sector actually increased.
The same thing happened with Trade and Transportation. Job openings dropped dramatically, but hiring increased.
Separations followed a similar pattern as well—the areas with the greatest decline in job openings showed the greatest increases in separations.
Once again, these patterns are difficult to reconcile with notions of a “strong” labor market. Sectors with a marked decrease in job openings could very easily have high separations. That might even be consistent with a particular sector being in economic contraction for whatever reason.
However, a sector or industry that has fewer job openings and more separations, a sector or industry that is in contraction for whatever reason, is not a sector or industry that would be leading the way in terms of hiring as well. One certainly would not expect a sector that is in contraction to comprise an increased percentage of total hires—which is true for the Leisure and Hospitality sector.
In a “strong” labor market, job openings and overall hiring patterns ought to at least move in the same direction. That is not the case according to the August JOLTS report.
While not necessarily an indicator that something is amiss in the jobs data itself, looking at overall hiring patterns also brings us to another important aspect of work in the United States—the relative proportion of people who are quitting their job vs those who are laid off or fired. The proportion of quits in total separations has been rising for most of the past decade.
What has been dubbed the “Great Resignation” is a labor phenomenon that has been building for a number of years, and has reached record levels in the wake of the Pandemic Panic Recession. People are far more likely today to quit their job than they have been previously.
This could indicate greater confidence in one’s ability to find another job and thus could be an indicator of greater labor demand. However, that begs the question again of why so many people sidelined by the recession have not returned to the workforce. If labor demand is up, people should be getting pulled back into the labor force, and in August that was not the case. If the labor markets are indeed “strong” and labor demand is up, that should have been the case.
This could also indicate greater frustration with one’s job and less willingness to tolerate undesirable working conditions. Yet if there is a broad expression of worker frustration taking place with the larger percentage of quits, once again that undercuts the notion of labor markets as being strong or in anyway healthy.
As has become the new normal for jobs data coming out of the BLS, the details beneath the headline numbers tell a far different story than the headline numbers themselves.
A rise in reported job openings might indicate high labor demand, but closer scrutiny of the underlying data only makes the reported number itself highly suspect.
The continued divergence between job openings and hiring and separation trends actually shreds the narrative of a “strong” labor market. Whatever the true state of the labor market is in this country, “strong” is not the appropriate adjective.
As with much of the American economy, the American labor market instead continues to be toxic and dysfunctional. Moreover, it has been this way since at least the Pandemic Panic Recession—and it is getting any better.
That is the real and continuing takeaway of the August JOLTS report.


