


After this past weekend’s agreement pausing the trade war between China and the United States, news that consumer price inflation is continuing to cool seems almost anticlimactic. Yet that is precisely what the April Consumer Price Index Summary report had to say.
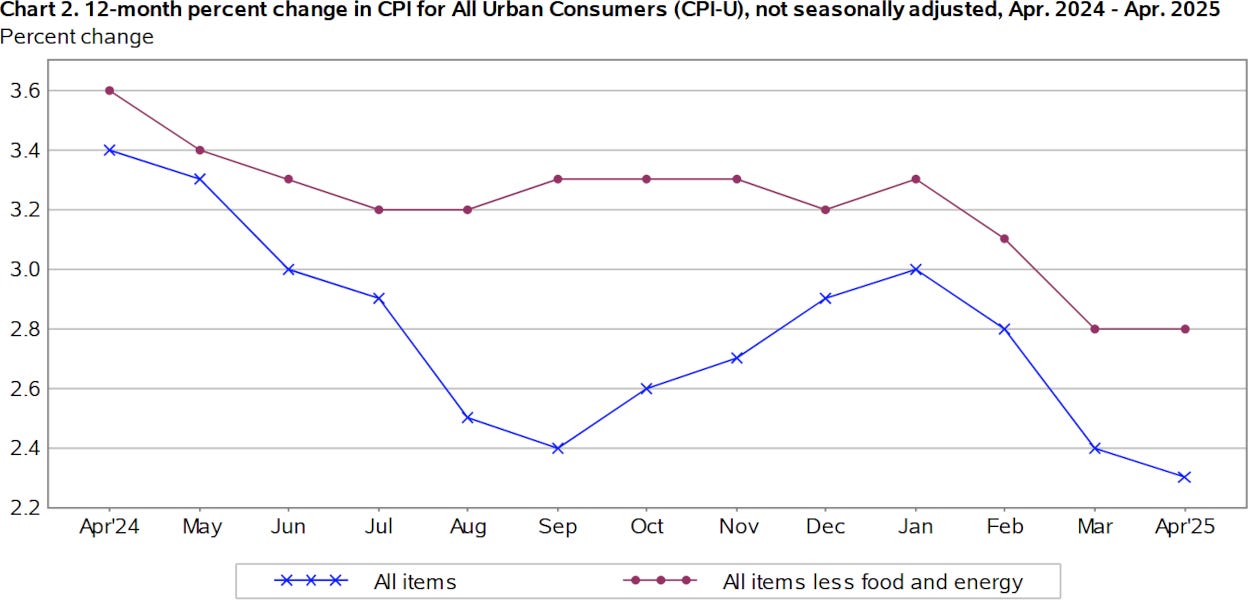
The Consumer Price Index for All Urban Consumers (CPI-U) increased 0.2 percent on a seasonally adjusted basis in April, after falling 0.1 percent in March, the U.S. Bureau of Labor Statistics reported today. Over the last 12 months, the all items index increased 2.3 percent before seasonal adjustment.
While headline inflation did rise to 0.2 percent month on month—almost inevitable after March’s surprise deflation—year on year consumer price inflation declined to 2.3%, the third straight declining month in a row.
The inflation report is not without a few warning signs, however. Core inflation barely dropped year on year, indicating that inflationary pressures still lurk within the US economy.
Intriguingly, a closer inspection of the data shows no clear indication the Liberation Day tariffs drove inflation even in the categories where there was consumer price inflation.
Contents:

Energy Price Inflation?
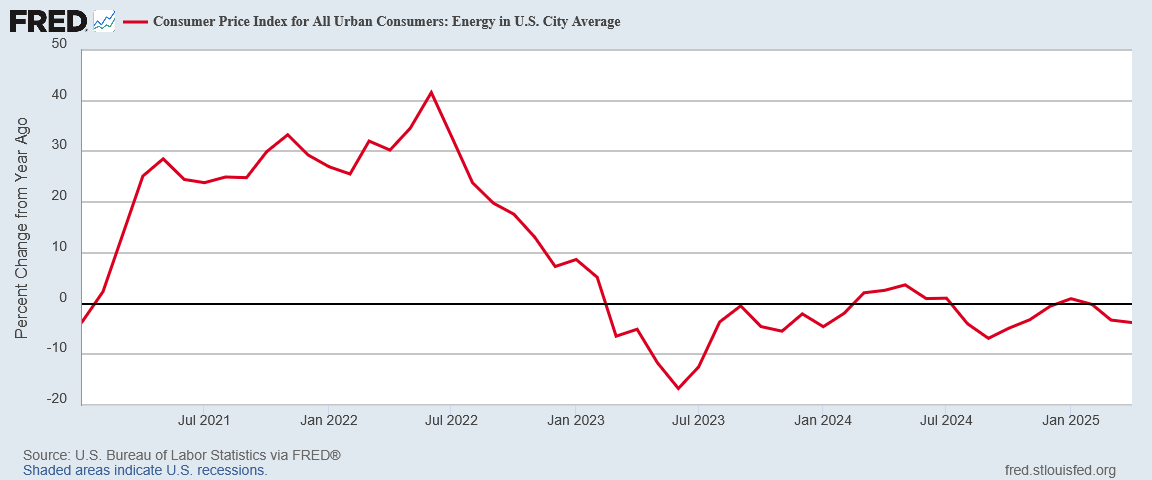
By far the most surprising inflation data came regarding energy prices.
With a year on year change of -3.74%, down from -3.25% in March, energy price deflation deepened.
However, month on month saw energy price inflation, with a change of +1.51%, a noticeable shift from March’s -0.05%.
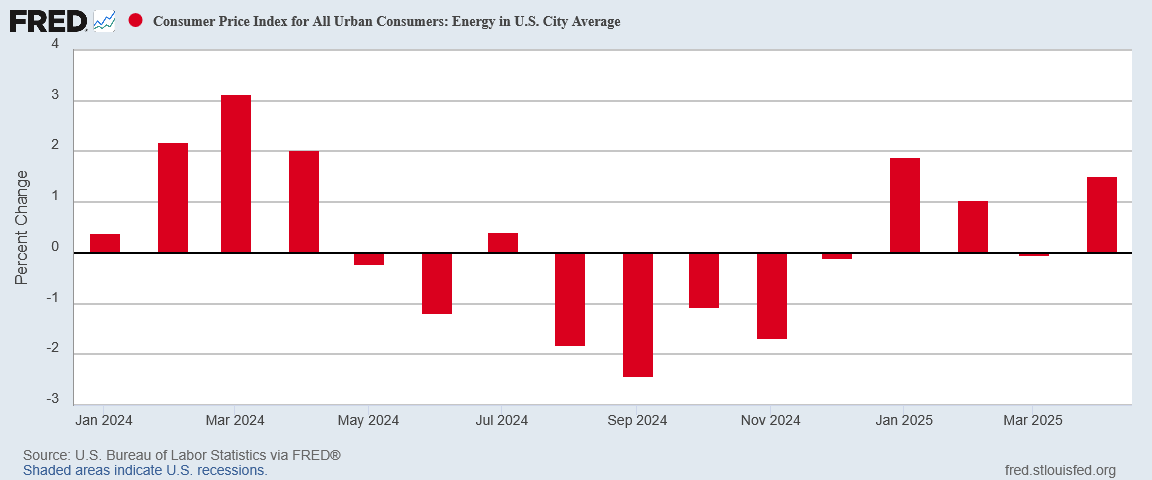
What makes this number particularly surprising is that April saw energy prices decline on several fronts.
Oil dropped by more that $10/bbl during April, with both Brent Crude and West Texas Intermediate posting significant declines.
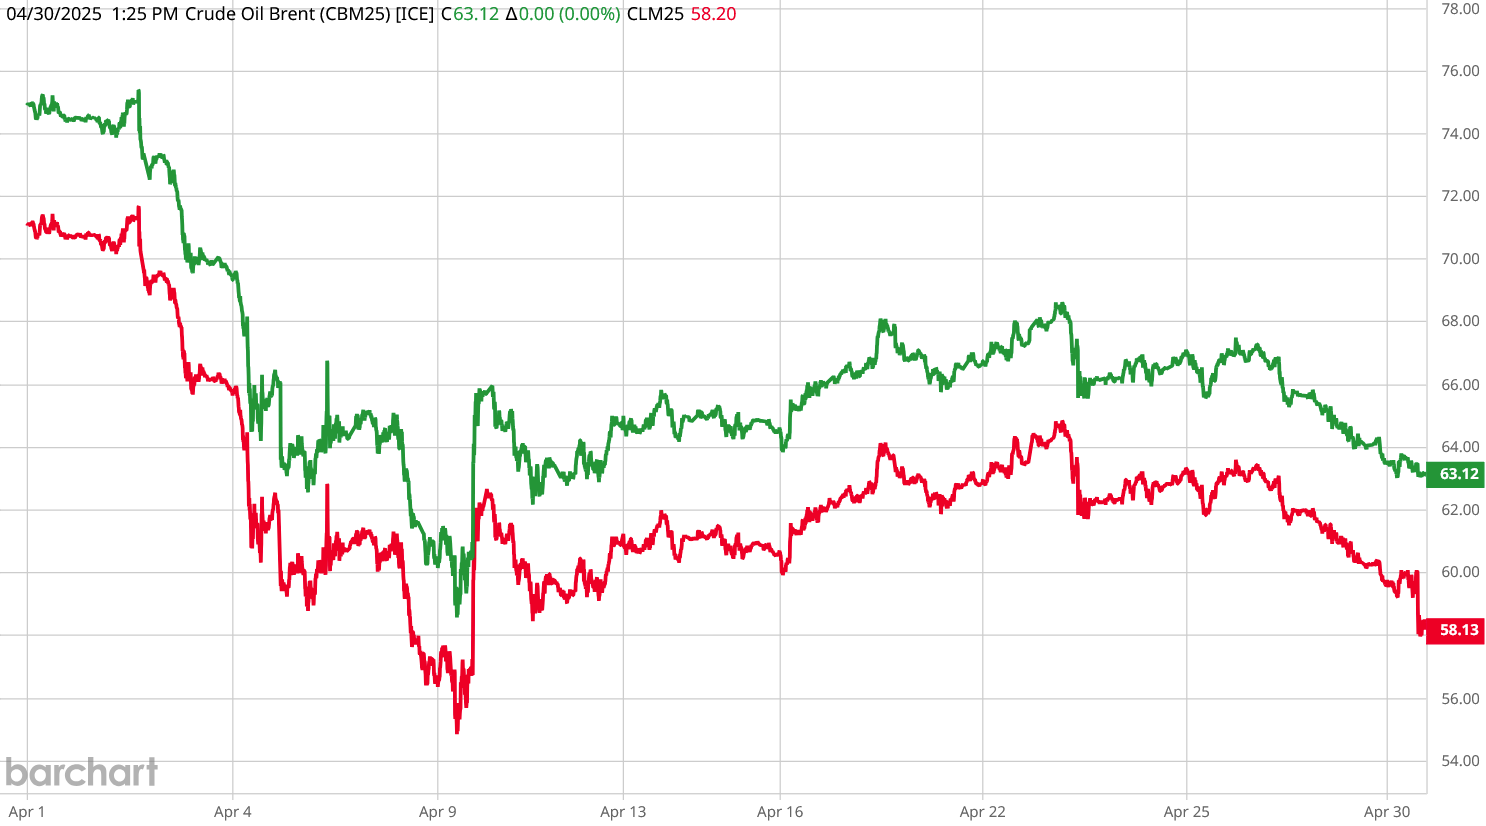
Ironically, most of the April price drop was catalyzed by the Liberation Day tariffs on April 2.
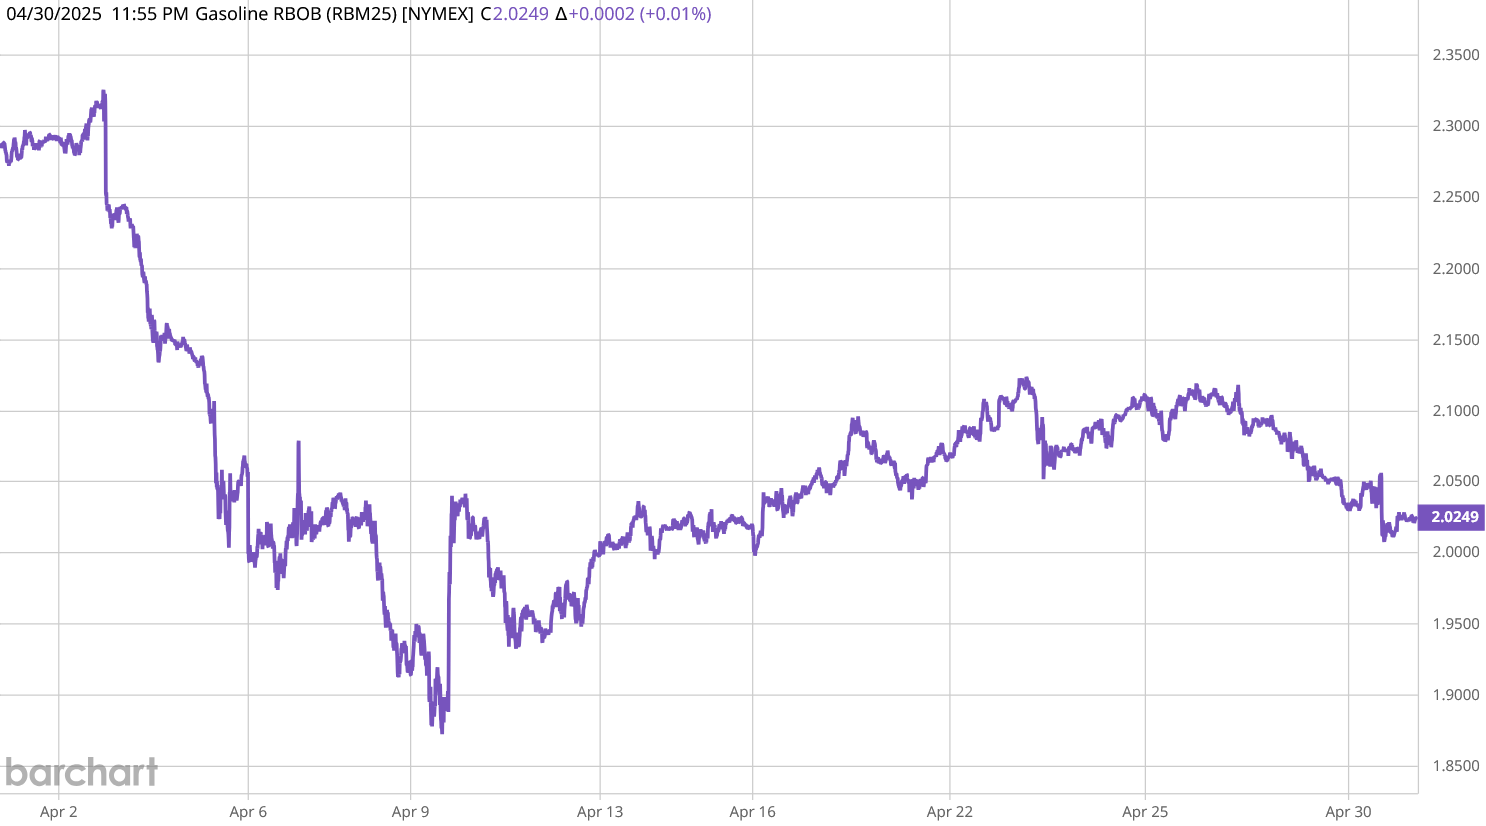
Gasoline futures were also down very nearly $0.25/gal.
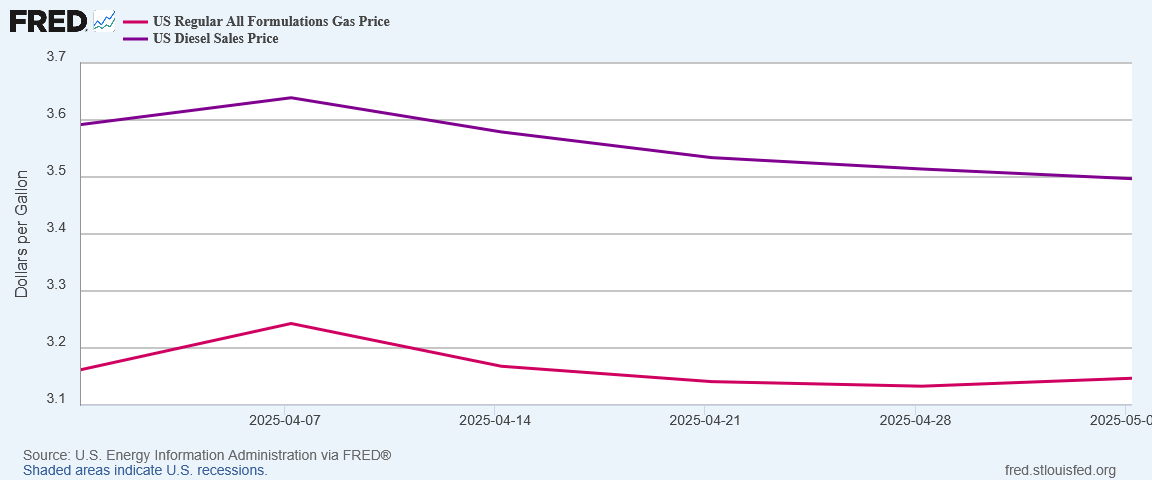
Nor was this tied merely to Wall Street bidding behaviors. Gasoline and diesel fuel saw retail price declines in April.
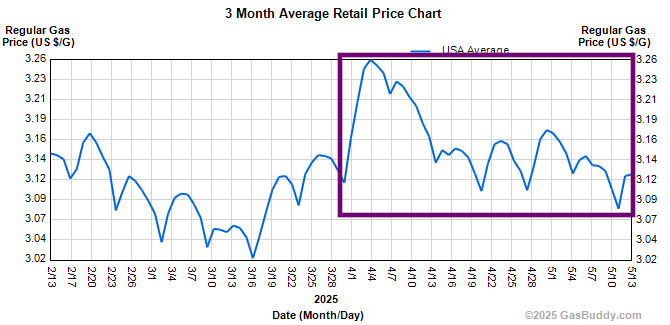
Even private measures such as GasBuddy charted fuel price declines.
With so many market energy price metrics posting declines, how is there energy price inflation on the month?
Within the CPI data itself, this appears to be attributable to rises in retail electricity rates, and also increases in delivery of piped natural gas into homes.
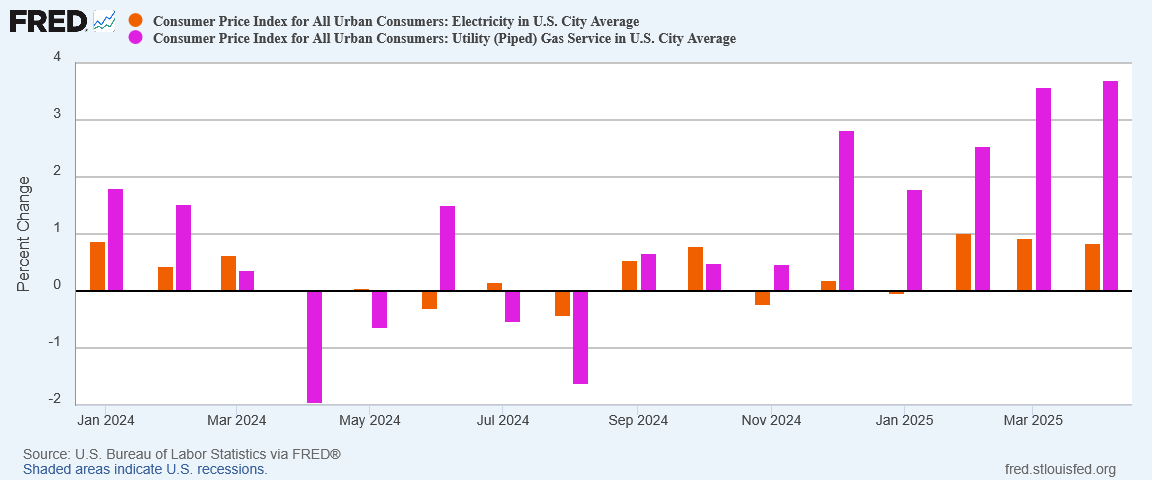
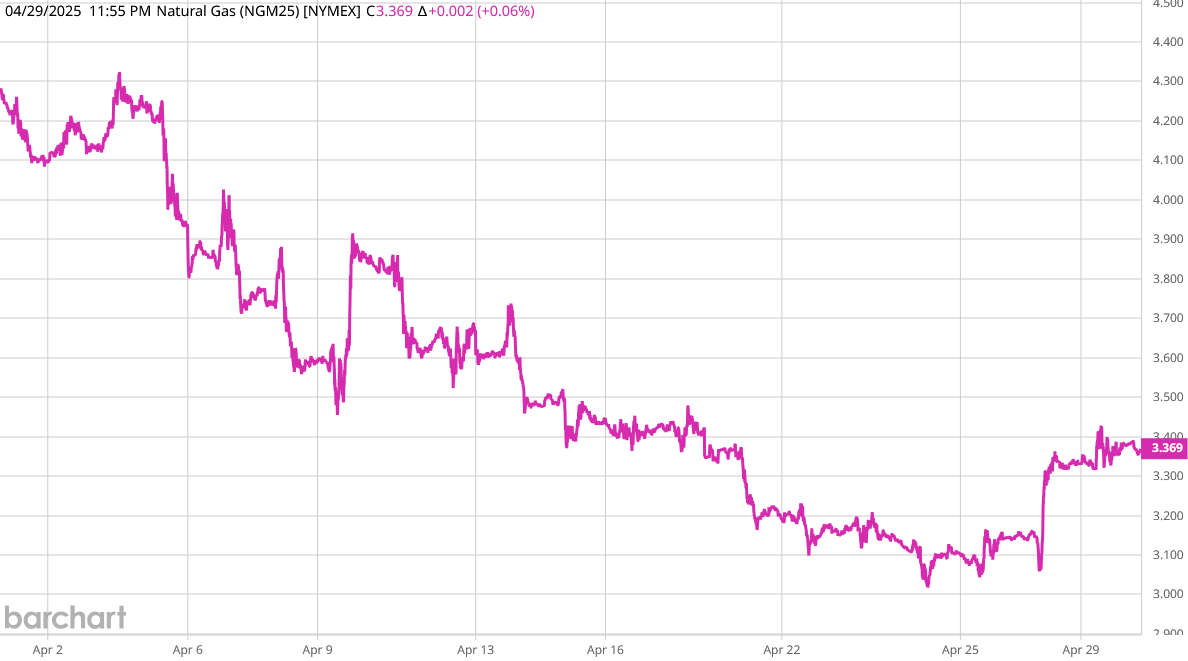
This merely creates a further mystery, however, as natural gas prices themselves declined in April.
There are significant deflationary impulses within market energy prices which do not appear to have been fully expressed within the consumer price index as of April. This bodes well for future months’ inflation data, which would be the beneficiary of the final resolution of these downward pressures on prices.
Food Price Deflation
Food prices presented no such mysteries, with the broad food price inflation metric declining year on year for April.
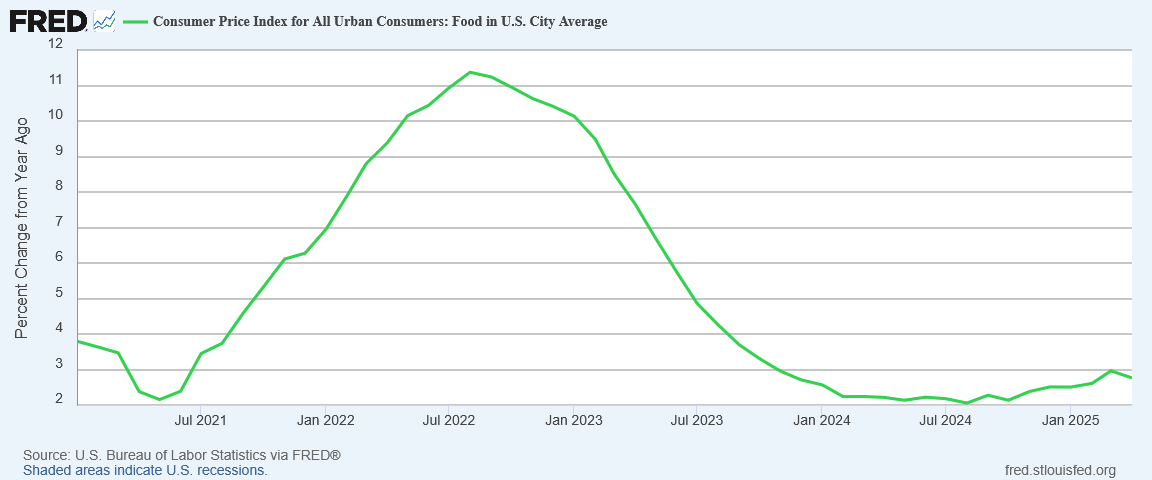
For the month, there was actually food price deflation.
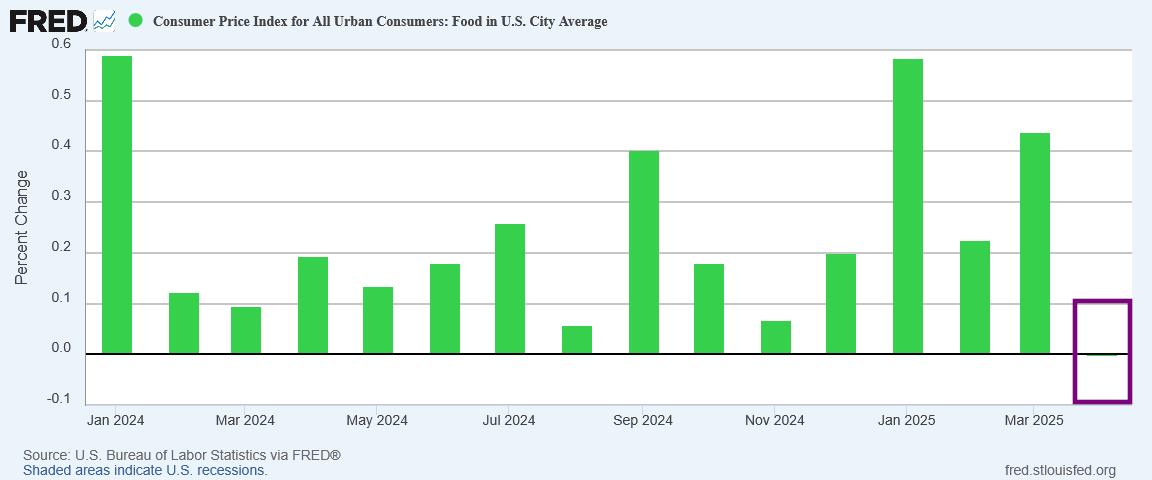
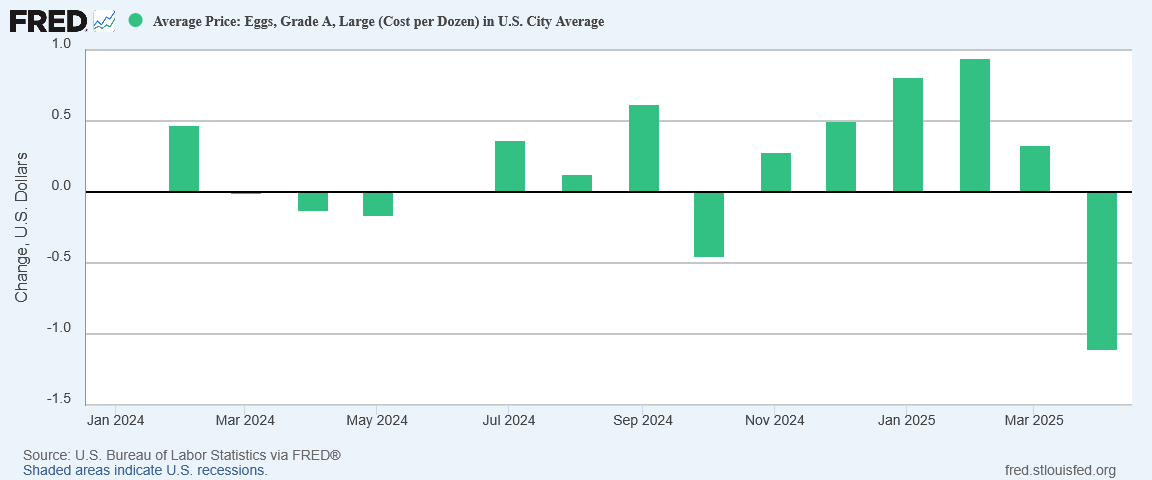
The major source of the decline was the price of eggs, as the price declines anticipated by the March PPI data showed up in the April CPI data.
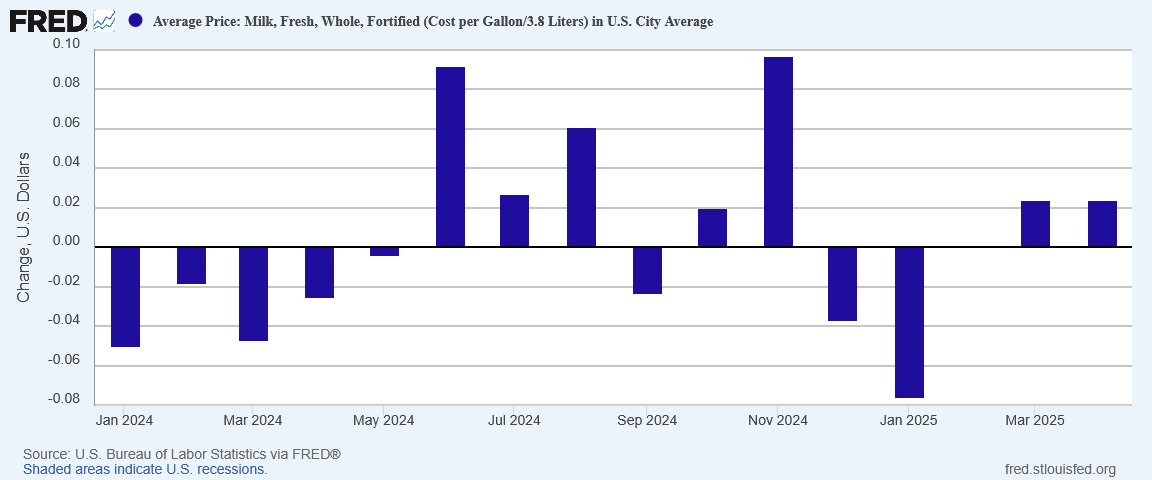
However, even where food items showed average price increases, the increases were small. Milk, for example, rose just $0.02/gal on average.
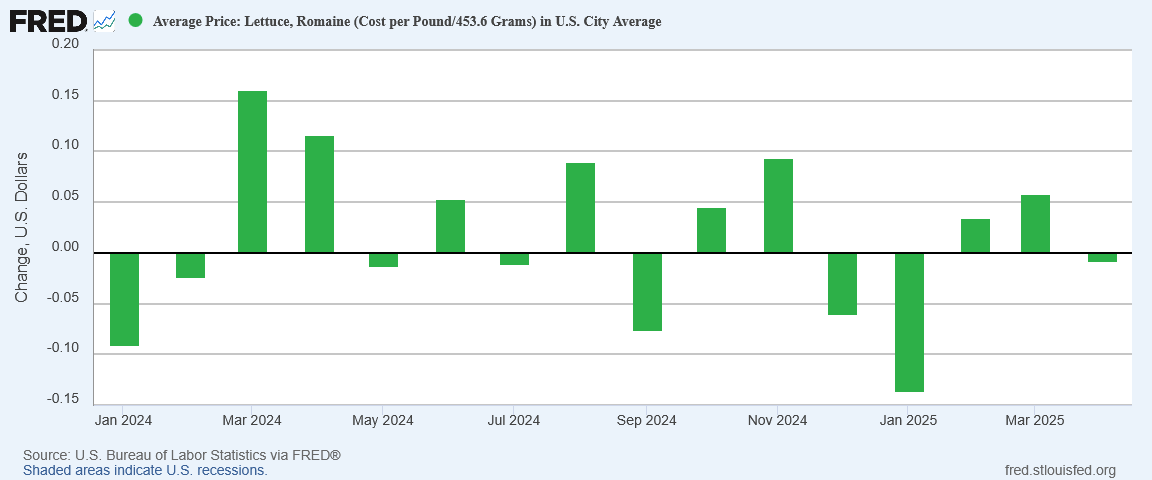
Lettuce prices actually declined in April.
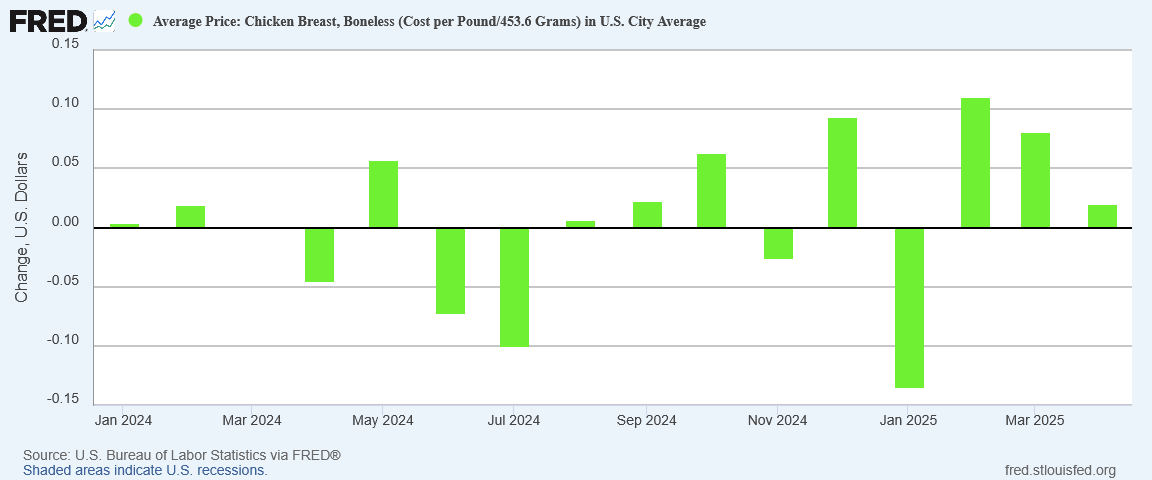
Average chicken prices rose just $0.02/lb.
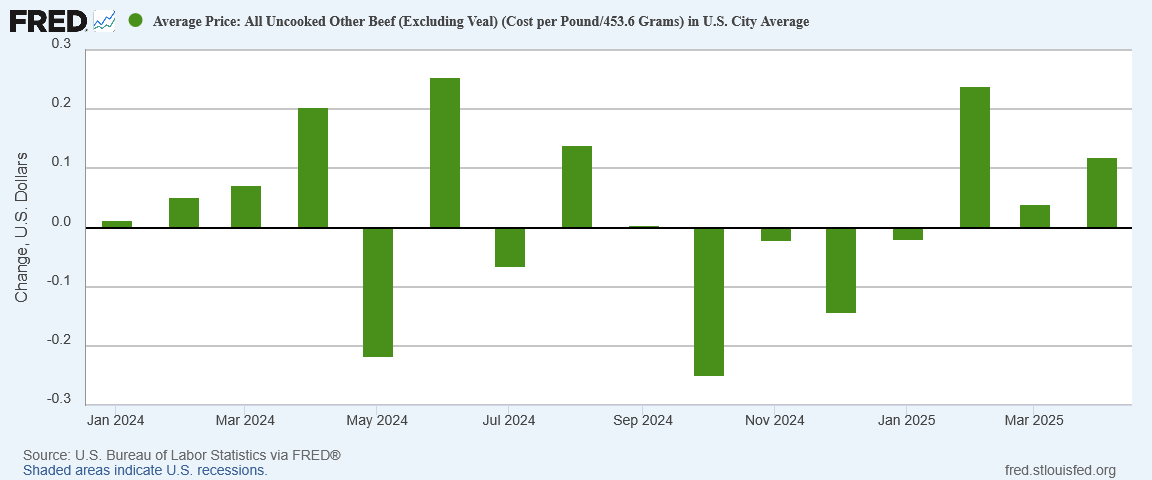
One notable exception was the average price of beef, which rose $0.12/lb
Across the broad food price category, the price increases that did occur were not so great as to fully counter the steep drop in egg prices, and thus we have food price deflation for the month.
Core Inflation Rising
Food prices are where most of the good news ends for the Consumer Price Index Summary. Within core inflation itself several price categories posted increased inflation metrics.
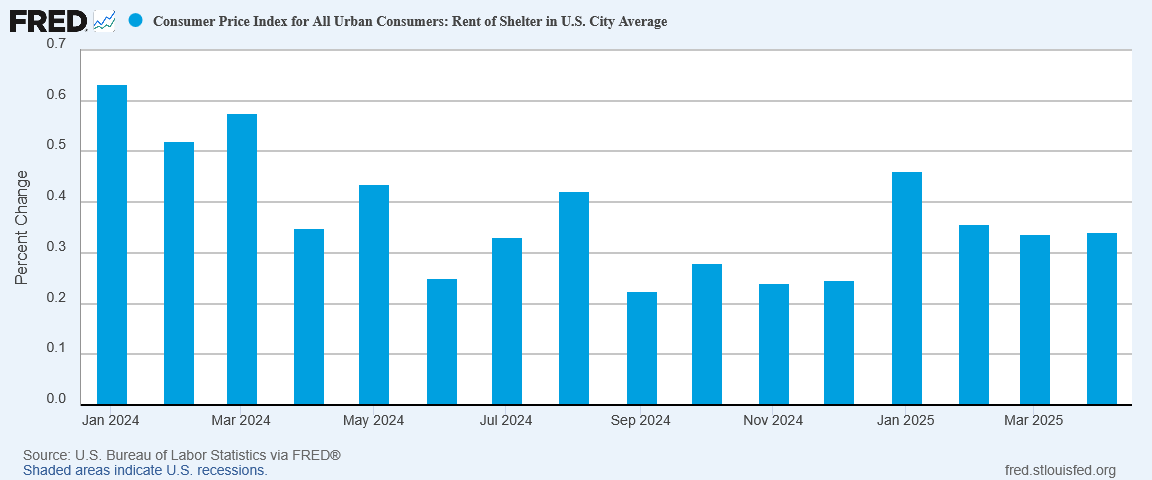
Year on year, the inflation rate for shelter was unchanged in the CPI data.
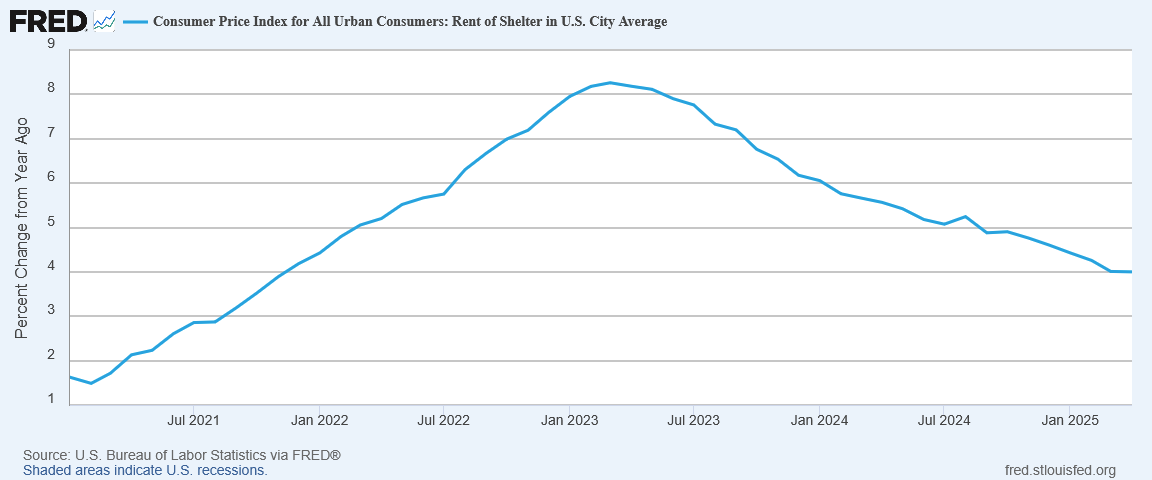
Month on month, however, the inflation rate moved up slightly.
Moreover, the shelter data within the CPI data set tends to be rather backward looking. If we examine a more forward-looking metric, such as the Zillow Observed Rent Index, we can see there are signs of inflation emerging within shelter prices.
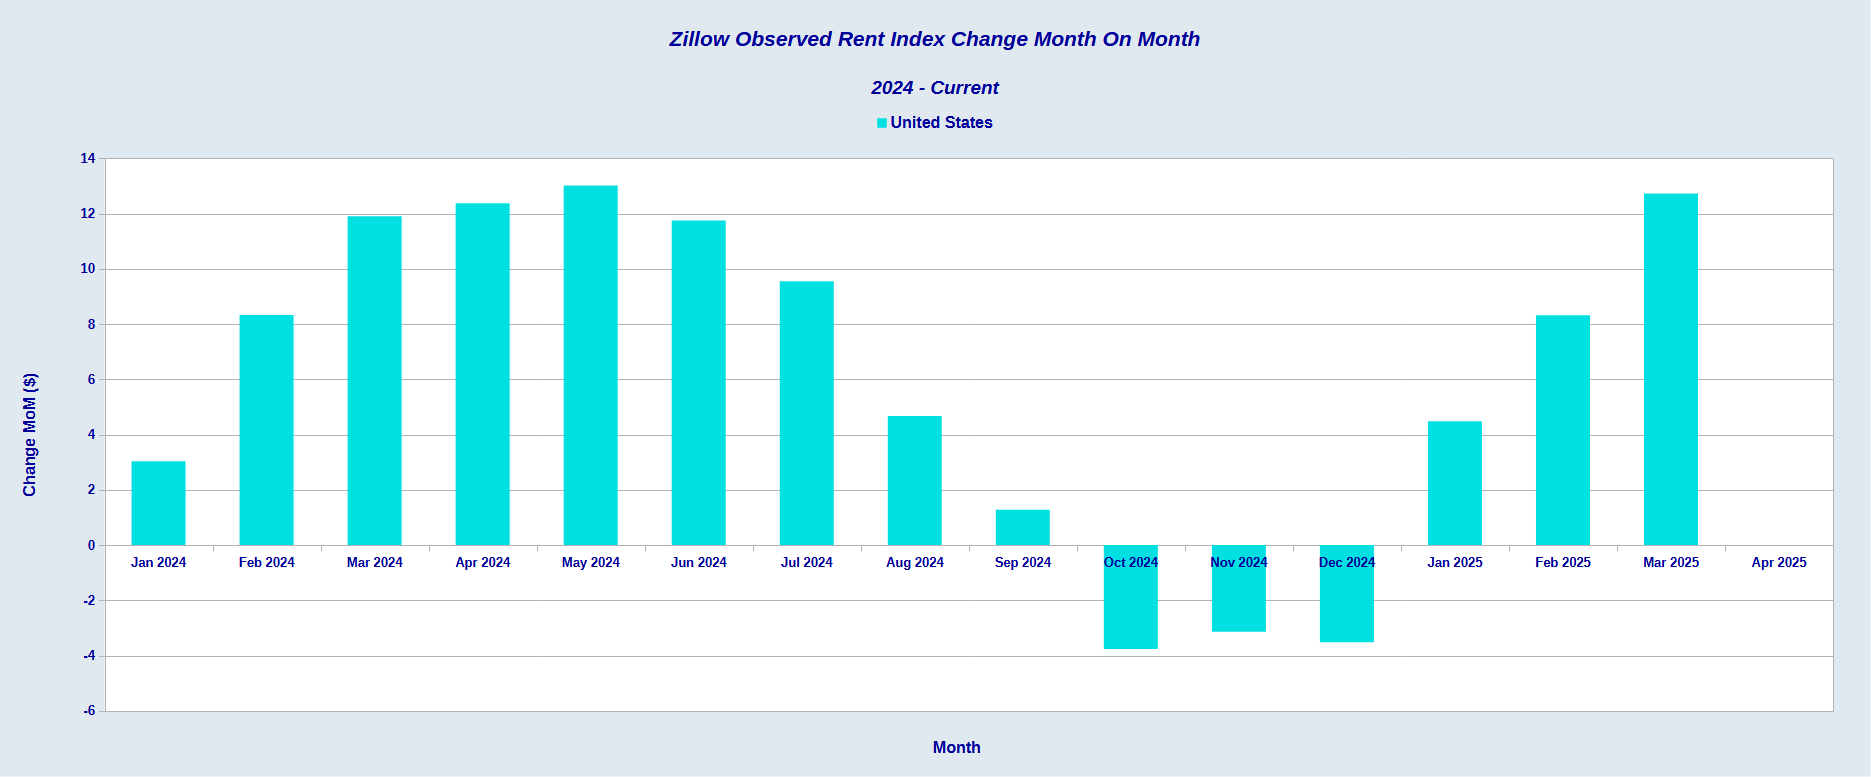
We should anticipate a rise in rental prices over the next few months, as the data charted by Zillow works its way into the broader CPI data set.
Inflation within durable goods spiked in April.
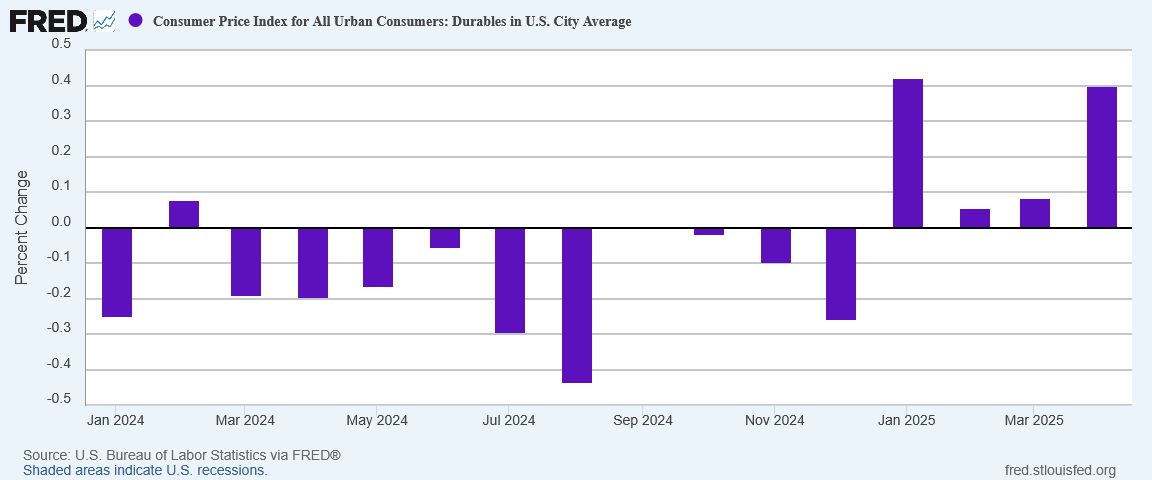
This might be the one sign we have of tariff-driven inflation, although much of that arguably is due to consumers bringing forward a lot of purchases in anticipation of tariffs taking effect.
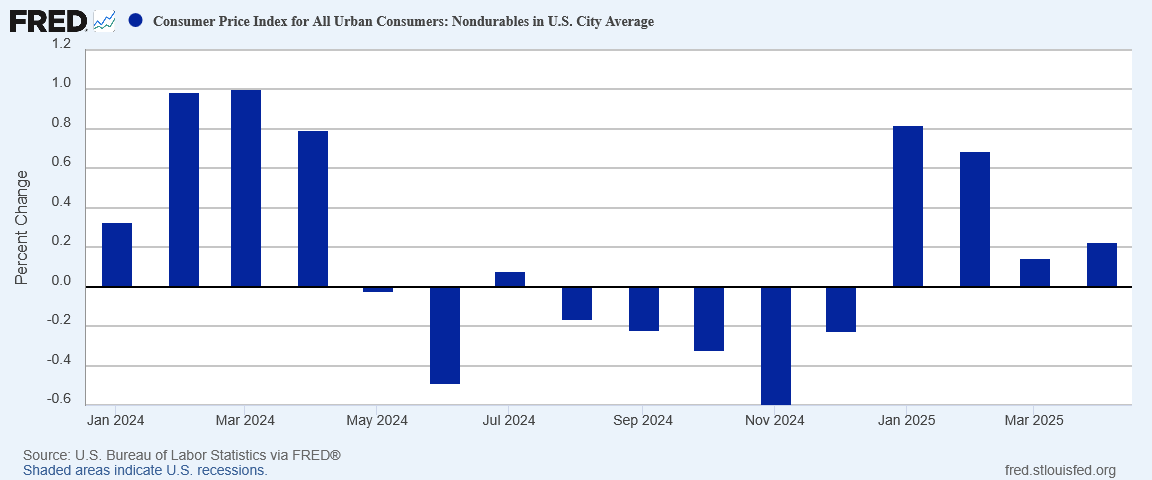
That could very well be the case, because nondurable goods did not show an inflation surge of even remotely similar magnitude.
Even services, which did show rising price inflation in April, could hardly be said to have “surged”.
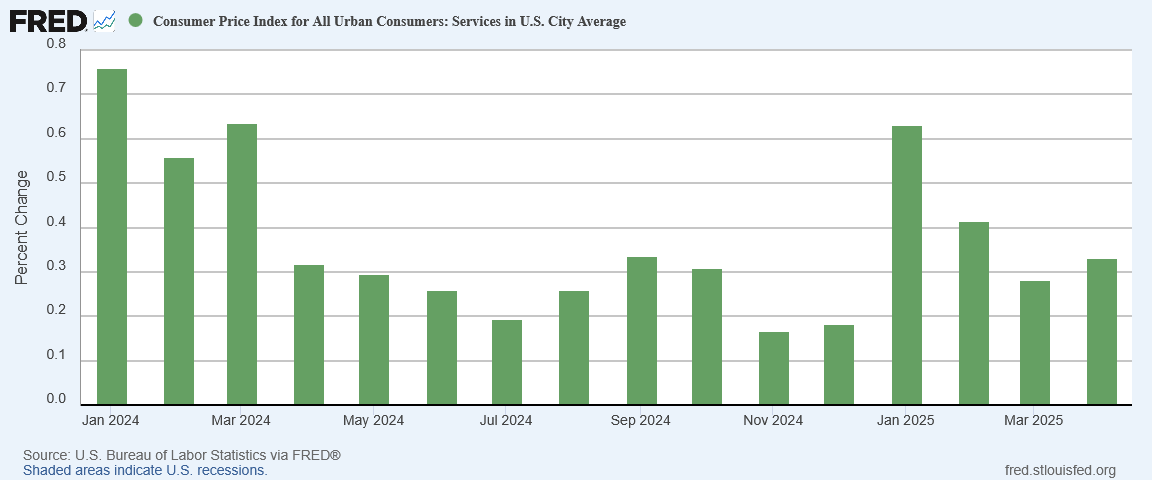
Core prices are ticking up, albeit marginally aside from the spike in durable goods. At a minimum, core prices are going to be susceptible to inflationary pressures in coming months, whether from tariffs or from a return of the “supply chain squeeze” that had been feared earlier in the year.

What Tariffs?
The most awkward question for corporate media regarding April’s inflation data is without a doubt “where are the tariff-induced price hikes?”.
For the most part, there weren’t any. Possibly we are seeing some tariff influence regarding the rise in durable goods prices, but beyond that, there are not any indications the Liberation Day tariffs have had any adverse impact on consumer price inflation.
Given corporate media’s hyperbolic headlines in recent weeks about tariff-induced inflation, that is a question that needs to be asked, particularly as the pause in the trade war with China pushes the tariff question to the back burner for at least the next 90 days.

Even without tariffs pushing prices up, however, there are indications of forces which may push prices up over the short term:
The Zillow data indicates shelter prices are likely to rise over the next few months.
Electricity rates and piped gas to homes are running counter to the broader market decline in energy prices.
Service prices are moving up.
The immediate inflationary red flags do not at this time indicate a return to the hyperinflation of 2022. They may indicate that April’s 2.3% year on year inflation rate will be as good as it gets for the next few months.
Regardless of these caveats, the overall assessment of the April Consumer Price Index Summary is that inflation is continuing to ease, year on year, and even month on month the March deflation is not fully reversed.
The April inflation data is likely to put Federal Reserve Chairman Jay Powell in an awkward position. With April being the third straight month of year on year consumer price inflation declines, as well as the second month with a strong jobs report, pressure is likely to mount on the Federal Reserve to trim the federal funds rate by at least 25bps, a step Jay Powell has been reluctant to take of late.

We can certainly expect Donald Trump to reiterate his calls for the Fed to trim interest rates.
The April CPI report might have been overshadowed by the China-US trade “reset” announcement, but it is still largely good news for April, with only a few caveats and spots of “bad news” to darken the mood even just a little.
It certainly will be good enough for President Trump to count inflation as one of his “Promises Kept”.
Whether that promise remains kept—and whether Trump’s tariffs will “unkeep” that promise—will be the recurring questions of at least the next few months.
What was your experience with inflation like in April? Did you see prices fall, rise, or stay the same? Leave a comment below or drop one in chat and let me know!
Given the huge surge in imports and inventories in March, most of the imported goods sold in April or used in production were likely at pre-tariff costs and hence would not cause price increases. Now that most tariffs are “paused” at lower levels, ongoing imports will be at slightly higher prices. But over all you are right, the cry wolf scenario on everything is getting tiresome.