

President Trump Says Jobs Numbers Are "Rigged"—Is He Right?
Unpacking the 'Lou Costello Labor Math' Behind Trump's BLS Firing

Is Lou Costello Labor Math the latest political conspiracy theory?
With President Trump’s firing of the head of the Bureau of Labor Statistics, Dr. Erika McEntarfer, we are presented with exactly that question.
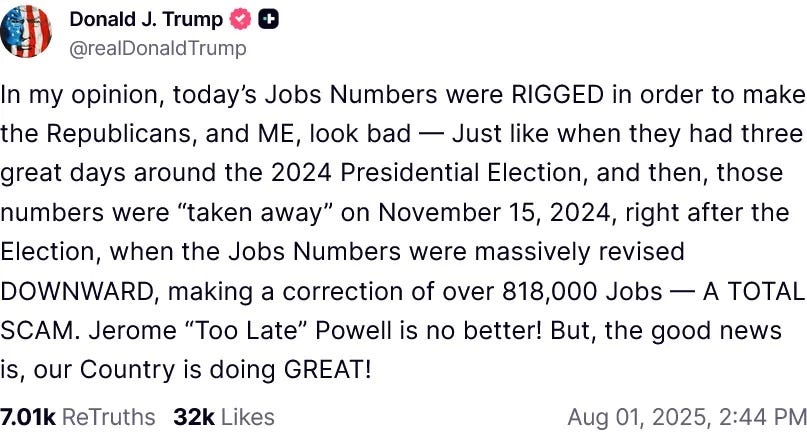
Posting on Truth Social, Trump alleged the BLS under Dr. McEntarfer “rigged” the jobs numbers.
Longtime readers will know I have not had good things to say about the quality of the BLS data for several years. While there had been some hope earlier in the year that the BLS was doing better with data collection, recent job reports have extinguished that hope altogether.
Still, there is quite a bit of difference between data handling which is merely clueless and data handling which is corrupt. Has the BLS been engaging in politically-motivated manipulations of the jobs data?
Unfortunately, there is no good way to answer that question definitively in either direction. Short of emails or other communications confirming rigged results, we are not going to have absolute proof of political gamesmanship at the BLS.
However, when we look at the data, we are forced to conclude that political gamesmanship is not the outrageous claim it first might seem. While it is far short of “smoking gun” evidence of political bias, that data proves that “something” has been very wrong at the BLS for quite some time.
Contents
Household Survey vs Establishment Survey
While the media commentary on the Employment Situation Summary reports focuses on a single “jobs created” metric, the complete report itself is the combination of two independently constructed surveys by the BLS: The Current Population Survey (the Household Survey) and The Current Employment Statistics survey (the Establishment Survey).
The Household survey looks at America’s labor market from the perspective of the labor force itself—i.e., how many people are actually employed.
The Establishment survey looks at America’s labor market from the perspective of how businesses are utilizing that labor force—i.e., how many jobs there are for people to fill.
In theory, both surveys should show broadly the same trends, because both surveys are surveys of the same labor markets. The leading indicator that we are looking at anomalous data—what I have labeled “Lou Costello Labor Math” in homage to the vaudevillian absurdity some of the jobs reports contain—is when the trends within the Household Survey and the Establishment Survey deviate significantly.
As I noted the other day, pre-COVID, the two surveys (as well as the companion ADP National Employment Report) showed broadly similar trends.
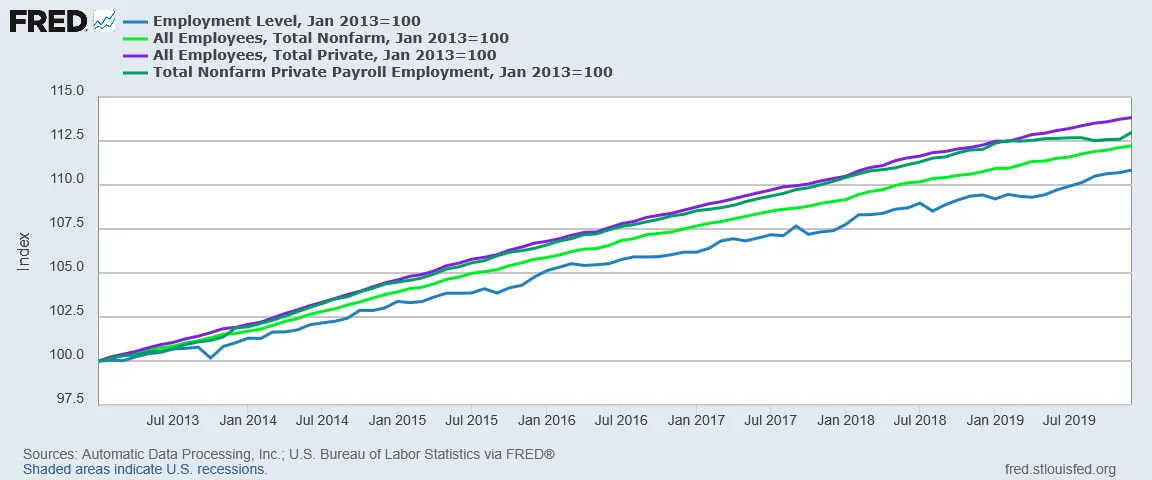
Post-COVID, the Employment Level—the leading metric from the Household Survey—showed extensive flat-lining where there was minimal or no job growth that was not seen in the All Employees Metric from the Establishment Survey.
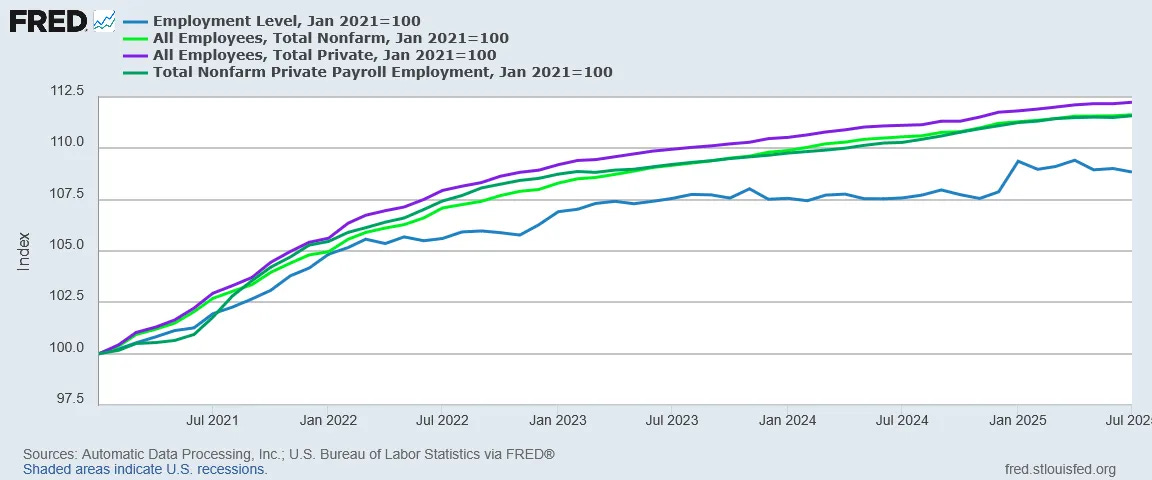
Since January, the Employment Level has actually declined, a signal that is nowhere to be found in the Establishment survey.
While this does not support a charge of political gamesmanship, it is the most obvious proof that the data itself is in some fashion tainted. While we would not expect the two surveys to move in complete lockstep with one another, extended significant deviations should not happen. We should expect that a change in the number of employed individuals within America’s workforce will approximate the change in the number of jobs at America’s businesses.
Post-COVID, there have been multiple months where that simply was not the case.
JOLTS vs Establishment Survey
The BLS produces a third independent survey of America’s labor markets each month, the Job Openings and Labor Turnover Survey. This survey focuses on labor market dynamics—how many people are being hired vs how many people are being separated from their jobs.
While an independent survey focused on changes within labor markets, the JOLTS data is still a perspective on the same labor markets, and so we should expect a high degree of correlation with the other jobs data. Specifically, we should expect that the net hiring reported in the monthly JOLTS data (monthly hires less monthly separations) approximates the change in the All Employees metric from the Establishment Survey.
Pre-COVID, this was absolutely the case.
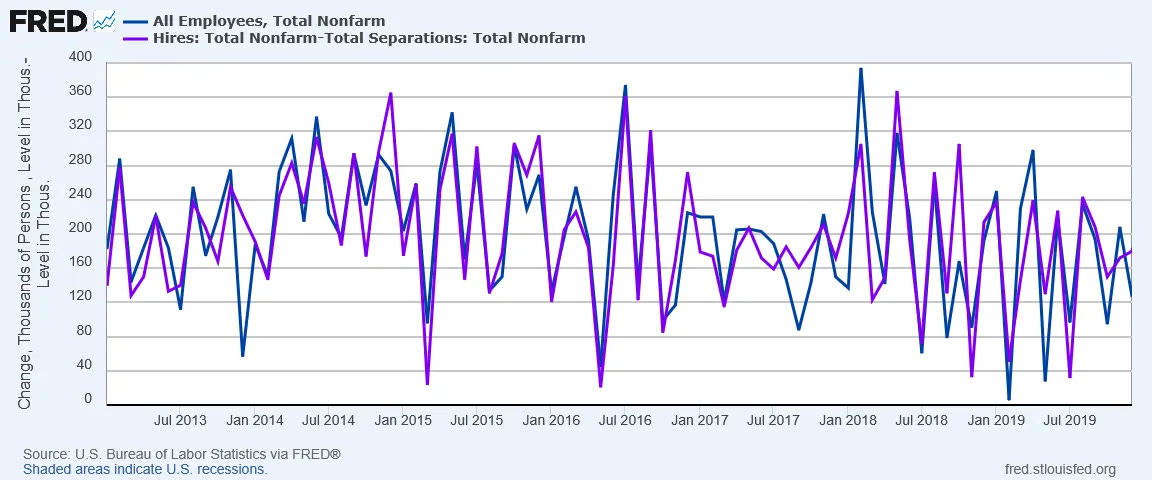
Post-COVID through 2024, this was broadly the case.
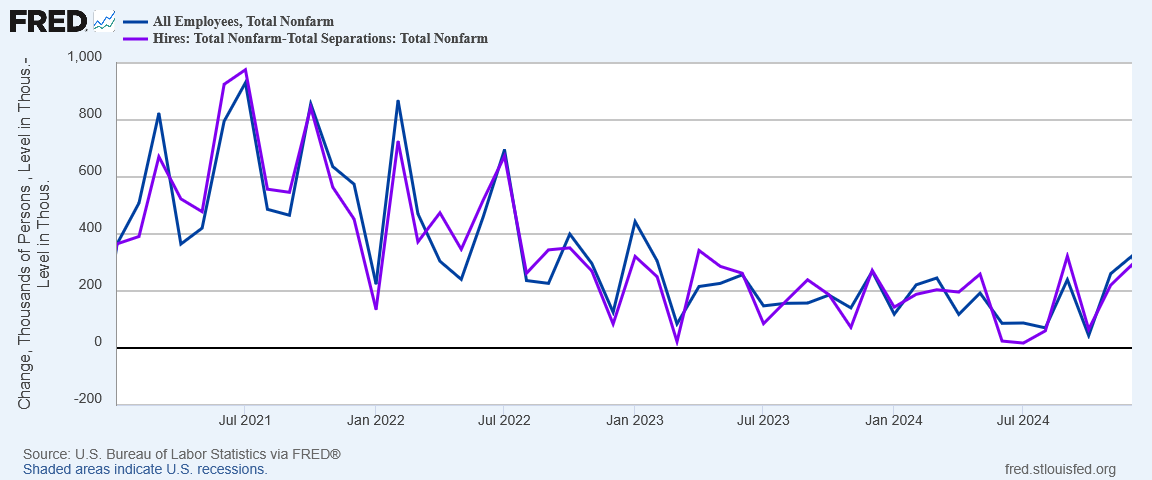
Starting this year, however, that changed.
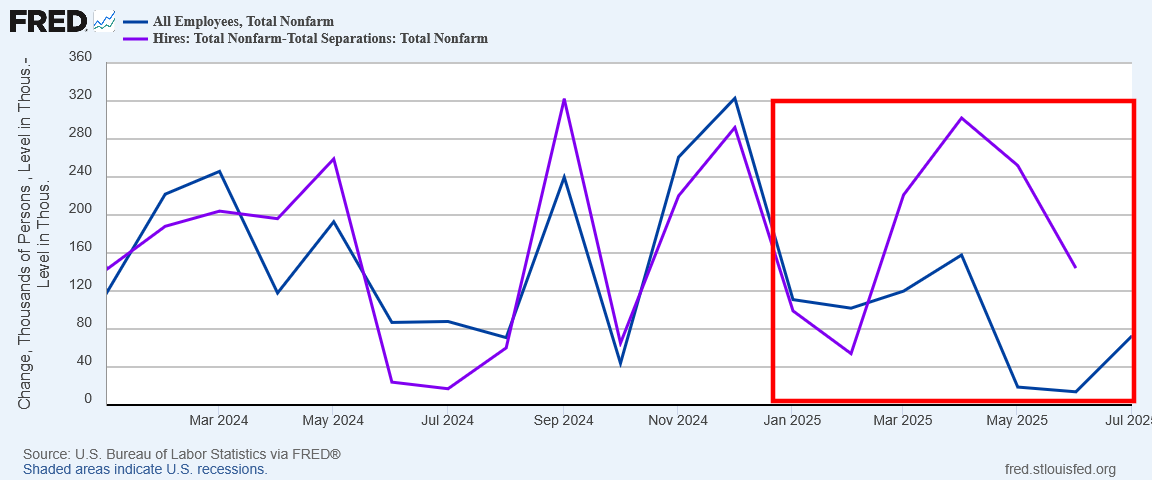
According to the Establishment Survey, 2.012 million jobs were created in the US during 2024. According to the JOLTS data, there were 1.99 million net hires. That is a variance of just over 1%—well within acceptable margins of error.
In the first six months of 2025, the Establishment Survey shows 524,000 jobs created. Over that same period, the JOLTS data shows net hiring of 1.072 million. The JOLTS data is reporting double the job growth of the Establishment survey.
That. Does. Not. Happen.
Even when there have been outsized revisions to the Establishment Survey data, we have not seen a variance that large. The last time there was a revision greater than 100,000 jobs to the Establishment Survey was December 2023. If we look at 2021 through 2023 net of all revisions, we do not see anything remotely like what we are seeing in 2025.
Once again, we see that “something” is very wrong with the data. Either the JOLTS data is wrong, the Establishment Survey is wrong, or (quite possibly) both are significantly wrong.
Disturbingly, the JOLTS data also is what suggests that political bias may be a factor. Without political bias, it is a most remarkable coincidence that the JOLTS data departed from the Establishment Survey just as Donald Trump took office. The JOLTS data does not prove political bias or political motivation, but there is no denying that it is suggestive of bias.
Revisions Run Amok
All of the jobs data is gathered through surveys. As such, we should expect some revisions to the data from late-arriving results. This is what produces the revisions to the All Employees metric in the two months subsequent to any Employment Situation Summary report.
However, there are revisions and then there are “revisions”. Thus far in 2025, we have seen three of the largest net monthly revisions over the past two years.
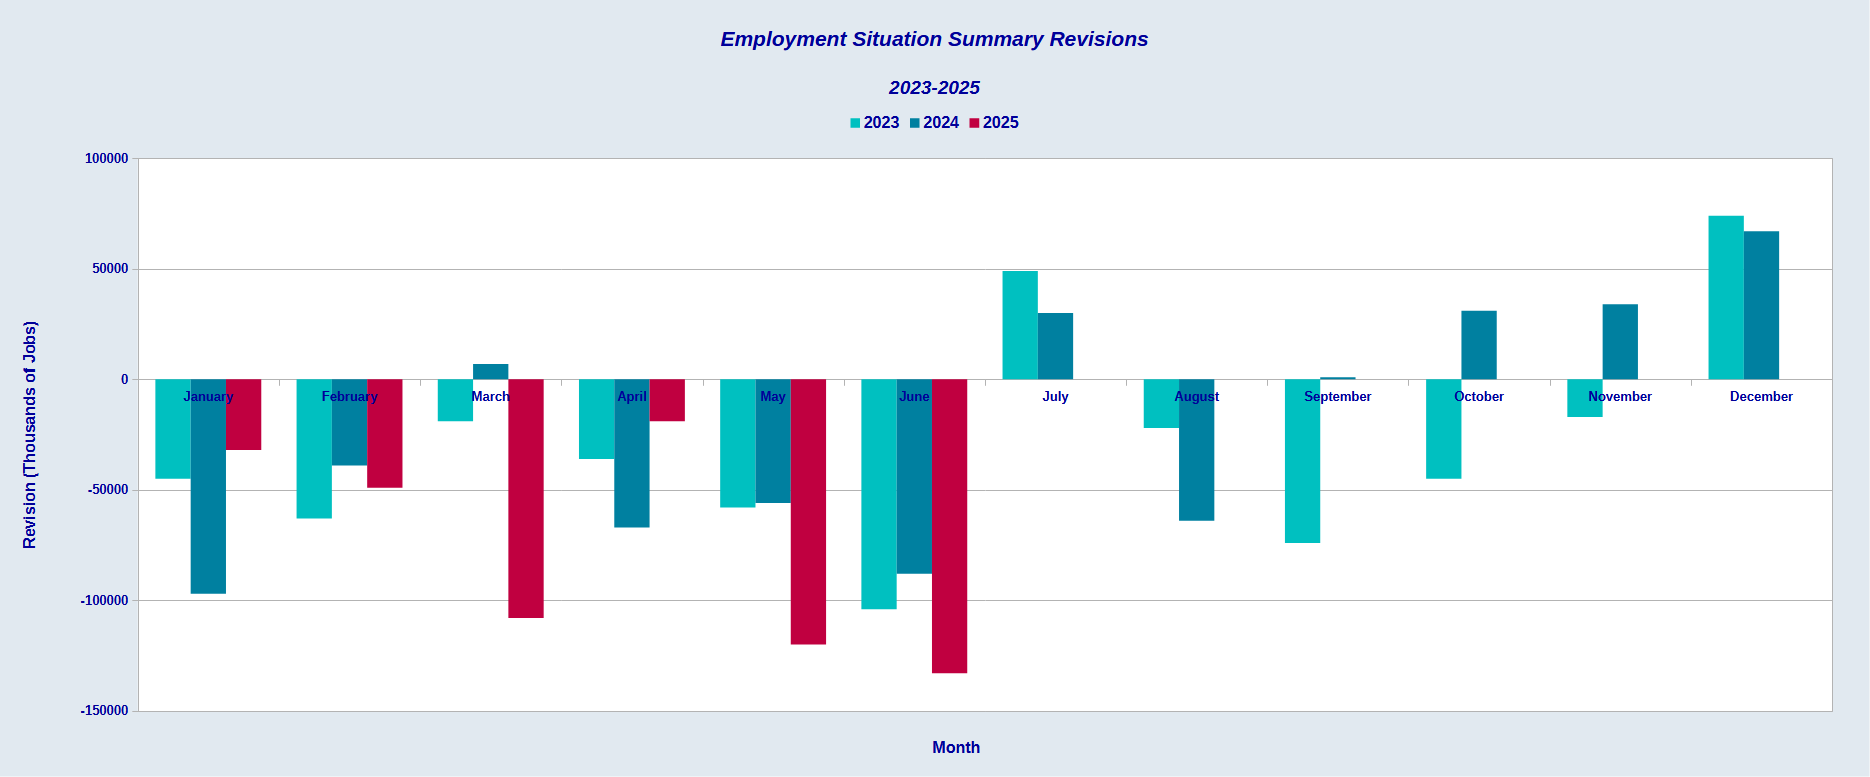
That much sampling error in that short a period of time is conclusive proof that, at the very least, the data collection methods are severely flawed.
Nor are the monthly revisions the only reason to be alarmed at the magnitude of error found within the Establishment Survey.
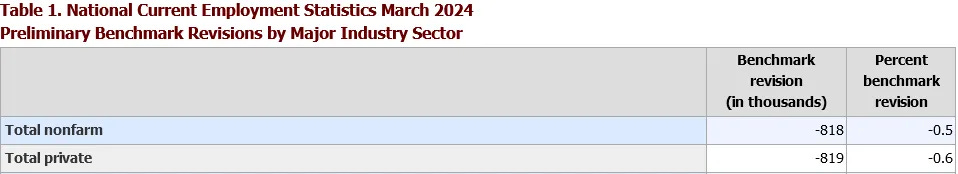
Every year the BLS uses data from its Quarterly Census of Employment and Wages to revise its benchmarks for the Employment Situation Summary.
In 2024, this resulted in overall employment in the US being reduced by over 800,000 jobs.

As I noted at the time, that revision was five times as large as the “normal” revision.
Last December, the Philadelphia Federal Reserve concluded that, during the second quarter of 2024, the US lost jobs.

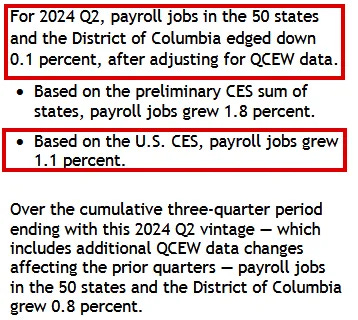
Even without the formal analyses and revisions of benchmarks, it was apparent at the time that the 2024 data itself was severely tainted.

While none of this proves political bias within the BLS, it does prove that there has been a significant degradation in data quality in recent years.
Correlation With Non-Jobs Data
We have seen in abundance the demonstrable anomalies within the BLS employment data sets.
How well does the BLS jobs data correlate to other economic metrics?
This is one area where manufacturing jobs in particular are helpful. We can easily look at other measures such as industrial production and capacity utilization and see if the long-term trends in those data sets correspond to long-term trends within manufacturing employment.
Certainly, from 2021 through 2024, there was a broad correlation between industrial production and manufacturing employment.
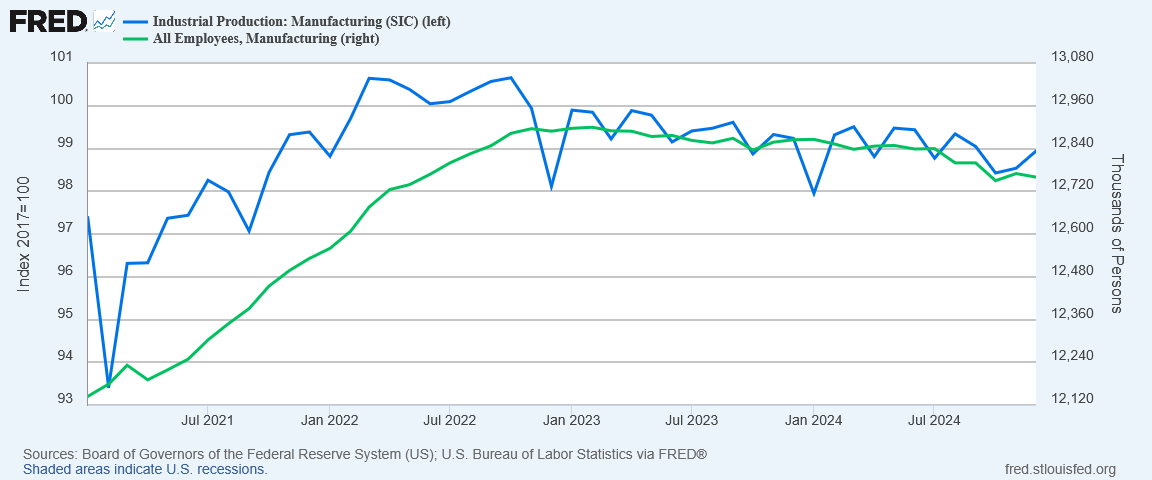
As one measure is an index and the other is a count of people, we should not expect to see an extremely close correlation. However, we do see industrial production increasing in the same time frame that manufacturing employment is increasing, and we see both declining in the same time frames as well.
Once again, however, 2025 is different.
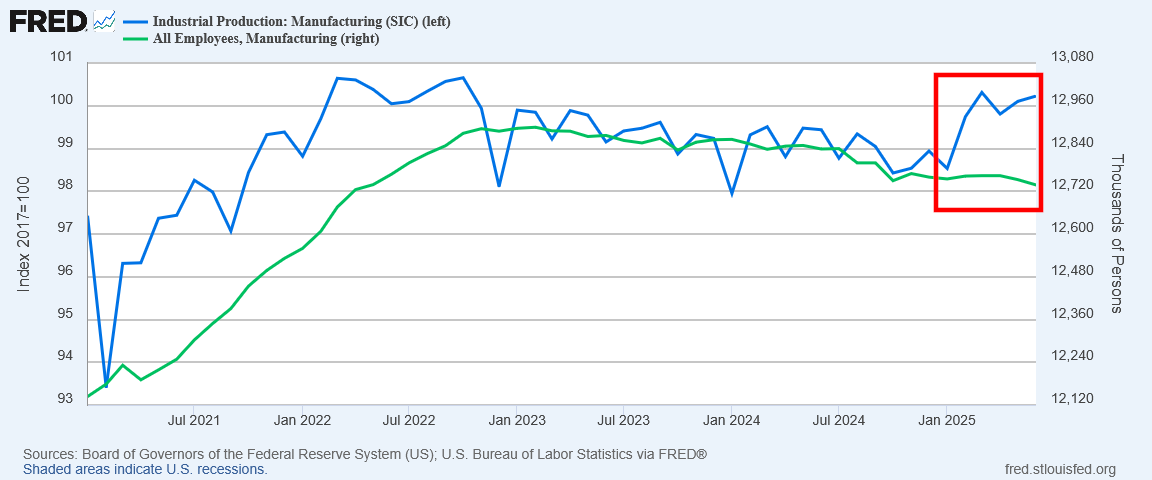
While industrial production surged especially during the first quarter of 2025, presumably manufacturing employment did not, but continued to decline gradually.
This is not impossible, especially given the constant additions of new technologies and innovations to industrial processes, which allow for more production to occur with fewer workers. It is, however, unusual that a major uptick in industrial production would not see any corresponding increase in manufacturing employment.
Such deviations are not entirely unprecedented. In 2022 there was a significant drop in capacity utilization that was not matched by a corresponding drop in manufacturing employment.
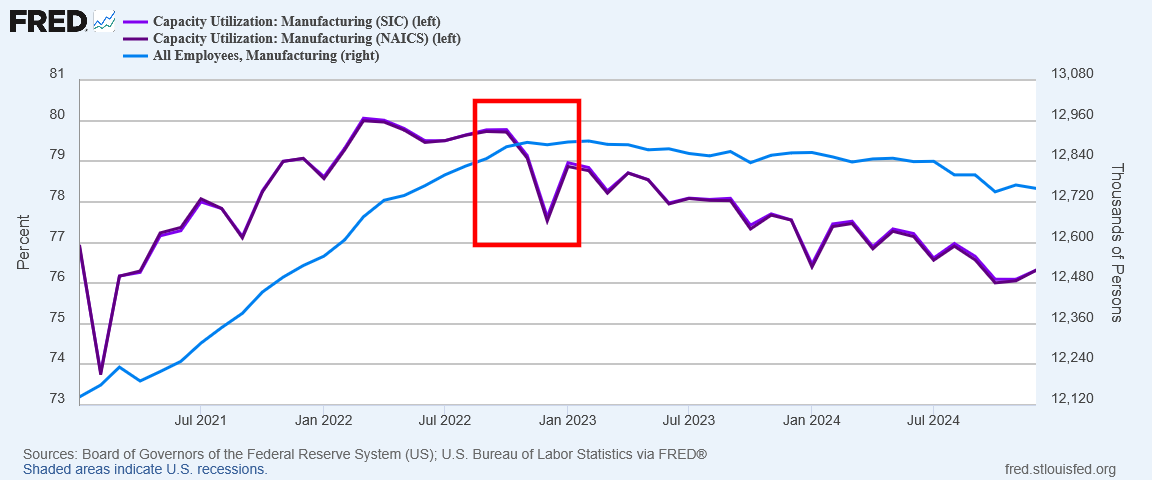
However, despite that variance in trends, after that drop capacity utilization and manufacturing employment both trend down slightly.
2025 has been a repeat of that variance.
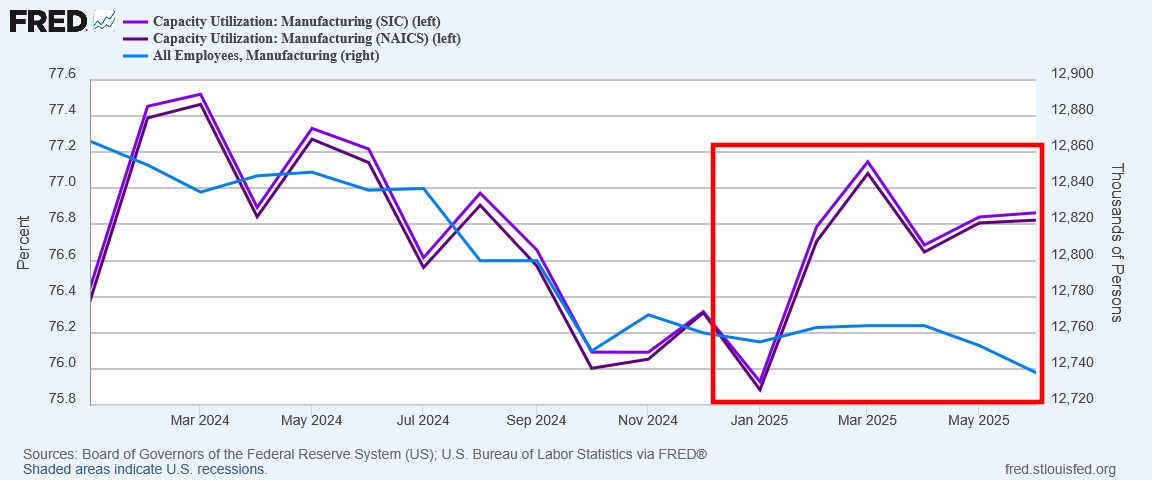
Unlike in 2022, however, where the trends began to realign after four months, we are now in the sixth month of trend variance for 2025.
Both industrial production and capacity utilization show significant improvement in 2025, yet manufacturing employment has presumably continued to decline. This is not unprecedented and certainly not impossible, but it is a most extraordinary coincidence that this variance emerged just as Donald Trump assumed office.
Ironically, if the Federal Reserve wanted data to justify holding interest rates at their current levels, the industrial production data would be just the data set to do that. It is possible that the political bias is not at the BLS (or not just at the BLS), but is rather at the Federal Reserve.
Consequently, we should not be blind to the possibility that the errors are in the industrial production and capacity utilization data. While the Fed’s industrial production data shows manufacturing improvement, the Institute for Supply Management’s Manufacturing Purchaser’s Management Index does not.
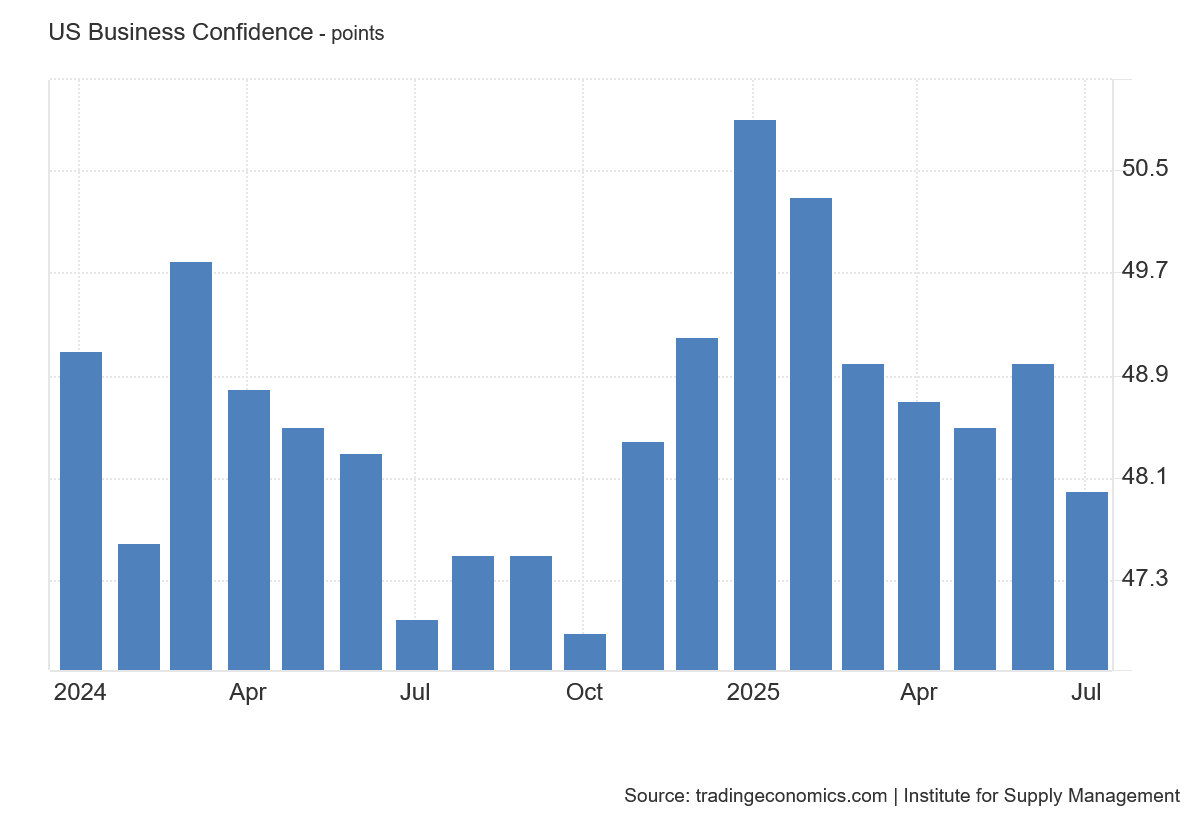
The ISM’s manufacturing employment PMI actually supports the BLS manufacturing jobs downward trend.
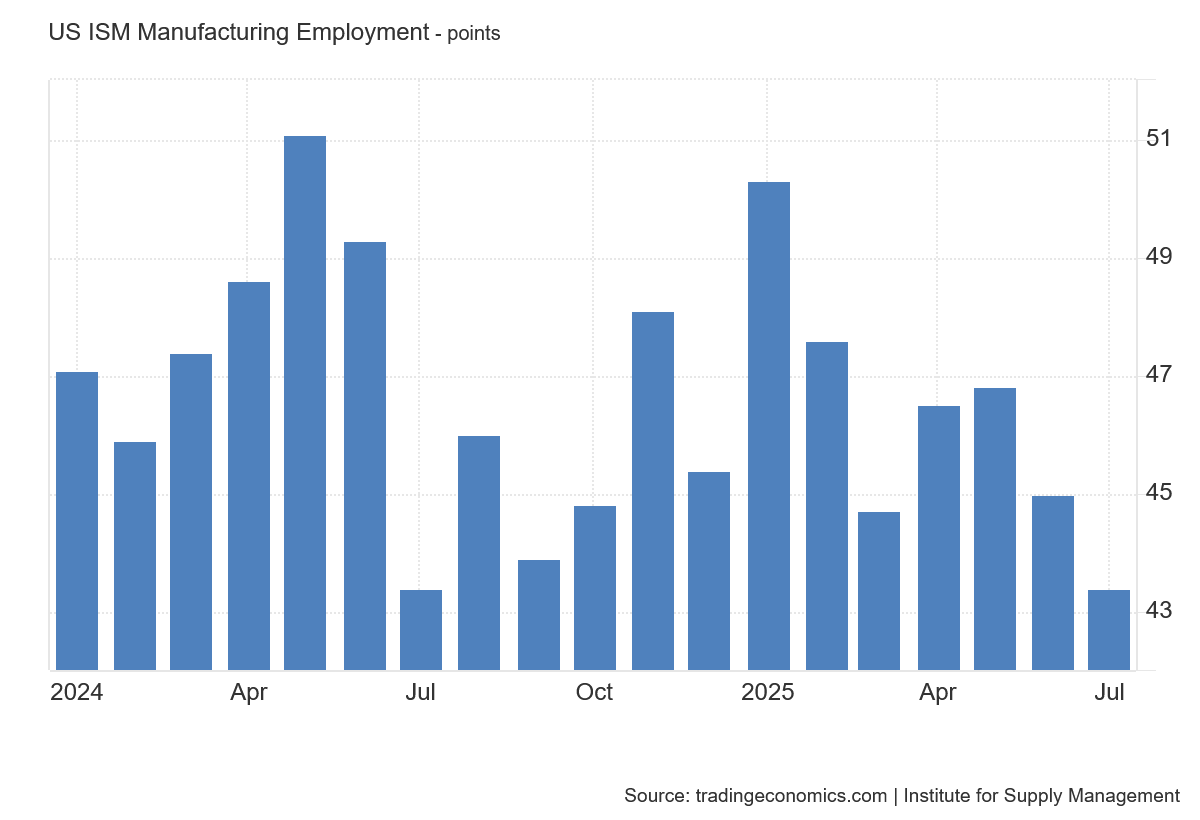
Perversely, the one point on which both the ISM data and the BLS data agree is that US manufacturing is far from healthy at the moment. Considerable manufacturing growth needs to occur before the manufacturing sector can be considered even restored, much less growing.
What Does The Data Actually Say?
The great challenge with all economic data is that it is inherently imperfect. There are inaccuracies in measurement. There are gaps in reporting. There are innumerable opportunities for errors throughout every data collection process.
Somehow, we must find a way to make sense of the data despite the imperfections.
The surest way to do so is to focus on the longer-term trends. So long as data methodologies are consistent, the impact of point-in-time errors will be minimized when looking at the longer-term growth trends. For example, if job growth is consistently overstated by one thousand jobs each month, that overstatement cancels out when viewing the trend over a number of months or even years.
Another approach is to correlate disparate data sets, hence my use of the ISM PMI data. Where independent data sets show complimentary trends, we can approach all such data sets with a higher degree of confidence than if they did not.
As a practical matter, is considerably more difficult to force independent data sets into alignment. While political bias remains a possibility, its impacts are likely to be considerably less than President Trump and others have implied.
With these thoughts in mind, even with the internal flaws within the BLS jobs data sets, we see enough correlation especially in manufacturing jobs to have confidence that the data is not completely misleading us when it points to an ongoing and even intensifying jobs recession.
In that regard, the BLS jobs data is likely not biased, but is merely inconvenient for Donald Trump. A major part of his approach to the Presidency has been to “sell” to the American electorate not just his economic policies, but that those policies are in fact working. The BLS jobs data suggests that his policies quite probably are not working as well as he would like people to believe. The BLS jobs data certainly suggests that his policies have yet to address structural deficiencies within the US economy, most notably a stagnant and declining manufacturing sector.
Note that this is an observation and not a criticism of Donald Trump. It is the nature of electoral politics that politicians are constantly striving to persuade voters that they are moving things in a positive direction. Donald Trump would not be doing his job if he were not advocating at every turn for his policies.
Still, the requirement that Trump “sell” his Presidency to the public this way also requires us to look critically at the numbers, so that we may look past the expected advocacy to gauge what has worked well, what has not worked well, and what has yet to produce conclusive results.
President Trump will always make the case that the economy is “booming” under his stewardship. A number of economic indicators, including the BLS jobs data, suggests that the economy is not doing quite that well.
We need to take the indicators with several grains of salt, however. It is quite possible for the indicators to be wrong and for Donald Trump to be right about the state of the US economy. It is even more possible for both the indicators and Donald Trump to be somewhat inaccurate, with both either overstating or understating economic realities.
Is the US economy in a true “golden age” of prosperity? Almost certainly not.
Is the US economy on the brink of a major depression? Again, almost certainly not.
Is the US economy close to slipping into a cycle of stagflation and recession? Quite possibly.
Would it be easier to ascertain the true state of the economy if the BLS put out better data? Absolutely.
This is where Dr. Erika McEntarfer failed as head of the BLS. Politics aside, her job was to ensure that the BLS was producing quality reports and quality data sets. She clearly did not do that, even if the data the BLS has produced is “good enough” for broad trend analyses.
We cannot rule out political bias on her part regarding her stewardship of the Bureau of Labor Statistics, but we do not need to prove political bias to show that she failed to do her job as well as it needed to be done.
Her termination was in fact long overdue.
Great article shedding light on a subject!
Comes down to "who do you believe?"
The background really helps.
Good article and explanation. Will be linking as usual @https://nothingnewunderthesun2016.com/
Also, just curious, no proverb this week. Always look forward to them on Sunday!