Producer Price Index Shows What Lies Ahead
Inflation Here, Deflation There, Stagflation Everywhere
As detailed yesterday, the recent rises in energy prices has reversed the disinflationary trend that had been seen in the Consumer Price Index, bringing rising inflation back to the fore.
With the Bureau of Labor Statistics releasing the August Producer Price Index Summary, we can also see that the economic future is a devilish mix of inflation and deflation—stagflation by any other name.
The Producer Price Index for final demand increased 0.7 percent in August, seasonally adjusted, after rising 0.4 percent in July, the U.S. Bureau of Labor Statistics reported today. (See table A.) The August advance is the largest increase in final demand prices since moving up 0.9 percent in June 2022. On an unadjusted basis, the index for final demand rose 1.6 percent for the 12 months ended in August.
Even though factory gate prices rose more than expected in August, the increases were not spread across all parts of the economy. As has been increasingly the case, some producer prices rose significantly, while others rose just a little, and a few even fell.
In August, 80 percent of the rise in final demand prices is attributable to a 2.0-percent jump in the index for final demand goods. Prices for final demand services advanced 0.2 percent.
The index for final demand less foods, energy, and trade services increased 0.3 percent in August, the same as in July. For the 12 months ended in August, prices for final demand less foods, energy, and trade services rose 3.0 percent, the largest advance since moving up 3.4 percent for the 12 months ended in April.
With inflation and deflation sitting side by side in the data, the US economy’s future is clear: stagflation.
As we can see when we compare factory gate prices for energy with consumer prices for energy commodities, we immediately see that, year on year, consumer price inflation has been approximatelhy the same as measured by both indices.
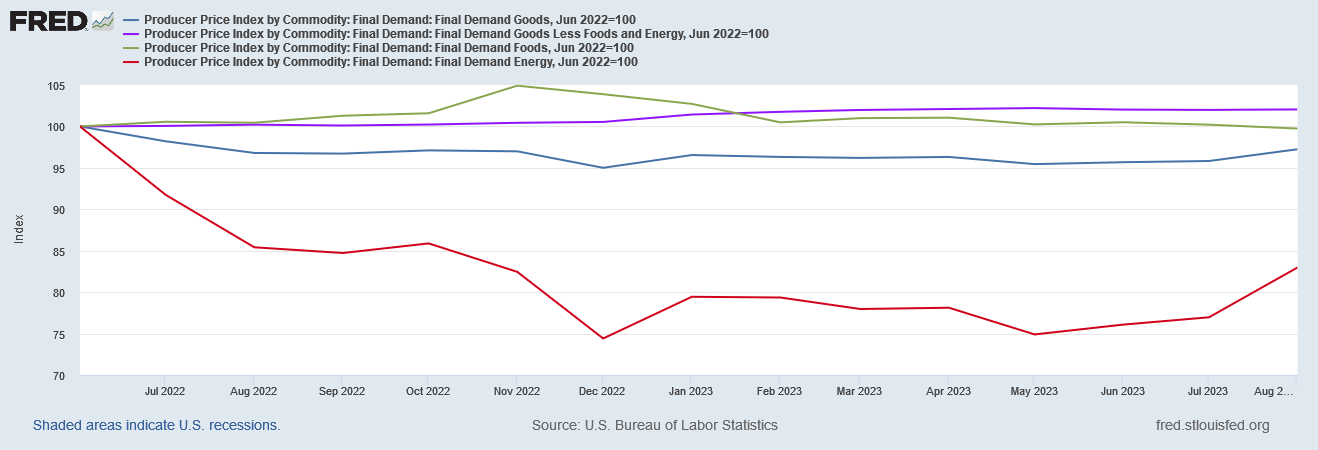
As we might expect when we look at factory gate prices for goods overall, energy price inflation is once again the dominant component.
Even energy price deflation has dominated factory gate goods prices since June of last year, creating deflation in the overall goods subindex even as factory gate prices for goods less food and energy still rose by more than 2%.
That dominance of energy in overall goods pricing leads to the first indicator of stagflation in the US economy.
When we take off the charts for energy and food prices, we see that core goods prices have more or less plateaued since March.
Outside of the typically more volatile food and energy categories, demand for goods is softening in the US. People are generally buying less “stuff”.
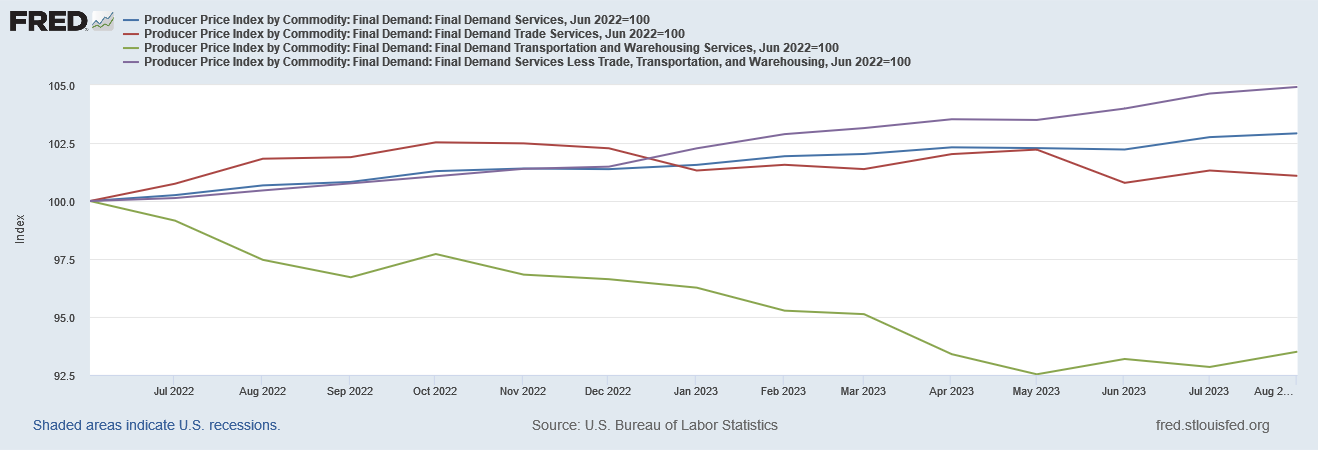
The ipact of energy price inflation shows up in factory gate prices for services as well.
When we look at a breakdown of services categories within the Producer Price Index, we see not only that Transportation plays an outsized role much like energy prices within the goods categories, the price trajectory for Transportation largely resembles that for energy.
While the magnitudes of the rises and falls within Energy and Transportation are different, with Transporation being far more muted, the timing of each lines up very well, as we can see if we overlay the charts using separate axes.
What is different about the services category overall, however, is that the easing of energy prices has not led to a significant softening of demand for services outside of the volatile Transportation and Trade categories.
Even though factory gate prices for services overall has eased, that easing corresponds to the price deflation seen in the Transportation and Trade categories. Other services are not showing the same softening of demand that we see among goods outside of food and energy.
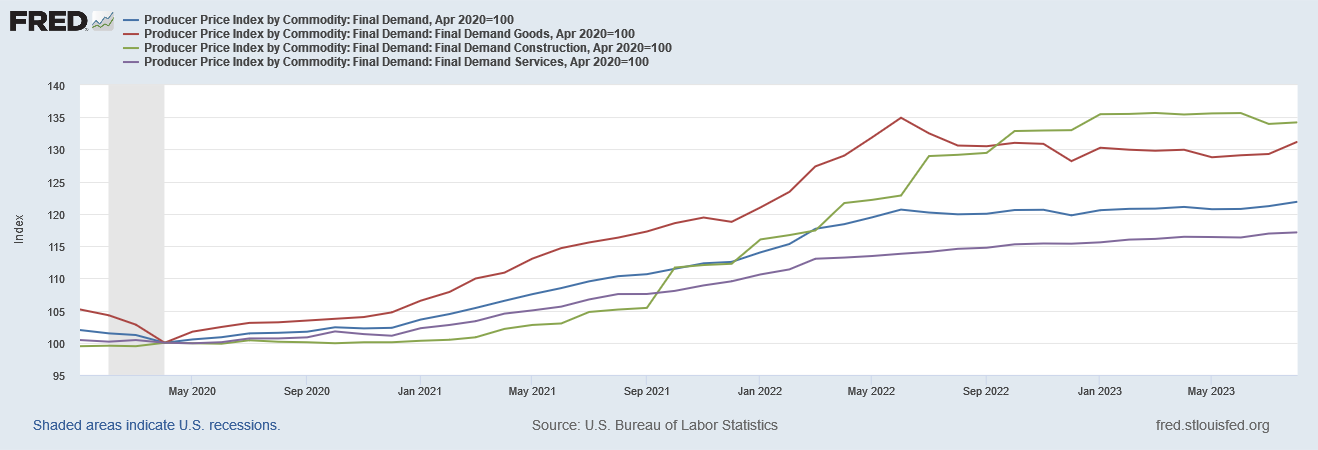
One area where prices have definitively reached a plateau is construction. There, no one sub-category is dominant, with all more or less following the same general trajectory.
However, what all the various trajectories show is a price plateau begining during last fall and continuing through last month.
When we look at the year on year inflation graphs for construction prices, we see the rise of inflation and its subsequent fall in every category.
If the trends hold, over the next few months we should see inflation within construction fall to below 2% as it was during 2020. Even without that final drop-off we still have considerable softening of demand for construction-related items since last summer.
Overall, at the factory gate price level of demand, we have price levels for the goods category largely following the price of oil and energy products—which implies fairly soft demand outside of energy products—while construction demand is already softening across all subcategories, and only service price levels remaining on a definite upward trend that is independent of energy prices.
When inflation and strong demand coexists with deflation and soft demand, those are the broad parameters for stagflation, and stagflation is exactly what we have within the US economy. Demand for goods has softened significantly outside of energy, demand for construction has softened across the entire category, with demand for services proving to be fairly resilient.
As producer prices are widely regarded as a leading indicator for consumer prices, we can plausibly expect the stagflationary price trends within the Producer Price Index will be reflected within the Consumer Price Index over the next few months. The imbalances between goods and services demand, between goods and construction prices on the one hand and service prices on the other, are likely to continue for at least a little while longer.
Regardless of the optimistic and even hopeful tenor of the corporate media narratives on inflation, what the Producer Price Index data is showing is what lies ahead, and what lies ahead is not a return to consumer price inflation below 2%. Rather, what lies ahead is structurally high inflation, aggrevated by structurally high energy prices. What lies ahead is a stagflationary economic situation where high levels of consumer price inflation become embedded and thus impervious to the Federal Reserve’s monetary machinations designed to manipulate and reduce inflation. The most aggressive series of Federal Reserve rate hikes in decades has failed to provide meaningful sustained relief from inflation.
What lies ahead is consumer price inflation that will completely ignore the Federal Reserve’s federal funds rate hikes intended to push up market interest rates broadly, punctuating the Fed’s complete failure to corral and reduce inflation. Get used to higher inflation—it’s going to be with us a while.


Painful at the stores, waiting for the markets reflect the reality of inflation ?