Rent Inflation Shows How Off Kilter Our Economy Has Become
Distortion And Disruption Are The Legacy Of The 2020 Pandemic Panic
One thesis I have argued several times is that the real harm of inflation lies in the way it distorts an economy and disrupts the relative prices of various goods and services. The economic fallout from the Pandemic Panic and resulting lunatic lockdowns I believe comes primarily from the shredding of pricing relationships.
Adding to the distortion is the contradictory and in many respects irrational narratives we have on what inflation is and how much inflation we really have, leading to misidentification of inflation’s origins.
The “experts” generate far more confusion than clarity where inflation is concerned. Nowhere is this more true than when discussing shelter price inflation. Between rent and housing, inflation indices vary widely.
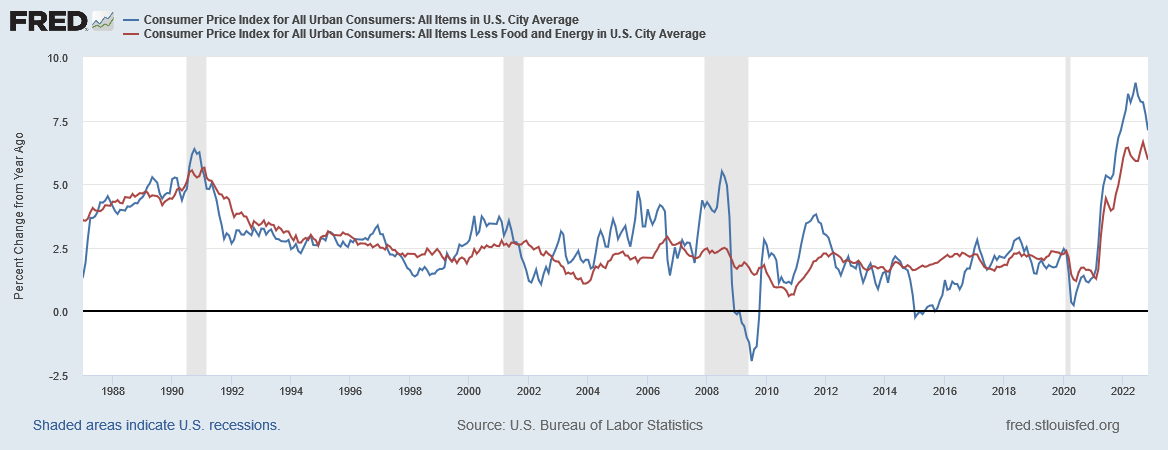
To appreciate the degree of chaos and confusion, we must first remember that the “inflation” number that gets bandied about most often by the corporate media is the year on year percentage change in the Consumer Price Index, which is then presented as the benchmark for consumer price inflation—I generally refer to it as headline consumer price inflation. As anyone who pays any attention at all to their shopping bills already knows, high consumer inflation is a major problem for consumers at this time. However, headline consumer price inflation is not the only inflation metric that we have.
Because headline consumer price inflation includes a number of highly volatile categories of consumer goods and services, economists frequently filter out inflation for food and energy items to get a view of “core” consumer price inflation—headline CPI less food and energy. Without the input of food and energy price inflation, “core” consumer price inflation is not only lower at the present time, but it shows much less variance and volatility than headline inflation. Presumably this makes “core” consumer price inflation a better metric for understanding how much “real” inflation we have; more likely it is a convenient way for government policy wonks to argue that inflation is not as bad as people think it is.
However, the variances between headline and core consumer price inflation begin to illustrate the distortive effects inflation has on an economy.
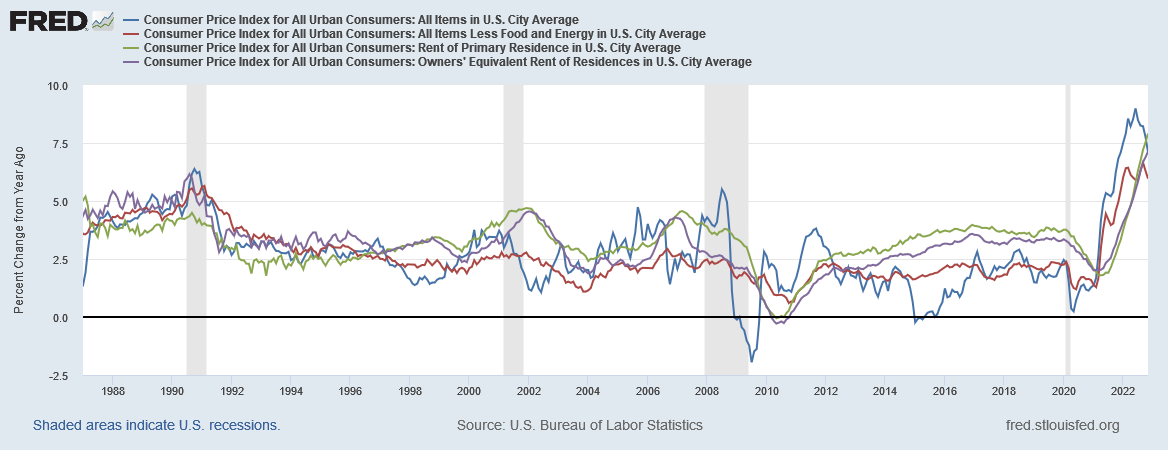
Moreover, even within core consumer price inflation there are categories of goods and services which are also potentially distortive, not the least of which are the various metrics for tracking shelter price inflation. The two principal metrics for this category of consumer price inflation are the “Rent of Primary Residence” and the “Owner Equivalent Rent” indices. When overlaid with headline and core consumer price inflation we see that shelter price inflation is another distortive category of price rises.
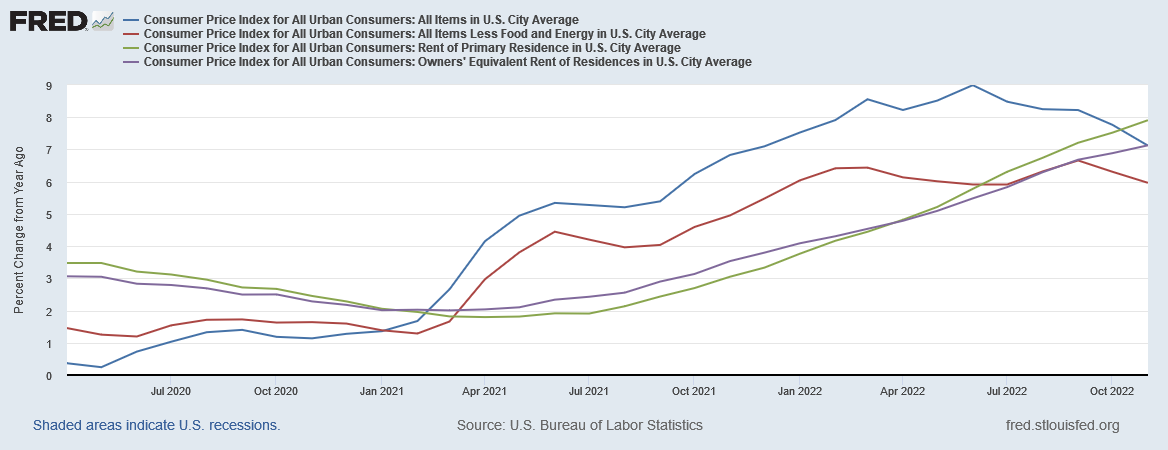
For much of the decade prior to the Pandemic Panic and recession of 2020, these two shelter price inflation metrics outpaced even headline consumer price inflation, before trending down after the recession and throughout the fall of 2020 and the spring of 2021, only to rise again heading into 2022.
How is it that shelter price inflation is rising while both core and headline consumer price inflation are falling? If shelter price inflation feeds into consumer prce inflation shouldn’t rising costs for shelter result in rising prices for everything else? Shouldn’t consumer price inflation be rising as well?
The short answer is “no.” The longer answer is that shelter prices enjoy different dynamics than other consumer goods, in part because people rarely pay their rent month by month, but sign a lease for six months or a year at a time, locking in a particular rent price, then adapting to a rent increase upon lease renewal—or alternatively shopping for new shelter and signing a new lease somewhere else.
A recent working paper by the Cleveland Federal Reserve1 explores these disparate dynamics and the influence they have on existing shelter price indices as well as headline consumer price inflation.
Prominent rent growth indices often give strikingly different measurements of rent inflation. We create new indices from Bureau of Labor Statistics (BLS) rent microdata using a repeat-rent index methodology and show that this discrepancy is almost entirely explained by differences in rent growth for new tenants relative to the average rent growth for all tenants. Rent inflation for new tenants leads the official BLS rent inflation by four quarters. As rent is the largest component of the consumer price index, this has implications for our understanding of aggregate inflation dynamics and guiding monetary policy.
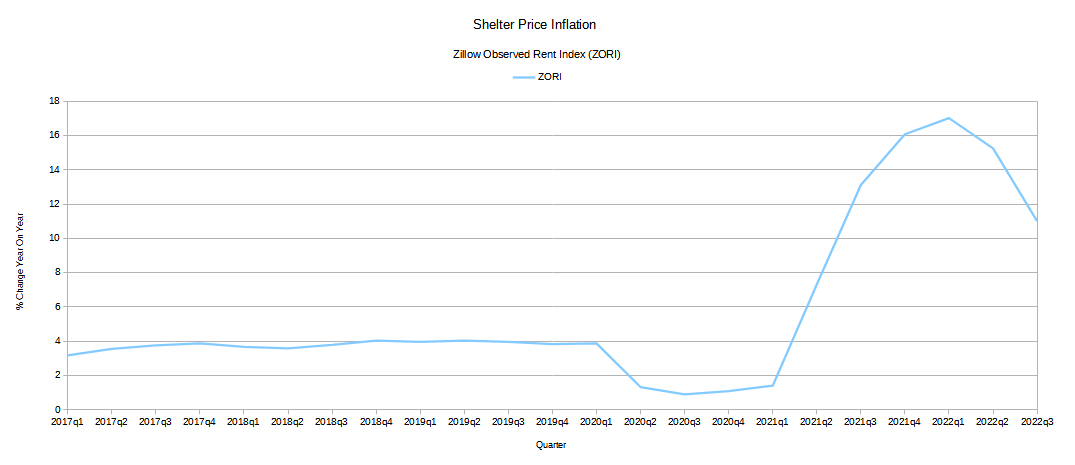
One of the most glaring variances among rent indices is that between the “official” CPI metrics and private-sector measurements. As the Cleveland Fed research team notes, if instead of the government standard “Rent of Primary Residence”, the Zillow Observed Rent Index were used to incorporate shelter price inflation into headline inflation, during May of this year headline inflation would have been at an all-time high.
If the Zillow reading were to replace the official CPI rent measure, then the 12-monthheadline May 2022 CPI reading of 8.6 percent would have been over 3 percentage points higher.
However, by the same token, the ZORI metric would have added to headline inflation’s recent declines.
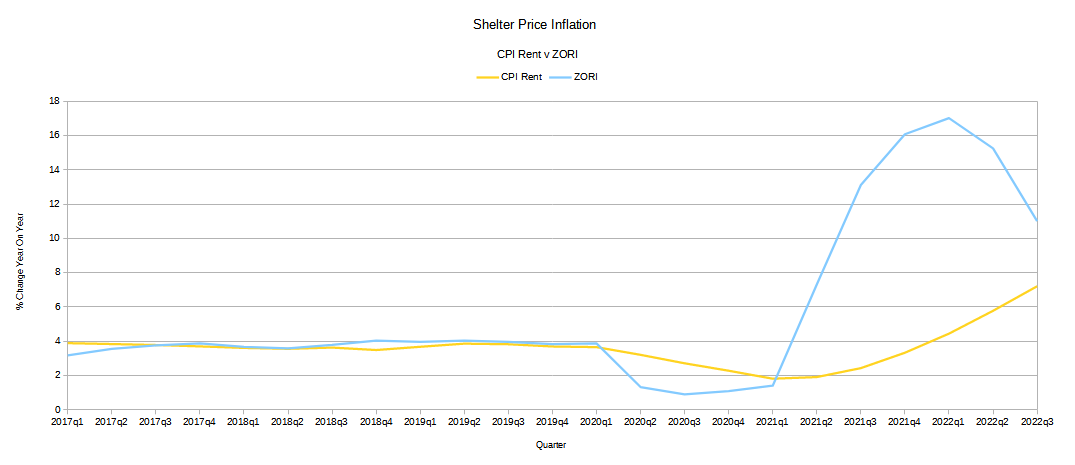
However, when we compare the ZORI metric to the BLS’ “Rent of Primary Residence”, termed “CPI Rent” in the Cleveland Fed Paper, we see that, prior to 2020, ZORI and the BLS metrics largely tracked each other, whereas after 2020 ZORI diverges wildly.
To be sure, the CPI Rent shows a decline, although not quite as severe as the ZORI decline, and does not bottom out until nearly a year after ZORI. Similarly, ZORI is declining at the present time while CPI Rent is still rising.
There are several factors which go into the variance, but the significant one is that ZORI is calculated from only new leases, whereas CPI Rent is calculated from all leases, both new and repeat, which means CPI Rent captures a broader set of data, but at the expense of articulating the rise in rental rates for new leases, which is usually greater than for repeat leases.
To address these variances, the research team at the Cleveland Fed devised two alternate indices in order to illuminate the dynamics at play.
We use the microdata underlying official measures of rent inflation in the CPI to assess the differences between the CPI rent index and other measures of rent growth. We create several weighted repeat-rent indices in the style of Case and Shiller (1989), such as a weighted new-tenant repeat-rent (NTRR) index (using only leases of tenants who recently moved in), and a weighted all-tenant repeat-rent (ATRR) index (using all tenants, whether they recently moved in or not). These indices allow us to determine whether the differences between CPI rent inflation and alternative measures are due to differences in the representativity of the sample, the scope of the sample, or the methodology employed.
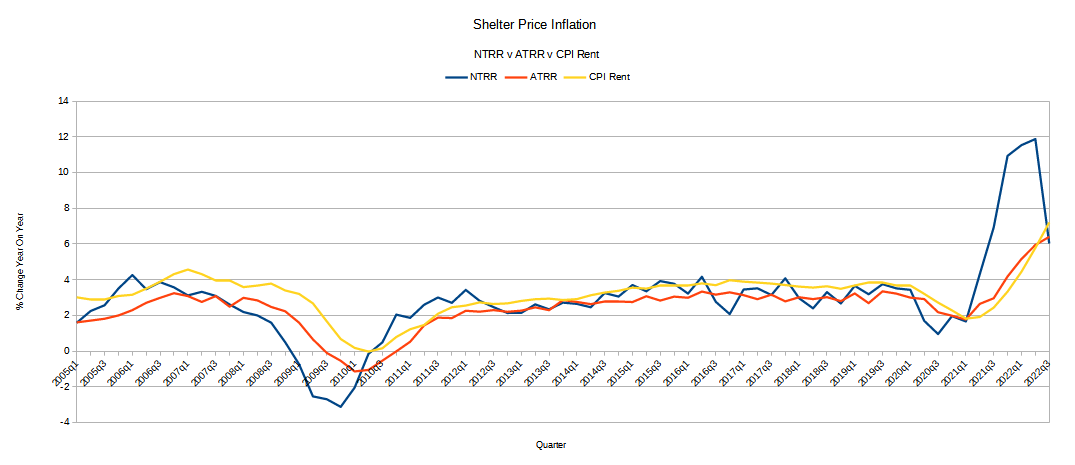
The New Tenant Repeat Rent index tracks very similarly to ZORI, while the All Tenant Repeat Rent index tracks more closely to CPI Rent.
Moreover, prior to 2020, these indices were all fairly close together, making the variances among them largely moot, as regards their influence on inflation.
What the NTRR vs ATRR differences illustrate is the variance between rent inflation for new tenant leases and rent inflation for all tenant leases, including renewal leases.
Which index better captures shelter price inflation? If you’re moving to a new apartment, the NTRR index paints a more accurate picture of rent increases. If you’re simply renewing, the NTRR index likely overstates rent inflation, and the ATRR (as well as CPI Rent) are likely more closer to reality.
Once again, however, we see how inflation distorts things—in “normal” times the variance between inflation for new tenant rates and repeat rates is minimal, and only since 2020 has the variance been extraordinary.
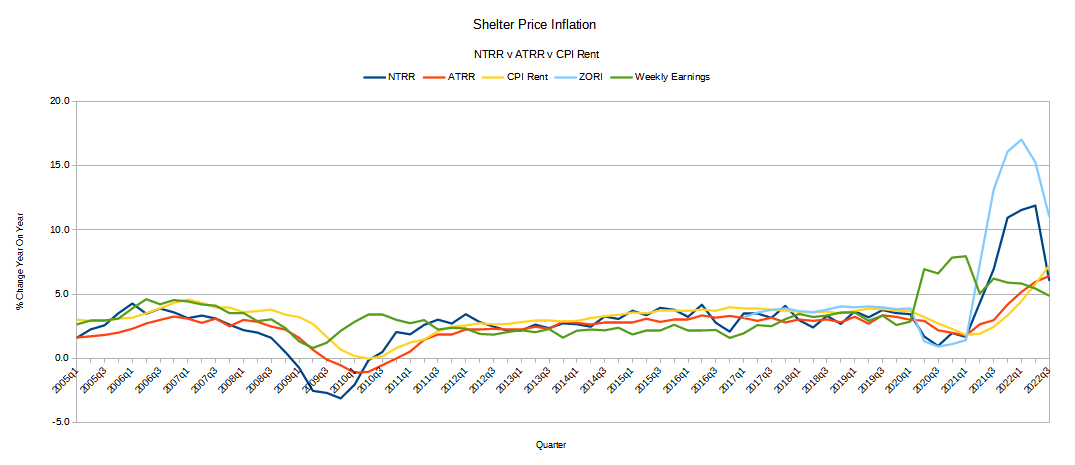
But wait…there’s more! When we look at nominal wage growth alongside shelter price inflation we see how out of balance shelter price inflation has become since 2020.
Prior to 2020, year on year percentage growth for rents—NTRR, ATRR, CPI Rent, and ZORI—largely tracked with nominal wage growth, indicating that, overall, wages and rents were more or less keeping pace with each other2. That ceased to be the case after 2020, and even now wages and rents are demonstrably out of balance with each other—which means economic pain for tenants and landlords alike.
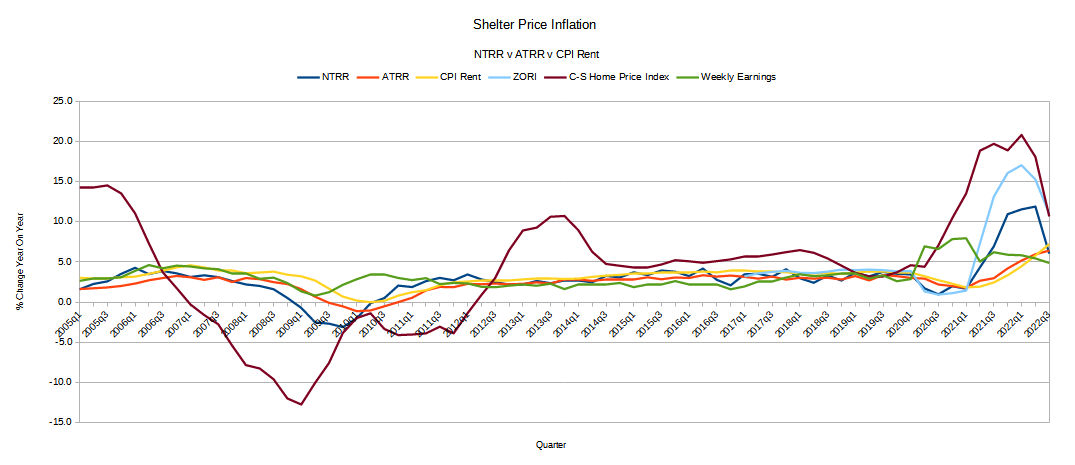
Nor is the damage confined to just rents. If we overlay the Case Shiller Home Price Index, we see that while home prices have been far more volatile prior to 2020, by 2015 an equilibrium was emerging, and by 2019 there was an indication that home price appreciation was coming into alignment with rent increases and nominal wage growth.
While the ideal level of inflation is always zero, an economy is healthy overall if at least the various inflation rates are in rough alignment with each other. If price rises for homes and rent rises more or less match nominal wage growth, the economic pain from inflation is at least minimized.
That alignment has not been seen in the US economy since 2020.
While we should never lose sight of the monetary aspects of inflation, we can better understand the state of the economy as a whole if we realize that a significant portion of the consumer price inflation we are now experiencing is the result of the willful and deliberate upsetting of the economic applecart in 2020. The lunatic lockdowns and all the policies which followed did at least as much to shred pricing relationships as the Fed’s manic money printing.
As the wide variances in rent and shelter price inflation illustrate, we will be paying a steep economic price for the Pandemic Panic for some years to come.
Adams, B., et al. Disentangling Rent Index Differences: Data, Methods, and Scope. 19 Dec. 2022, https://www.clevelandfed.org/publications/working-paper/2022/wp-2238-disentangling-rent-index-differences.
The constant caveat to be applied here is that we are looking at broad metrics encompassing the whole of the United States. Individual cities and individual industries will not necessarily align perfectly with this—your mileage may vary.


