Readers may recall my summary take on government’s January Employment Situation Report as “Lou Costello Math”.
With the May Job Openings and Labor Turnover Summary (JOLTS) Report, I have to wonder if Lou Costello won’t be making a comeback for this Friday’s June Employment Situation Report. Several of the numbers in the report simply do not make sense.
Hiring And Firing Have Been Flat
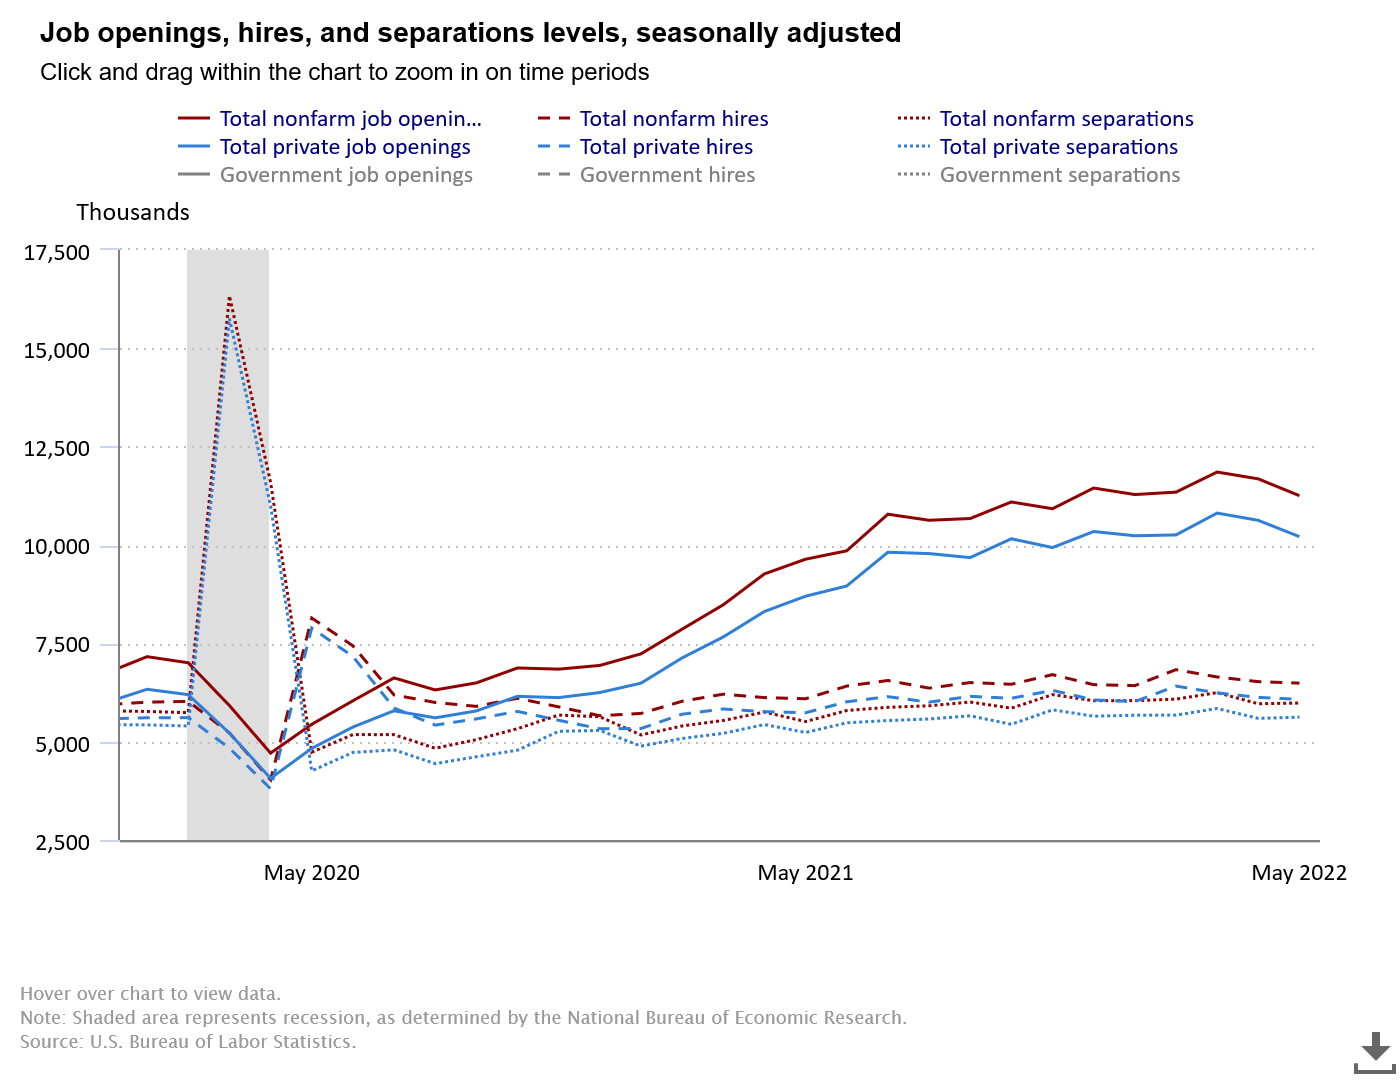
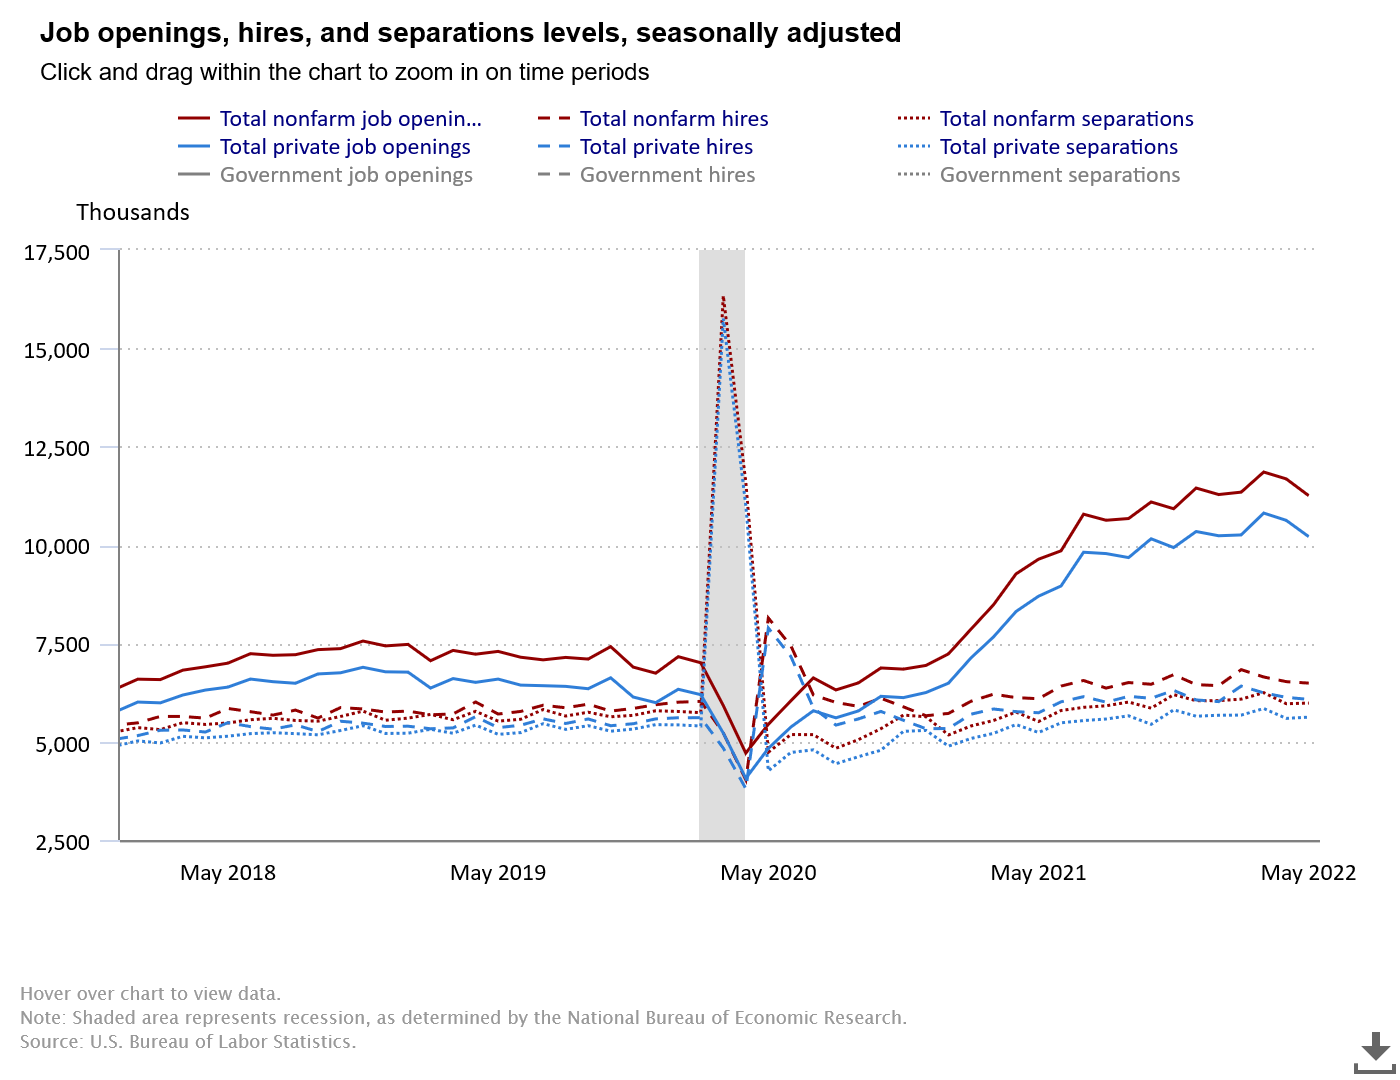
The first and most obvious discordant data is that while job openings have risen steadily after the 2020 government-mandated recession, hiring and firing have remained fairly steady. Despite a seeming overwhelming need to increase headcount at companies across America,
Moreover, the pace of hiring and firing in America does not appear to have significantly altered even post-pandemic. Both trends are fairly horizontal, with just a little increase over time.
Beyond the bizarre inability of businesses to increase their hiring pace to match their job openings, the numbers on the surface do not appear to reconcile to the May Employment Situation Report—itself afflicted with some sketchy numbers.
According the the Employment Situation Report, 390,000 jobs were created in May.
According to the JOLTS Report, May non-farm hirings clocked in at 6.489 million, with non-farm separations coming in at 5.983 million. That’s a difference of 506,000—yet only 390,000 jobs were created?
To make the jobs numbers look even more suspect, this occurred while job openings dropped by 427,000 during May.
Hiring Steady, Firing Steady, Unemployed Also Steady?
One place where the JOLTS report reconciles to the Employment Situation Report is in the number of unemployed individuals. In May the total number of unemployed individuals was approximately 6 million. With fairly steady trends lines for both hiring and separation, that is not implausible.
However, we again come back to the problem of job creation. If hiring is steady, separations are steady, and the number of unemployed individuals is also remaining steady, how were 390,000 new jobs created—and who filled those jobs?
Some of those jobs might be attributable to May’s reduction in the number of people not in the labor force who want a job from 5.859 million to 5.681 million. That is less than the 390,00 jobs presumably created in May as well as the difference between non-farm hires and non-farm separations of 506,000.
As with the Employment Situation Report, the JOLTS Report shows a steady level of unemployment that is difficult to reconcile to reports of job growth
Manufacturing Employment Contracted. Or Did It?
A further odd data point is found in manufacturing employment.
According to the Institute for Supply Management Report On Business for May, the Employment Index shifted into contraction, declining 1.3% from April’s 30.9 to 49.6. That should mean that, in the aggregate, employment in manufacturing declined.
However, while the total number of hires in manufacturing did decline April to May, so did the number of separations. Consequently, net employment for the month only decreased by about 7,000, from 35,000 to 26,000, but remained positive—meaning total employment in manufacturing rose.
Total employment in manufacturing has, according to the BLS data for manufacturing hiring and separations, only declined (negative net employment) three times since the immediate aftermath of the 2020 recession, and has grown slowly but steadily over the 12 months ending in May of this year.
That is not contraction, but expansion. Moreover, while muted relative to the magnitude of 2020 separations during the recession and the recovery of employment in the immediate aftermath, net hiring in manufacturing has exceeded 2019.
As a further disjunction from the ISM survey, the net hiring for May (26,000) is the same as the net hiring for March, when the Employment Index in the ISM report was several points higher, at 56.3.
To be sure, the ISM report is a business survey rather than an analysis of hard data, and thus contains a perceptual bias on the part of the survey respondents. It is not only possible but probable that at least some survey respondents overstated or misstated their companies’ hiring and separations situations. Still, it is remarkable that the survey shows at least a perceived notable decline in manufacturing employment when the BLS data shows little change in the monthly net hiring and no decline in total employment.
The ISM report shows the Employment Index declining over the past couple of months from the March peak, whereas the BLS data indicates the actual peak came one month later. If the ISM report is more of a leading indicator, that suggests that June will be a period of job loss for manufacturing. With the June Employment Situation Report due out this Friday we shall soon find out if that is the case.
How Tight Is The Labor Market?
By far the greatest anomaly in the May JOLTS report—and indeed in every month since the end of the 2020 recession, is the “tight” nature of the job market despite a significant number of unemployed and underemployed individuals.
According to the JOLTS data, there are only 0.5 unemployed individuals per job opening.
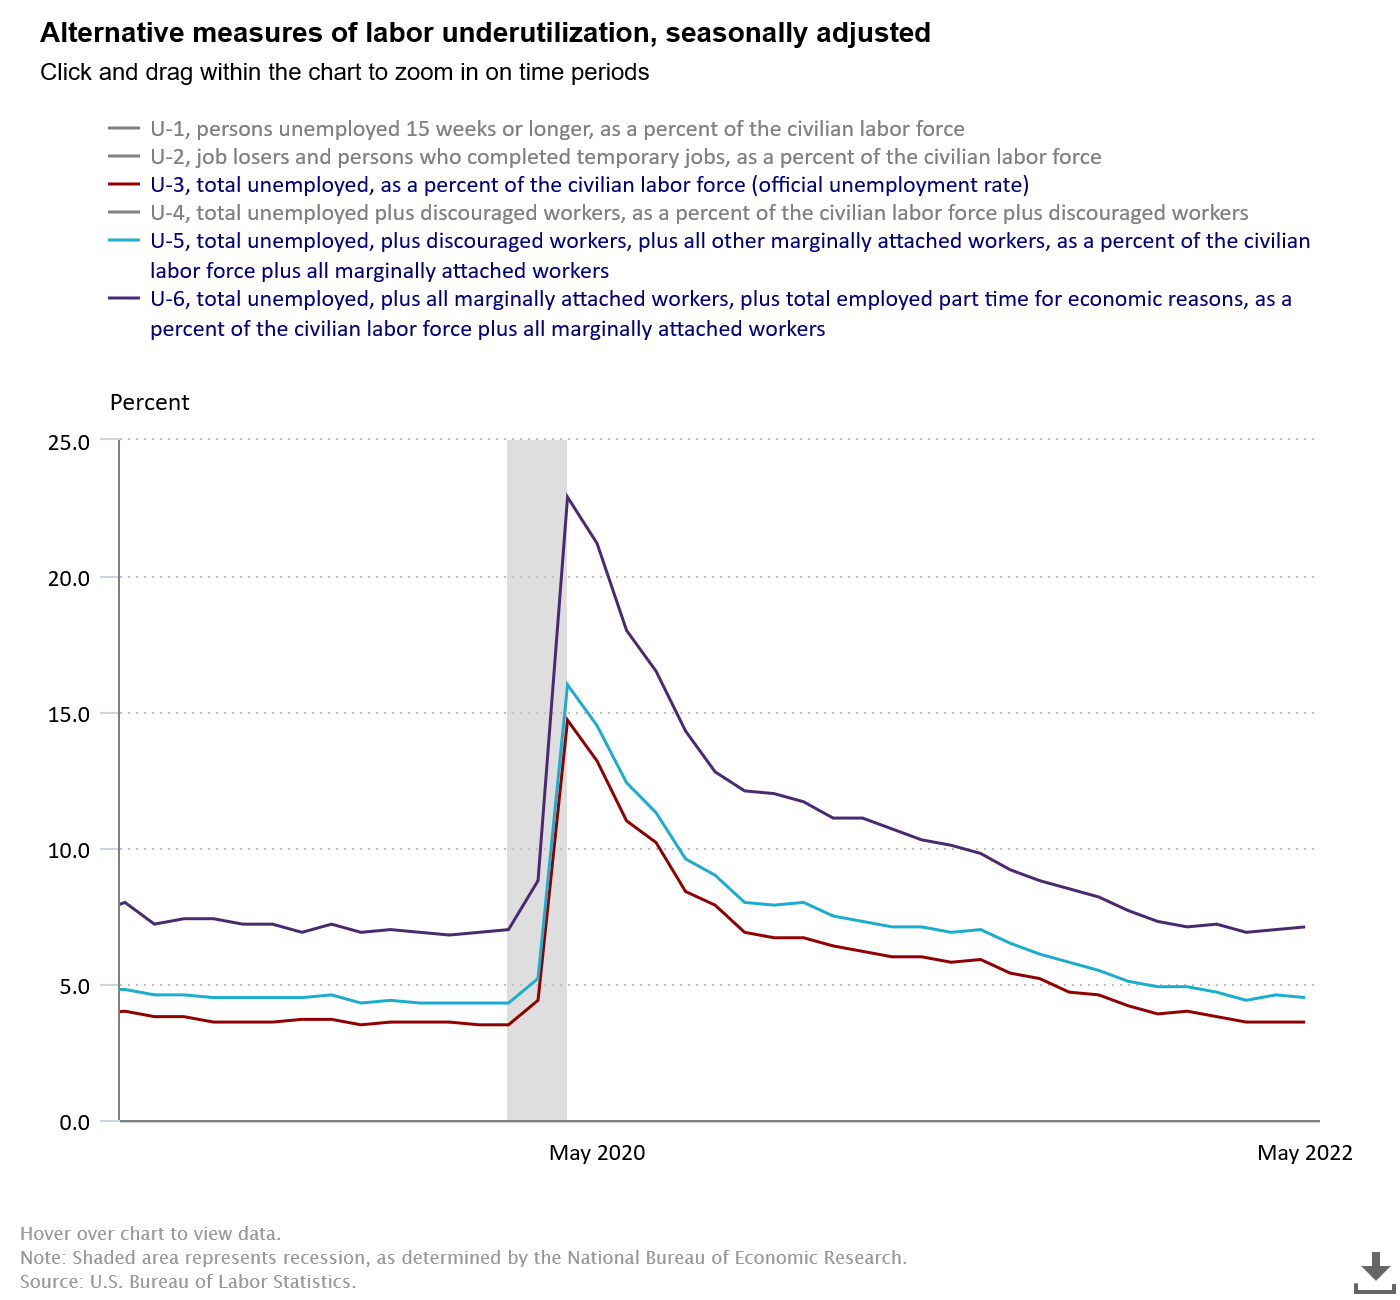
However, in the May Employment Situation Report, the U-6 unemployment metric, which includes underemployed individuals as well, increased from 7.0% to 7.1%, the second straight month the gauge crept up.
By comparison, in February 2020, on the eve of the recession, the U-6 was at 7.0% and the number of unemployed individuals per job was 0.8.
According to the JOLTS report, the job market is tighter now than it was before the pandemic, yet the U-6 shows greater underemployment now than before. Additionally, the labor force participation rate remains over a full percentage point lower than it was in February of 2020 (62.3% vs 63.4%).
Thus comes the question: “Where are all the workers?”
With rising underemployment even within the BLS official data, and with a tremendous overhand of job openings—far greater than existed pre-pandemic—the underemployment percentage should be much smaller than it is. In theory, with only half an unemployed individual per job opening, the underemployment percentage should be zero, but even allowing for real-world hiring barriers to employment, at a minimum the underemployment percentage should be decreasing, not increasing as it has done in the past two months.
Despite what the Employment Situation data indicates on job growth, the JOLTS data indicates that a significant number of workers separated during the 2020 recession have still simply not come back into the labor force. The labor market is currently “tight” not just because the demand for workers has risen since the pandemic, but also because the supply of workers remains stubbornly smaller than it was.
The “Great Resignation” is continuing even into the current recession. And Lou Costello math continues to be the dominant discipline at the BLS.
Once Again, More Red Flags
There are already a number of red flags indicating that the global economy is in recession—or at a minimum on the cusp of recession.
The May JOLTS Report adds still more red flags to the list. Despite the White House continuing to tweet about jobs and economic growth, the data shows little good news on which to tweet. No matter how many jobs ostensibly were created in May, the economy remains very much short of the workforce it had prior to the government-mandated recession of 2020. No matter how much “growth” one argues has happened in jobs this year, the pace of real job growth has been anemic relative to the labor shocks of the 2020 recession, when governments everywhere essentially ordered the wholesale destruction of jobs and the decimation of the workforce. No matter how you slice and dice the data, we are still missing workers—a lot of workers.
Which makes tweets like this from the President staggeringly tone-deaf and delusional.
Not only is the number of jobs claimed itself highly suspect—for all the reasons discussed above (as well as previously)—but the indications are that soon that number is going to take a not insubstantial hit.
Not only is the White House wrong to brag about job creation when the number of sidelined workers remains considerably higher than before, it is failing to see the warning signs that number will soon increase.
Even if we accept the JOLTS data at face value—which should not be done without several grains of salt and skepticism—that same data is yet one more warning signal that the economy is headed into very rough seas.
Yet another signal that times will get more “interesting” before they get less.


Manufacturing. Nobody wants to do it anymore. This isn't an old person, kids today, comment. The average age in manufacturing is pretty high and the ones that could retire in the last 3 years did.
The company I work for is deliberately (trying to) over hiring, in a recession, to try to get ahead of the attrition. If you look at any major corporations job board it's the same thing. We're now offering a 10k sign on bonus for electricians. Systems engineers get a 25k sign on bonus and a 10k referral bonus.
Last time I checked p&g had 13k job openings.
This is going to be a weird recession because the people that normally would be laid off to preserve stock prices don't exist. Sure plants will close but it won't be enough to solve the labor shortage.