

The Energy Shock Deepens
We Have Stagflation. How Much We Will Have Is Still Unknown.

When the March Consumer Price Index Summary came out, the headline was obvious: the US economy was gobsmacked by an energy price shock everyone saw coming.
Now that the April Consumer Price Index Summary is out, we are beginning to see how that energy shock is reverberating through the rest of the US economy.
The Consumer Price Index for All Urban Consumers (CPI-U) increased 0.6 percent on a seasonally adjusted basis in April, after rising 0.9 percent in March, the U.S. Bureau of Labor Statistics reported today. Over the last 12 months, the all items index increased 3.8 percent before seasonal adjustment.
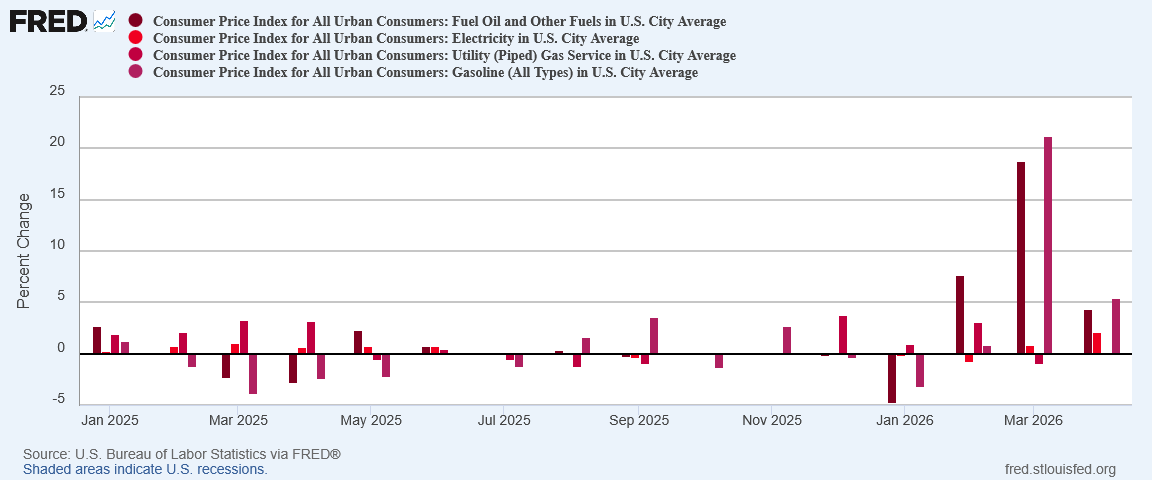
The index for energy rose 3.8 percent in April, accounting for over forty percent of the monthly all items increase. The shelter index also increased in April, rising 0.6 percent. The index for food increased 0.5 percent over the month as the index for food at home rose 0.7 percent and the index for food away from home increased 0.2 percent.
The index for all items less food and energy rose 0.4 percent in April. Indexes that increased over the month include household furnishings and operations, airline fares, personal care, apparel, and education. Conversely, the indexes for new vehicles, communication, and medical care were among the major indexes that decreased in April.
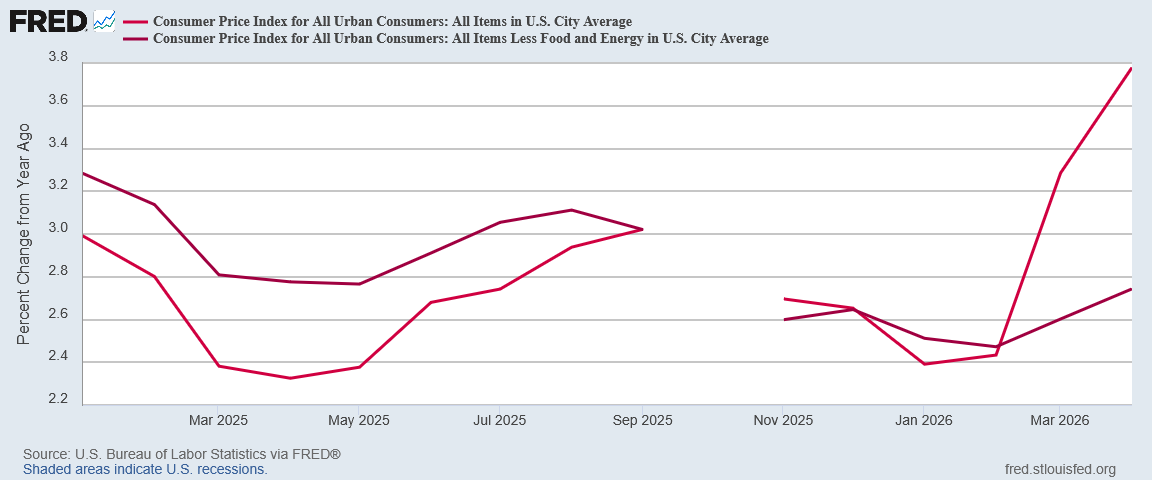
The all items index rose 3.8 percent for the 12 months ending April, after rising 3.3 percent for the 12 months ending March. The all items less food and energy index rose 2.8 percent over the year, following a 2.6 percent increase over the 12 months ending March. The energy index increased 17.9 percent for the 12 months ending April. The food index increased 3.2 percent over the last year.
The TL;DR version: prices are up. As with last month, this is not a surprise. Even with the Personal Incomes and Outlays report, it was clear that April would see inflation heating up, and beyond just energy prices. The only question was simply “how much?”
We are going to see elevated energy prices again in April. How much we see either inflationary impacts or stagflationary impacts beyond energy prices remains to be seen.
Beyond energy price inflation, the fog of war still surrounds the economics of wartime.
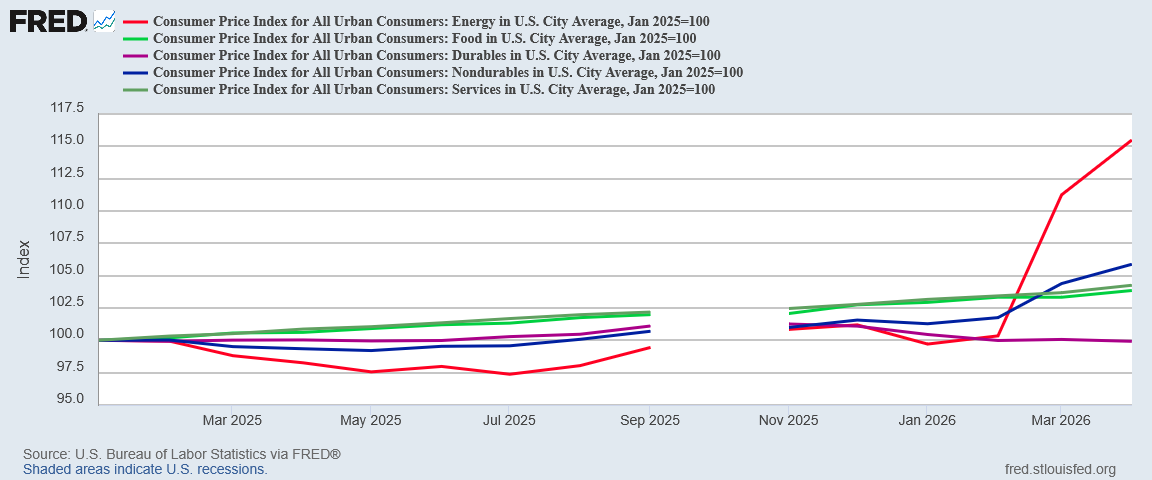
Energy price inflation is continuing, but food price inflation is returning, and non-durable goods inflation is also heating up, although still primarily from energy price inflation.
Stagflation is starting to creep into the US economy. The price shock that started with energy prices is percolating throughout the rest of the Consumer Price Index.
Thus far, the worst impacts are still contained to energy prices. Do not be deceived, however. Prices are heating up across the board and we should expect that trend to continue for at least as long as the war with Iran continues.
We now know we will have stagflation. What we do not know is how much we will have. Not yet.
Headline Inflation Actually Cooled, And So Did Core Inflation
While there is no denying that the energy shock continues to pound the US economy, there is also no denying that the price shock’s impact was less in April than it was in March.
Year on Year, both headline and core inflation rose, and rose significantly.
Yet Month on Month, inflation was more restrained
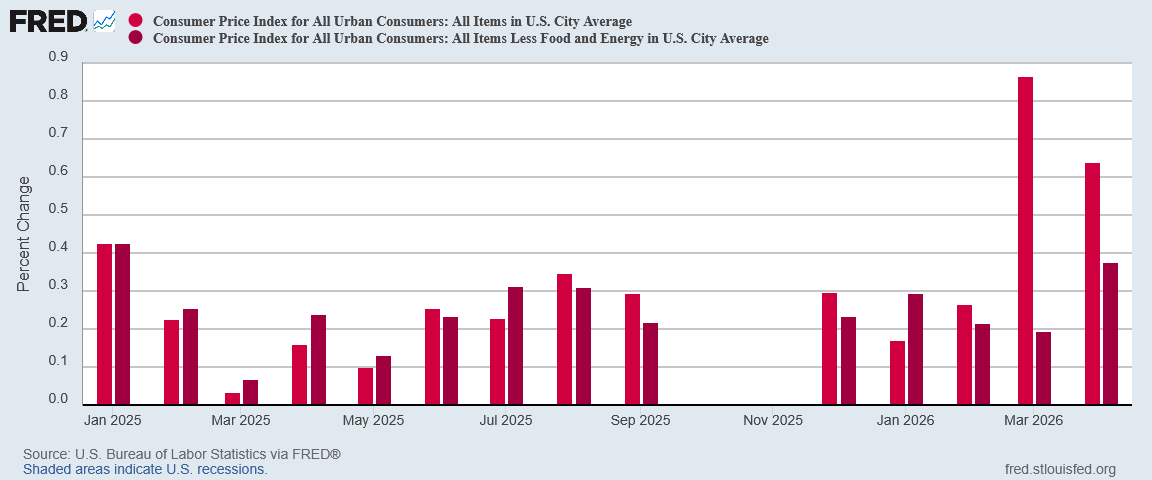
There is one encouraging aspect in both the headline and core inflation figures for April: headline inflation cooled significantly, although core inflation printed 0.27pp higher on the month. This is a reversal from the first few months of 2026, where core inflation was coming down even as headline inflation was heating up.
Core inflation strips out the energy component. A sharp rise in core inflation is almost certainly indicative of a contagion effect where energy price inflation is creating inflationary pressures on other consumer prices, and so the inflation effect spreads.
Stagflation is clearly stalking the US economy.
Energy Prices Rose, But Less Than Before
One possible note of encouragement about energy price inflation: we had less of it in April than in March.
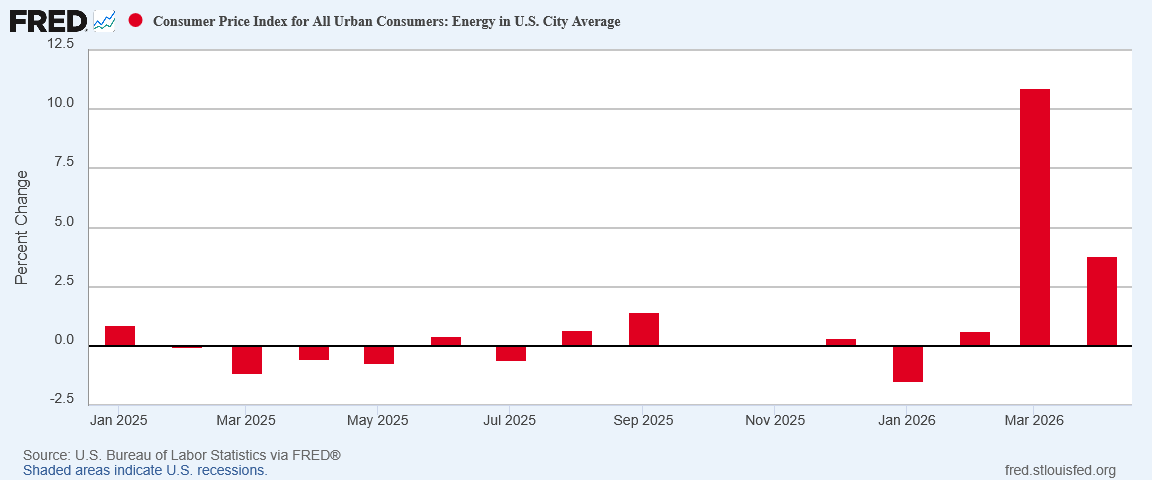
For all energy components, the April price shift was a disinflationary one.
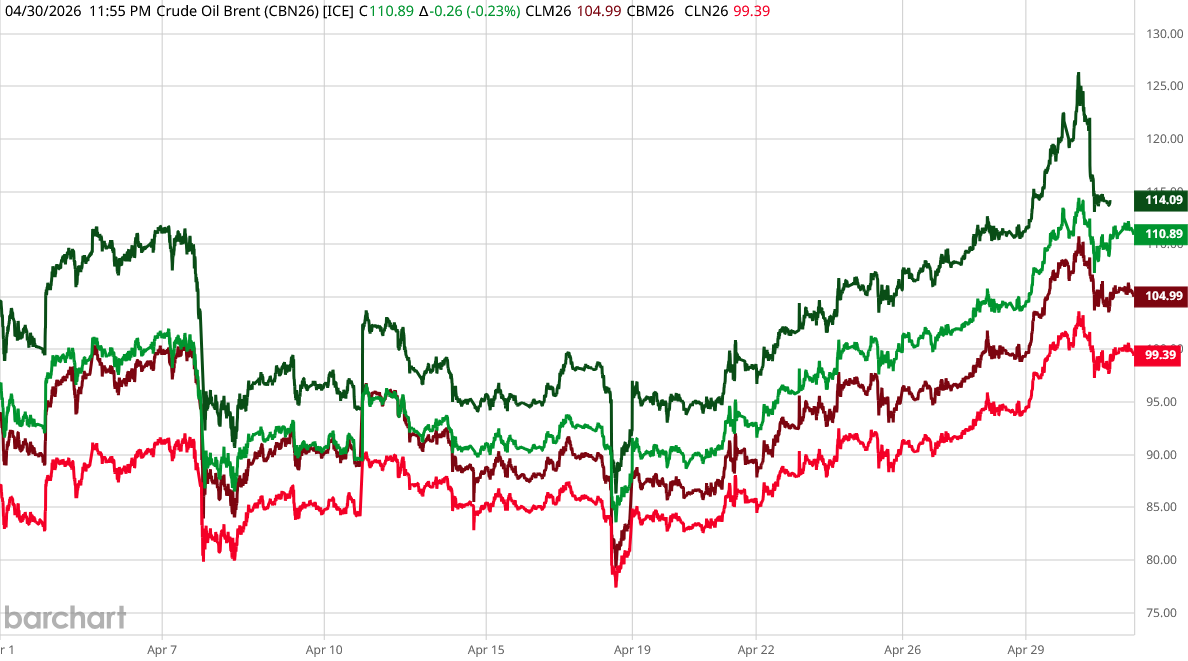
Upon inspection, however, this is not surprising. Oil prices rose approximately 14% for Brent Crude in April, and 10% for West Texas Intermediate.
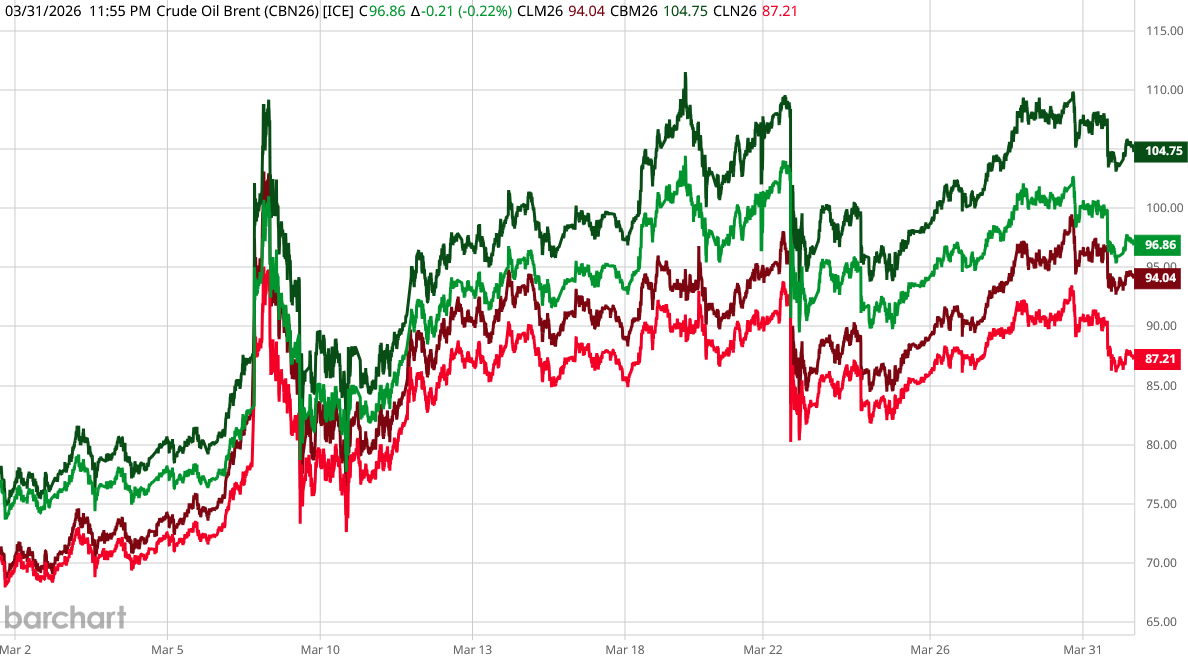
In March oil prices were up by as much as 33% for Brent Crude.
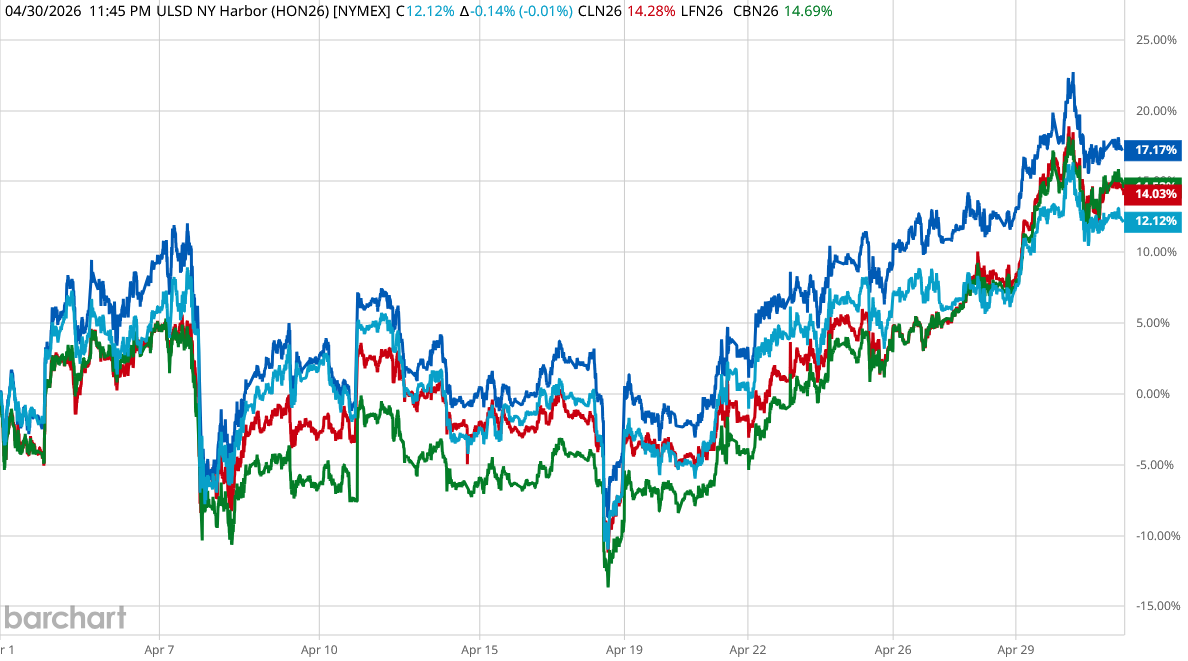
Diesel prices for Europe displayed similar trajectories, rising 17% in April, compared to 12% for the United States.
Energy price inflation remains elevated, but the magnitude of the April increase has been much less than it was for March, and we are seeing that in the overall CPI data.
Could this be an indication that the overall inflation impacts of the war with Iran will be relatively brief, with price rises starting to ebb either next month or in June? That is a possibility. However, a lack of energy price inflation should not be confused with energy price deflation. We may see energy prices stop rising. We should not anticipate much in the way of a decline in energy prices until the Strait of Hormuz is opened for navigation once more.
Food Price Inflation
One very not good price shift in April was an increase in food price inflation.
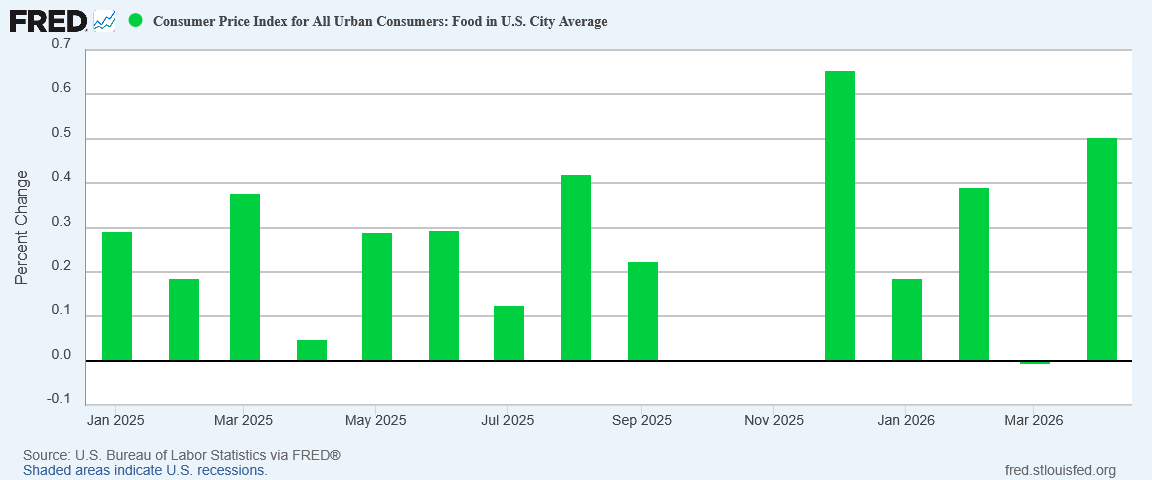
After ticking down ever so slightly in March, for April food prices jumped 0.5pp month on month.
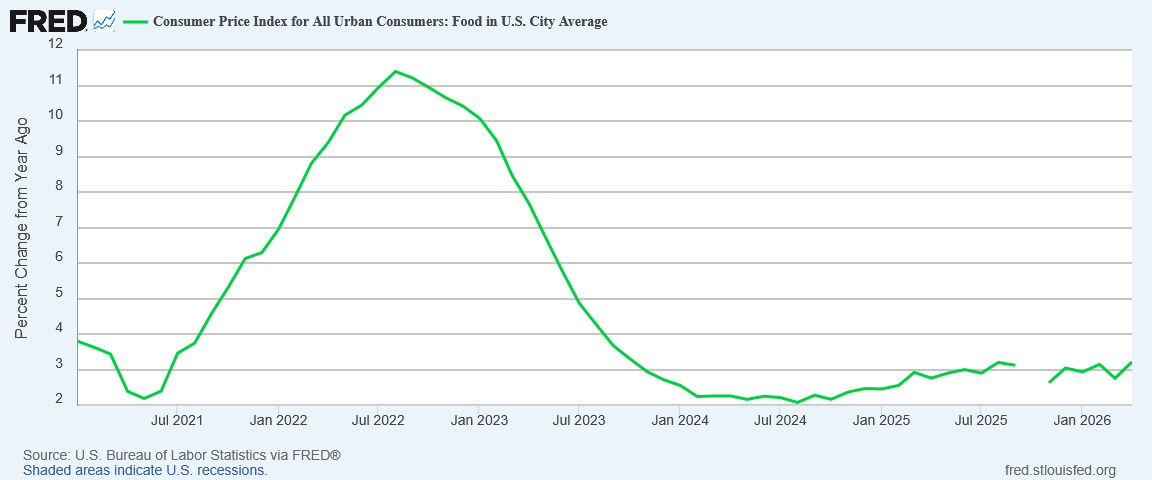
However, we should also note that, year on year, food price inflation remains in a dynamic equilibrium around 3%.
We should not expect this trend to hold for very long. While inputs for food prices thus far have not been dramatically impacted by the war with Iran, we are seeing a marked surge in fertilizer prices. While this will have less impact on the crops already planted, it will have larger impacts for crops which get harvested later in this year or early next year.
The impact of higher fertilizer prices varies across farms depending on the timing of fertilizer purchases and the type of nitrogen fertilizer used. Farms that purchased fertilizer prior to February will see limited impacts on 2026 production costs. In contrast, farms that delayed nitrogen purchases are exposed to recent price increases. Anhydrous ammonia is typically the lower-cost nitrogen source compared to nitrogen solutions. All farms are expected to face significantly higher costs for the 2027 crop.
That impact is being felt worldwide, and especially in Europe.
For spring, Europe’s farmers got lucky. Most had stocked up on fertilizer before the war, and European Commission officials say this season’s needs are “largely secured.”
That luck is running out. Farmers are now placing orders for this fall’s plantings, and the math doesn’t work out. Wheat is selling for the same price it sold for before the war, even as fertilizer costs have risen. Some growers are cutting back on nitrogen. Others are switching to crops that need less of it. Both choices mean smaller harvests in 2027, when shoppers will finally feel the effects of the war.
While food price inflation is on track to be more severe in Europe than in the United States, the US is also on track to experience significant food pricing inflation.
Food prices are going to be driven by the bounty of each crop, and the bounty of each crop is contingent largely on the amount of fertilizer applied. With fertilizer costs increasing, if farmers reduce fertilizer usage then crop yields will suffer, pushing up prices, and if farmers sustain current levels of fertilizer usage, then the costs of producing the crop will eat into the profits, again pushing up prices.
The upward pressure on fertilizer prices from the surge in energy prices can only resolve one way—with higher food prices and for longer.
Stagflation Is Starting, But Still Restrained
The data is clear: we are seeing the initial indications of stagflation taking root in the US economy.
However, we should presume that this means all prices are going to surge to extraordinary levels. At present, that is not happening.
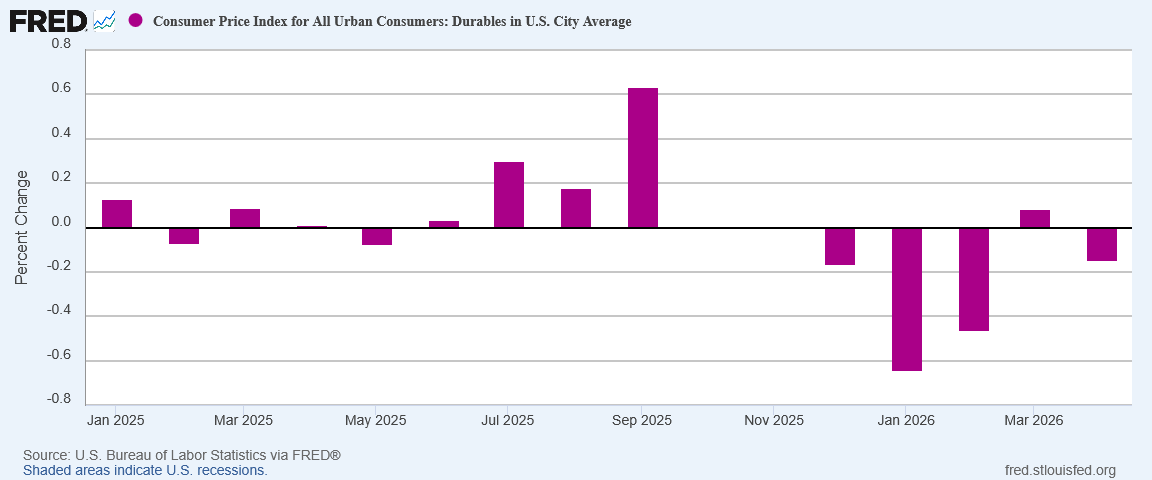
Durable goods prices actually fell in April.
Non-durable goods however, still showed elevated month on month inflation, although it had cooled significantly from March.
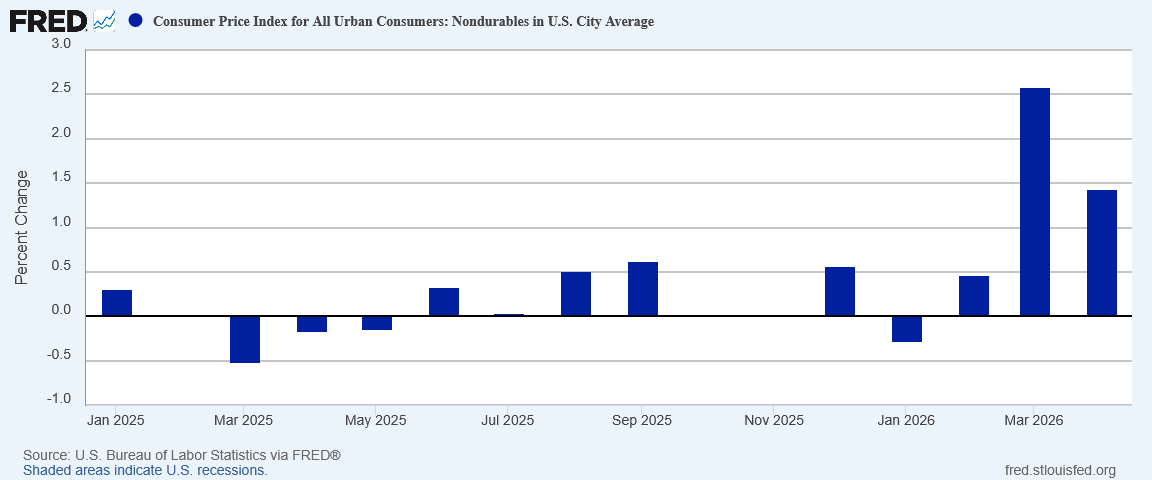
The non-durables increases, however, come with the caveat that much of this is due to energy price inflation already noted.
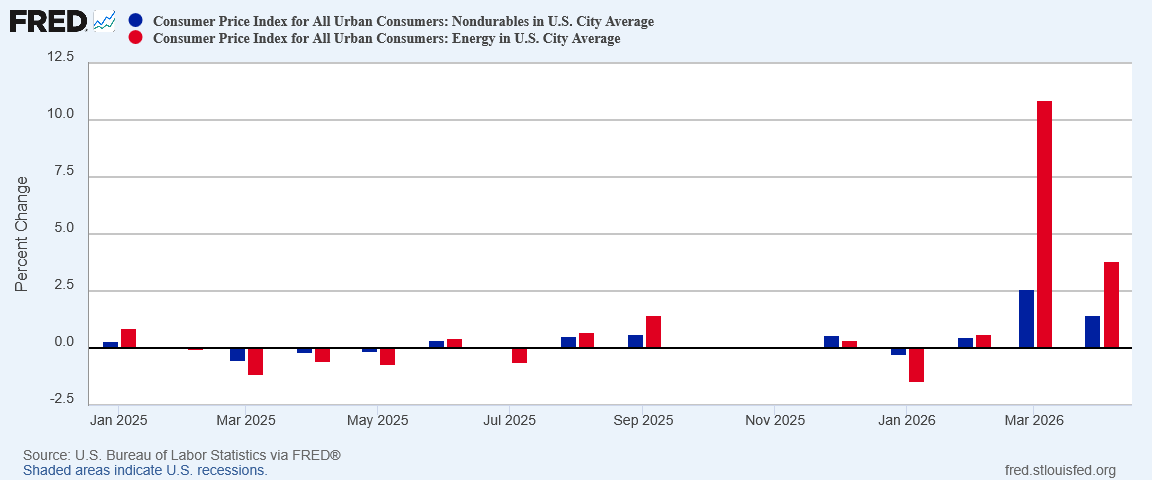
Without energy price inflation for non-durable goods would be greatly reduced.
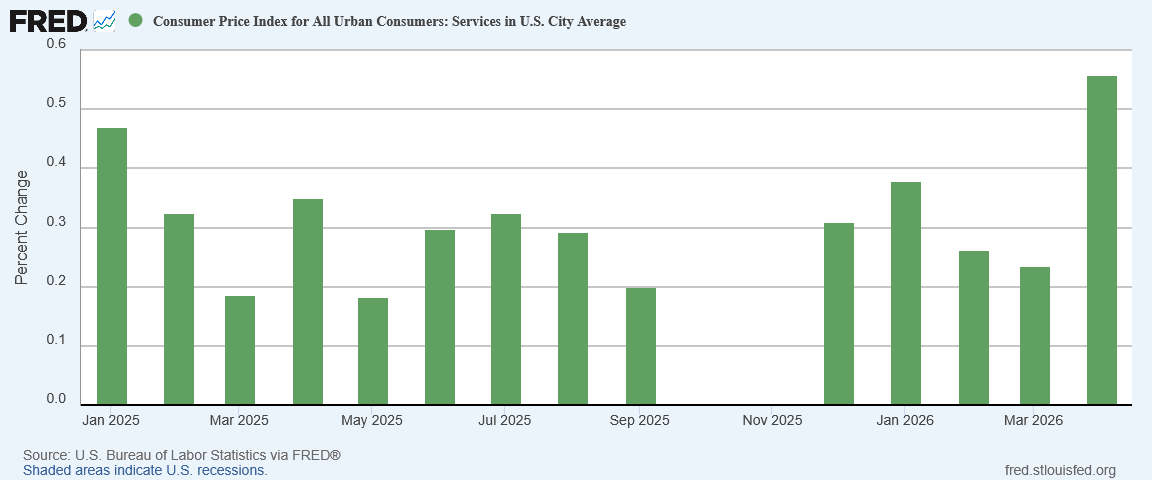
Service price inflation more than doubled in April.
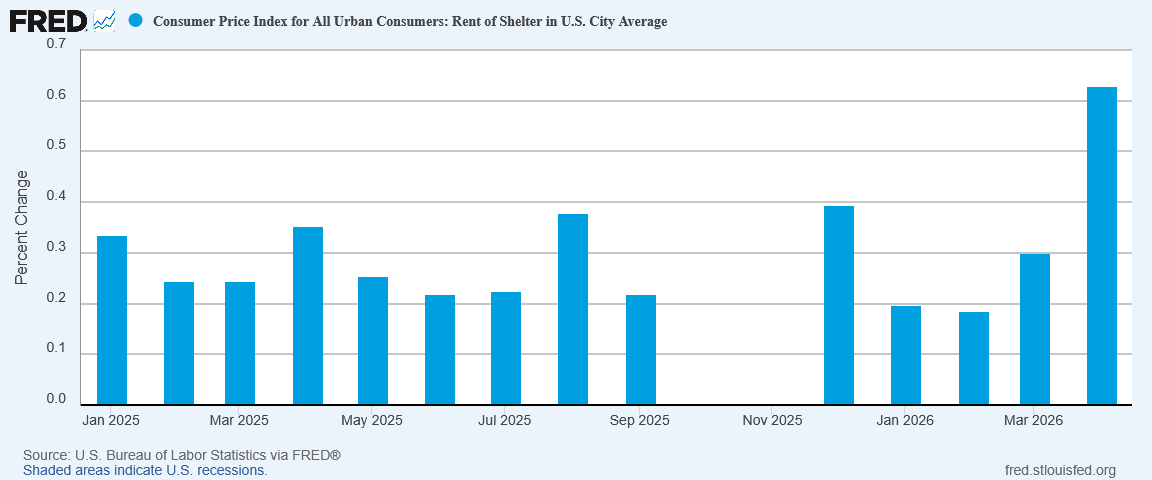
Shelter price inflation also doubled in April 2026.
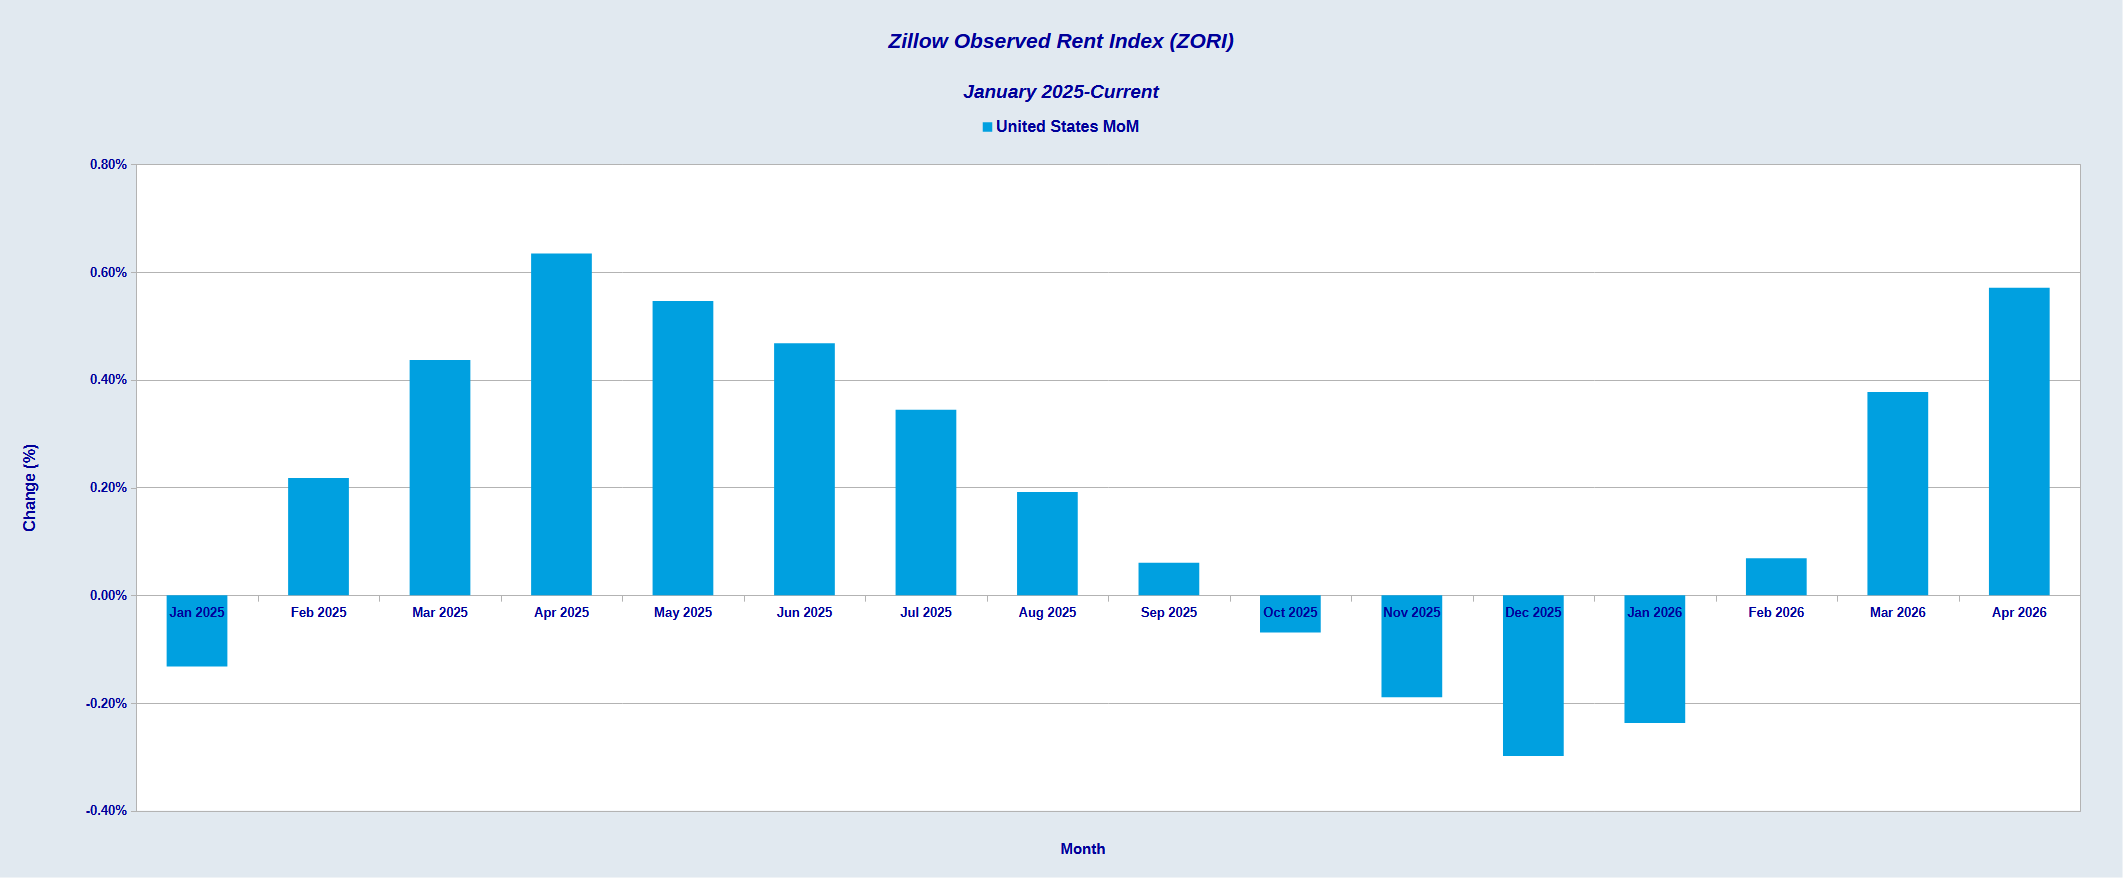
We should note, however, that the more forward-looking Zillow Observed Rent Index shows shelter price inflation increasing on a more regular cycle, making it less likely for inflation in housing to be the result of dislocated supply.
Inflation is indisputably heating up more or less across the board, but we are not (yet) seeing the price surges we have been seeing in energy.
That blessing is likely to prove highly transitory, however. The longer the war with Iran drags on, the longer the Strait of Hormuz remains closed, the greater the stagflation pressure on the US economy.
We are seeing a little stagflation now. We will see more next month, and even more the month after that, until there is peace in the Middle East once more.
Inflation + Deflation = Stagflation
Because we don’t talk about stagflation often, it behooves us to maintain awareness of what the term actually means.
Conceptually, stagflation is when rising prices collide with low economic growth or even economic contraction1.
An easy sign of low economic growth is weak unemployment—the so-called “misery index” is predicated on rising inflation and rising unemployment—but we can also see indications of weak or sub-par economic growth in whether or not we have inflation or deflation in certain price subindices.
When we look at how inflation is unfolding relative to the various subindices, how we are seeing persistent deflation in durable goods, and arguably in non-durable goods as well, we see that the energy price shock can very well be the sort of supply-side shock which, when coupled with deflationary pressures, produces stagflation.
While the data is still too new to have supreme confidence in the conclusion, the similar inflection points from March to April suggests that energy price inflation is crossing into other goods and services.
However, we are also seeing deflation occurring in durable goods prices. With non-durable goods, it is highly likely that most if not all of the inflation we are seeing there is the result of energy price inflation.
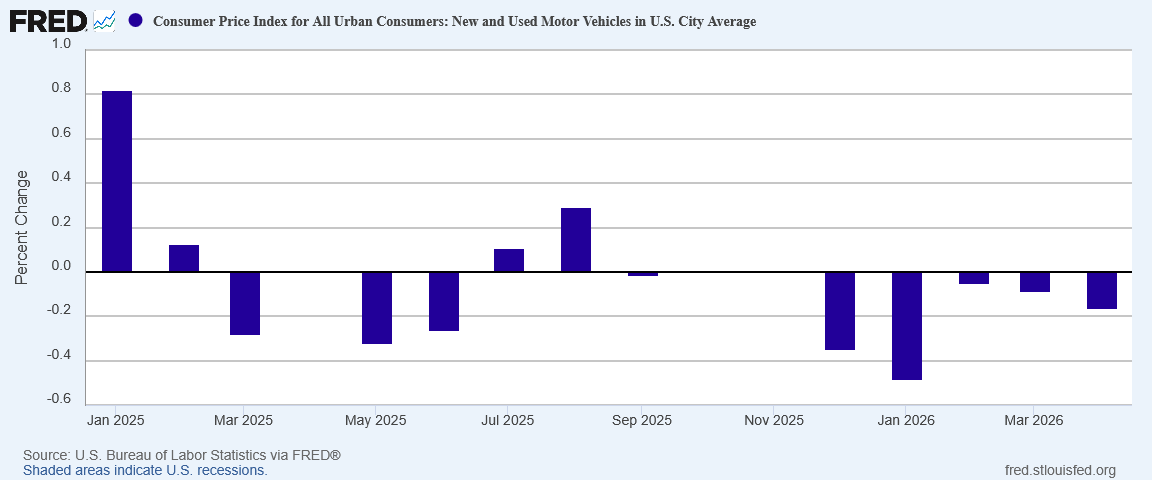
When we look at specific durable goods categories, such as automobiles, we see that overall retail sales have largely plateaued and even declined since the start of 2025.
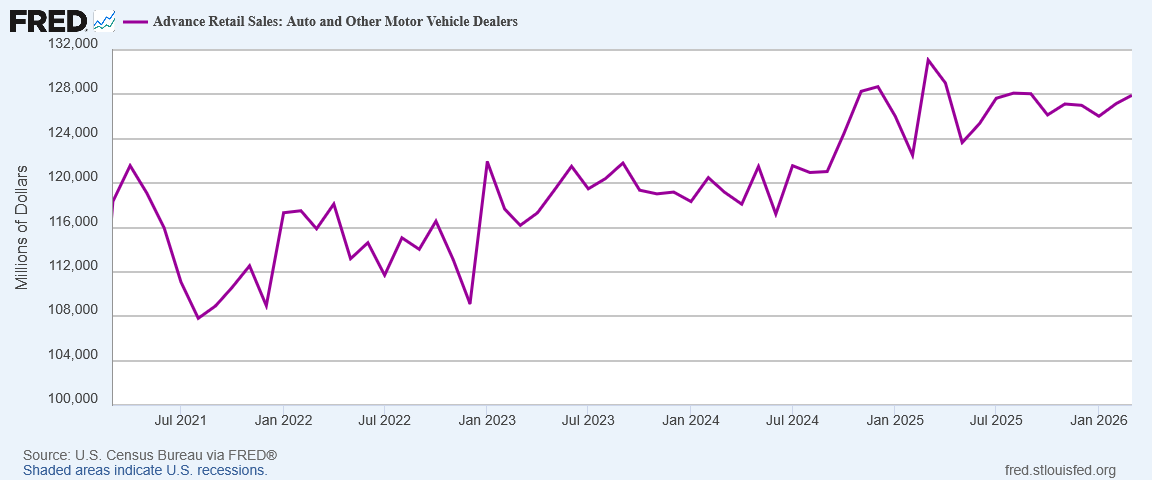
Unsurprisingly, new and used car prices have printed mostly deflation since the start of 2025.
Another unavoidable sign of weakness is that weekly earnings have, for the most part, not kept pace with inflation, as most paychecks have yet to recover from the 2022 hyperinflation cycle.
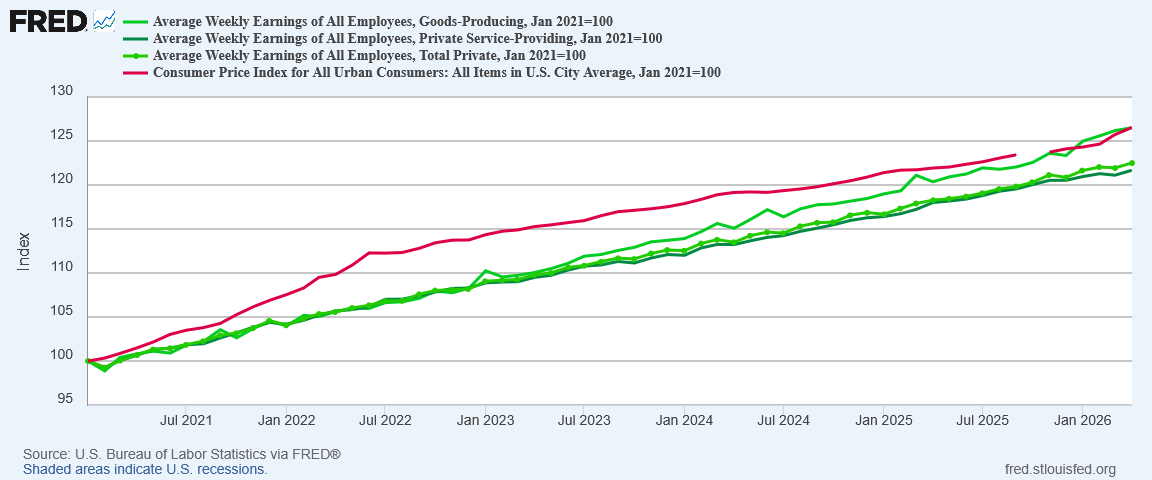
Even goods producing jobs are, as of the April data, have only just recovered from 2022. If inflation continues at an elevated rate, even goods producing jobs will quickly lose ground to inflation again.
The end result of the intersection of rising prices brought on by supply shocks is that demand destruction is the only way an economy can rebalance after such a shock.
Energy prices are rising because the availability of energy-related products is suddenly significantly reduced. The reason for the scarcity is obvious: the closure of the Strait of Hormuz and consequent disruption of Persian Gulf oil flows. The supply of oil available at all price levels has been reduced.
When there is a sudden drop in supply for anything, demand can only reach a new equilibrium level through demand destruction. Quantities purchased must go down to match the new supply curve.
That is what we are likely to start seeing over the coming months: demand destruction, as consumers adapt to suddenly higher energy prices.
The consequence—and cure—for stagflation in any economy is always going to be demand destruction. That’s the next evolution that we will soon see in the US economy.
How Much Worse Can It Get?
With an ongoing price shock pushing up first energy prices and then prices for other goods and services, and with peace seemingly elusive with Iran thus far, the natural question to ask at this point is “how much worse can it get?”
In the worst case scenario, it can get quite a bit worse. If events in the Persian Gulf result in greater damage to both Arab and Iranian oil infrastructures, if Qatari LNG production is further damaged and pushed offline for a number of years, energy prices will be elevated for a number of years.
Those higher energy prices are already pushing up diesel prices around the world to nearly double pre-war levels. Those higher energy prices are already pushing up bunker fuel prices for shipping. That much is happening, and it could get significantly worse if the war with Iran takes a violent turn and more infrastructure damage is unleashed by both sides.
Maersk CEO Vincent Clerc is already warning the investor community that, if elevated fuel costs persist, shipping companies will be compelled to pass along at least a portion of their increased fuel costs.
The more benign scenario for the US will be that US oil production serves to stabilize energy prices here in the US. Diesel prices remain high, but do not get much higher. Bunker fuel rates for shipping remain high, but do not get much higher.
When there is no price increase, inflation is zero. However, if prices stabilize at a new, higher level, inflation is still zero but the affordability of goods and services is constrained until earnings catch up to inflation. As we are already seeing, that is not a quick process.
With earnings lagging inflation, and that inflation driven entirely by supply shocks and sudden increases in scarcity, we have enough weakness evident in the US economy to acknowledge that the April CPI report shows the beginnings of a stagflation episode. Prices are up, supply is down, and eventually demand will be down as well to compensate.
How much will prices be pushed up in May or June? That we do not know. Future price movements in oil and related refined products are entirely at the mercy of the Strait of Hormuz. Reopen the Strait and get Persian Gulf oil flows trending back to pre-war levels, and the inflationary pressures on energy are immediately alleviated. The inflation dynamic right now is as simple as that.
At present, the Strait of Hormuz remains blocked, and all indications are that it is going to remain blocked for at least a little while longer. Energy price inflation is going to rise for at least that little while longer. Stagflation will stalk the US economy for at least that little while longer.
We have stagflation. The fog of war means we do not know how much stagflation we will ultimately have.
Gratton, P. What Is Stagflation, What Causes It, and Why Is It Bad? 12 May 2026, https://www.investopedia.com/terms/s/stagflation.asp.
Thank you for defining Stagflation. and yet the markets are up up and away - but what I'm paying at the pump and for groceries is eating up any increase in retirement accounts. I do hope Stagflation stays restrained.
Just about every process has lead and lag times. Too much is in flux to make calculations, but Trump needs to “guess” how much time he has to win the war, with time for gas prices, especially, to decline before the midterm elections. Peter, do you have any sense of how much time he has (let’s assume that rates of most variables remain static)? On the current path, I’d guess maybe three weeks. Your guesstimate?