


Consumers got some welcome news with yesterday’s release of the March Consumer Price Index Summary from the Bureau of Labor Statistics, in the form of falling prices.
Last month I noted how, instead of the rising inflation trend that appeared to be forming in January, we got cooler inflation for February.

Disinflation rather than more inflation was the order of the day.
In March the cooling trend intensified, resulting in outright deflation for headline consumer prices, which fell 0.1% month on month.
The Consumer Price Index for All Urban Consumers (CPI-U) decreased 0.1 percent on a seasonally adjusted basis in March, after rising 0.2 percent in February, the U.S. Bureau of Labor Statistics reported today. Over the last 12 months, the all items index increased 2.4 percent before seasonal adjustment.
Coming in the middle of a very confused media firestorm over President Trump’s “Liberation Day” tariffs, and Wall Street’s panicked overreaction to those tariffs, consumer price deflation is a very welcome event indeed.

Is this the beginning of a prolonged cooling trend? Dare we hope that President Trump has delivered on one of the signature promises within Agenda 47, that of ending consumer price inflation and making America “affordable again”?
While the current data is rather optimistic on these points, the raging tariff debate could easily upset the consumer price applecart and moot any conclusions we are tempted to reach about future inflation. To borrow from the apocryphal Chinese curse, welcome to “interesting times”!

Consumer Prices Dropped
The 0.1% decline in headline consumer prices was by itself welcome news. However, it was not the only good news, as core consumer price inflation cooled significantly as well.

Core consumer prices increased less than 0.1% month on month, which is less than half the level of increase from February and a mere fraction of the more than 0.4% increase month on month from January.
Core consumer prices still increased, but by far less than they had been increasing.
For both headline and core numbers, the March inflation print was the best in months. March was the first month since last June that we had seen any decrease in headline consumer prices. We have to go back to January of 2021 to have a month on month increase in core consumer prices as small as we had last month.
Nor is the improvement just within the monthly numbers. The year on year numbers are also some of the best we have seen in quite a while.

The last time we had year on year inflation prints at this level was all the way back in early 2021—in January 2021 for headline inflation and March 2021 for core inflation.
Given that core consumer price inflation had stalled out above 3% in the final months of the (Biden-)Harris Administration, and that headline inflation had been trending up during that same time, these first inflation prints of the Trump Administration 2.0 are by any measure a welcome change.
What of the detail numbers? As I have said numerous times in the past, to understand the inflation data we have to look under the hood at the supporting detail.
The detail numbers are not bad either. There are some important caveats, but broadly the details are moving in the right direction.
For example, March saw a return to energy price deflation.

As energy price deflation has been the norm for most of 2024, the surge in energy prices for January and February of this year was not a welcome trend reversal at all, especially as the numbers continued this trend year on year as well.

Energy by far saw the worst year on year inflation during the 2022 hyperinflation cycle, and is always a primary contributor to headline inflation. Falling energy prices are in every circumstance a prerequisite to reducing consumer prices overall, and even simply controlling consumer price inflation overall.
However, we do need to acknowledge an important caveat in this celebration of the numbers: food price inflation increased month on month after easing dramatically in February.

Year on year, rising food price inflation has been a trend that extends back into last fall, and has been increasing over the past couple of months.

Food prices are still very much a cause for concern, as inflation is not only not below the Federal Reserve’s “holy grail” figure of 2%, but it is getting worse. On food prices we have not yet turned the corner on inflation.
This Was Unexpected
For their part, corporate media had not expected the CPI numbers to be as good as they were, and President Trump did not hesitate to make maximum use of their surprise in his victory lap on the whitehouse.gov website where he emphasized how his economic agenda is delivering on key campaign promises.
After today’s inflation report showed the first consumer price decline in years, a decrease in energy prices, and real average hourly wage growth, one thing is clear: President Donald J. Trump’s economic agenda is delivering for Americans.
The announcement went on to detail a number of quotes from various media sources, all of which amplified the President’s core message.
Additionally, Reuters also noted energy’s important contribution to consumer price deflation.
The decline likely reflected lower energy costs and the fading effects of beginning of the year price hikes.
However, corporate media still made efforts to throw shade on the numbers. CNN highlighted the opinions of “expert” economists that March was as good as inflation was going to get, that it was going to rise from here, mostly because of Trump and tariffs.
Economists have cautioned that Thursday’s CPI report could very well mark the nadir in inflation this year as President Donald Trump’s massive and sweeping tariffs upend global order and make imports — and, likely, end-products for consumers — markedly more expensive.
And it must be said again that the data is not completely positive, which is why even pro-Trump Breitbart noted—just as I did above—that food price inflation is still a problem.
It was not all good news. Food prices rose sharply, including egg prices. Grocery climbed 0.5 percent and dining out prices increased 0.4 percent.
All in all, however, the numbers were a pleasant surprise, and the corporate media takes did not make a serious effort to discourage people from being pleasantly surprised.
Food Price Disparities
While food price inflation has been rising especially year on year, we should not simply assume that all food prices are rising equally quickly or by the same amounts.
Egg prices, while still rising, rose by the smallest amount since November.

Beef prices also cooled dramatically in March.

While not quite a return to price deflation, the falling away of more than 0.2pp month on month was a welcome disinflationary impulse for March.
Chicken prices also rose, albeit by less than in February, while pork prices surged out of deflation to very nearly a full tenth of a percentage point month on month.


Yet while meat prices rose overall, the price of bread fell.

Potato prices also decreased, albeit by a lesser amount.

Lettuce prices, on the other hand, rose faster in March than in February.

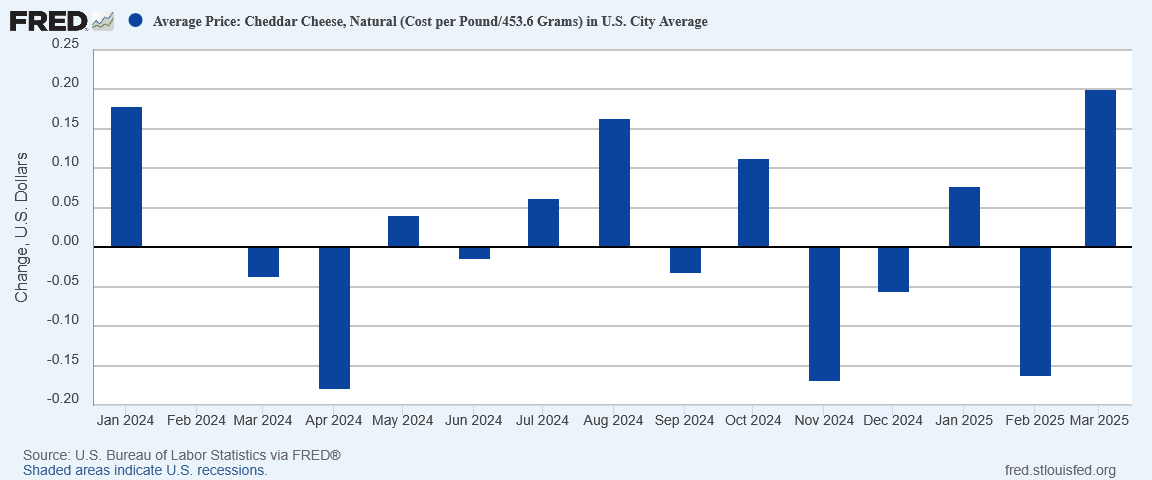
Dairy prices—milk and cheese especially—also saw rising inflation month on month in March.

Overall, food price inflation, while rising in the aggregate, is still very much a mixed bag of inflation, disinflation, and deflation. The data on food prices is far from being all good, but it is also far from being all bad.
Energy Prices And Commodities Actually Rose
Remarkably, when we look at energy price data, in March energy prices actually rose.
Oil prices rose by nearly $2 per barrel in March.

Commodities prices as a whole also rose significantly in March—between 2.5% and 4.0%.

Gasoline futures also rose steadily throughout the month.

This was matched at the gas pump by rising prices.

As this data does not appear to have been reflected in the March inflation print, we should anticipate it influencing April’s consumer price data.
Energy price deflation is nice, but this data does not suggest we will be seeing much of that over the near term.
Core Inflation Eased Across The Board
While the food and energy data is a mixed bag, the core inflation print itself was consistently disinflationary, with a clear cooling inflation trend taking hold in several of the subindices.
Housing saw cooling inflation for the second month in a row.

Service price inflation likewise printed its second disinflationary month back to back.

The same is true for nondurable goods as well.

Only in durable goods did inflation tick up month on month—barely.

Core prices rose, but they rose by less than they have been. Even durable goods prices rose considerably less than they did in January.
Disinflation is not deflation, and it is not nearly as desirable to the consumer as deflation, but it is preferable to rising inflation. For the past two months, core consumer prices have been printing disinflation, and that’s not a bad sign.
The Start Of A Trend?
When we looked at the January inflation numbers there were clear signs of rising inflation. With President Trump’s tariff strategy still an anticipated future happening, the signs then were that rising inflation worldwide had the potential to significantly alter and perhaps even derail that strategy.

However, the signature difference between 2018 and the present is that prices were not rising globally in 2018. To the contrary, import prices in the United States remained in a deflationary trend that had started some three or four years earlier and continued until just before the COVID Pandemic Panic nonsense.
That change in the inflationary outlook is almost certain to have significant impact on how any tariffs imposed by President Trump are received by the world.
Since then, however, the trend particularly here in the United States has been the exact opposite.
The “supply squeeze” that was seen in January eased significantly in February.
However, during March both energy and commodities prices indicated resurgent stresses on supply chains, with energy and resource inputs becoming less available.
Even though the price increases observed in both energy products and commodities in general did not translate through to the consumer price index for March, they still happened. Whatever influence on consumer prices that might be lagging from these prices will almost certainly impact the April numbers.
What that impact will be is going to be even more problematic for April than is normally the case, if only because of the dramatic swings in energy and commodities prices we have seen in recent days because of the “Liberation Day” tariffs. Remember, commodities and oil prices nosedived when President Trump announced the tariffs.
Commodities and oil surged again when the tariffs were paused.
The “normal” patterns by which actual prices percolate through to the CPI are likely to be thoroughly disrupted for April. At present I would not want to forecast whether we will see rising or falling consumer price inflation next month.
Even without the tariffs presenting as a factor, there is no escaping the inflationary impulse signified by rising oil and commodities prices. If that inflationary impulse was not expressed in March it will be expressed as a part of the April data.
The tariffs themselves are, of course, an inflationary price pressure. To be clear, tariffs in and of themselves do not cause inflation to occur. They are merely one of many forces pushing prices up and down, and actual inflation or deflation is the result of all of those forces being resolved together.
The tariffs may result in increased inflation. It is possible they will not prevent disinflation, or even outright deflation.
Because we cannot at this juncture assess the actual effect of the Liberation Day tariffs on consumer prices, we have no way to know with any certainty whether the March inflation print is the start of a trend or not.
What we can say is that the inflation and price data itself is sufficiently mixed that the tariffs are likely to be the deciding factor in whether we get rising consumer price inflation or consumer price disinflation. The “normal” consumer price data genuinely has no clear inflation signal, and that makes the tariffs themselves all the more determinative.
While we may see further disinflation and perhaps even deflation in the future, we may also see rising inflation. Perhaps the one thing we should enjoy about the March inflation data is that it is the last month where we are likely to have a clear picture of either deflation, disinflation, or inflation.
For better or for worse the Liberation Day tariffs are now part of the economic and geopolitical landscape. For better or worse we will be dealing with their impacts from April onward.
For better or worse, we won’t know what those impacts will be until they happen.
Welcome to “interesting times”!
Yes, welcome to "Interesting Times."
May they stay interesting, rather than become "Very Interesting" times due to an Iranian EMP or China-Taiwan conflict or even "more Interesting" activities across the globe or outer space.
Good summary, Peter Nayland Kust, let us hope for no more "Red Flags" but I'm sure there are a few surprises out there.
Any thoughts to lingering food price pressure due to actions like killing a bunch of chickens for bird flu?