In preparing my articles, I frequently strive to defend a contrarian position. I look at a prevailing media narrative and then look for arguments—and then facts, evidence, and data—to articulate what might be wrong in that narrative.
Thus when the Bureau of Economic Analysis reported that the US economy grew by some 5.2% on an annualized basis during the third quarter of 2023, I looked specifically on how to deconstruct that conclusion, and to call attention to aspects of the BEA data that were getting short shrift by the corporate media.
However, when we look at the totality of economic data available, we quickly find there are far more recessionary red flags than were germane to just the relatively narrow focus of the third quarter.
When we step back and take a broader look across the data, and across the trends that are visible in the data, we can quickly see not only that there is something egregiously off-kilter in the US economy, but we can see about when the problems began to emerge.
While the government “experts” are loathe to call our current economic situation a “recession”, the data is crystal clear that “something” is amiss, and if it is not recession then we need a new label to succinctly convey what that “something” is. Lacking any good terminological alternatives, I generally opt to employ the term “recession”.
We need to step back and take the broader view, now and again, simply to maintain a coherent framework for understanding new data as it becomes available. Accordingly, now is a good time to dive once more down the recession rabbit hole and explore parts of the backdrop that deserve more attention than they have received.
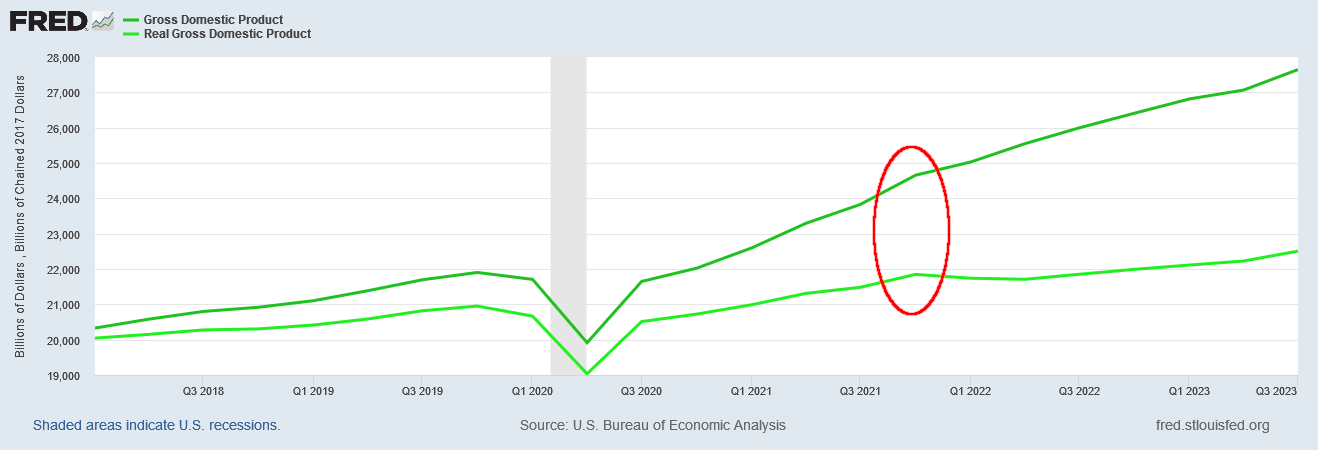
The first indication we have of a growing problem in the US economy is the widening gap between nominal Gross Domestic Product and the “real” GDP calculated using 2017 price levels.
We need to be extremely clear on this point, because the nature of inflation is such that, so long as inflation is non-zero, real GDP will always lag nominal GDP by an increasing amount. Despite this, when we look at GDP growth after the Pandemic Panic Recession, we can discern a clear inflection point in the fourth quarter of 2021 after which real GDP growth slowed dramatically.
If we index GDP and real GDP to the first quarter of 2020—right before the Pandemic Panic Recession—we can see that the inflection point is quite real and not merely a visual charting artifact.
In the seven quarters between the first quarter of 2020 and the fourth quarter of 2021, real GDP rose 5.7% of the Q1 2020 value. In the seven quarters between the fourth quarter of 2021 and the third quarter of 2023, real GDP rose only 3.2% of the Q1 2020 value.
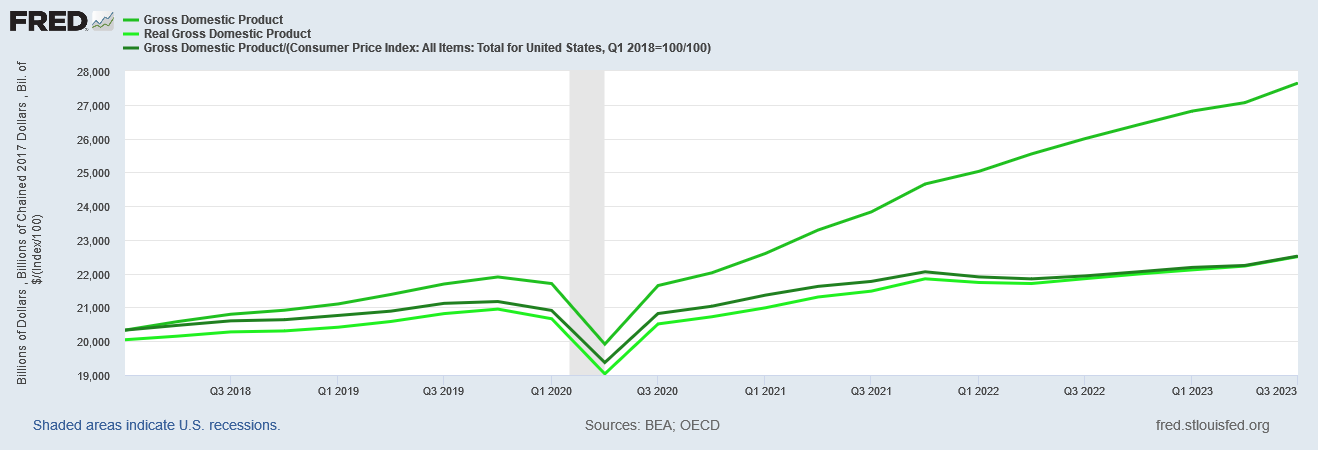
As a further sanity check, if we construct our own GDP deflator by indexing the CPI to the first quarter of 2018 (the first period on the chart) and then dividing nominal GDP by that deflator, we see that the results are not radically different from the real GDP figures calculated using 2017 price levels.
The same Q4 2021 inflection point appears even then, so we have yet another confirmation that “something” changed around that time.
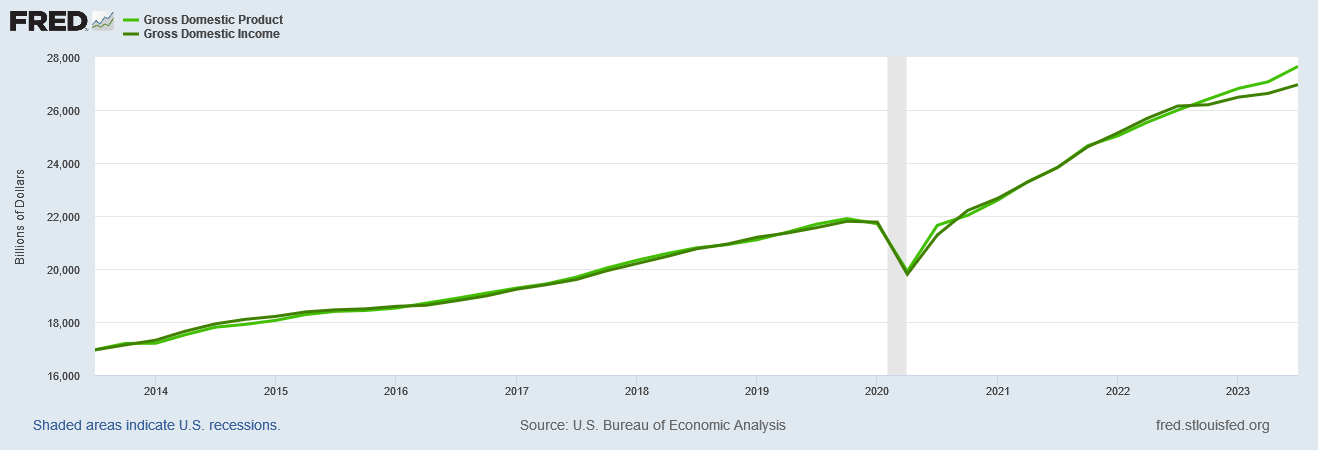
A second warning signal arises in the third quarter of 2022, when Gross Domestic Income deviates significantly—and increasingly—from Gross Domestic Product.
First, a quick background on the concept of “Gross Domestic Income (GDI).” The shorthand explanation is that it is the aggregate of all income generated by all economic sectors over a period of time1. This is a somewhat different take on economic output from “Gross Domestic Product”, which is the value of all goods and services produced over a period of time2.
In terms of calculation, the differences between the GDI and the GDP are as follows:
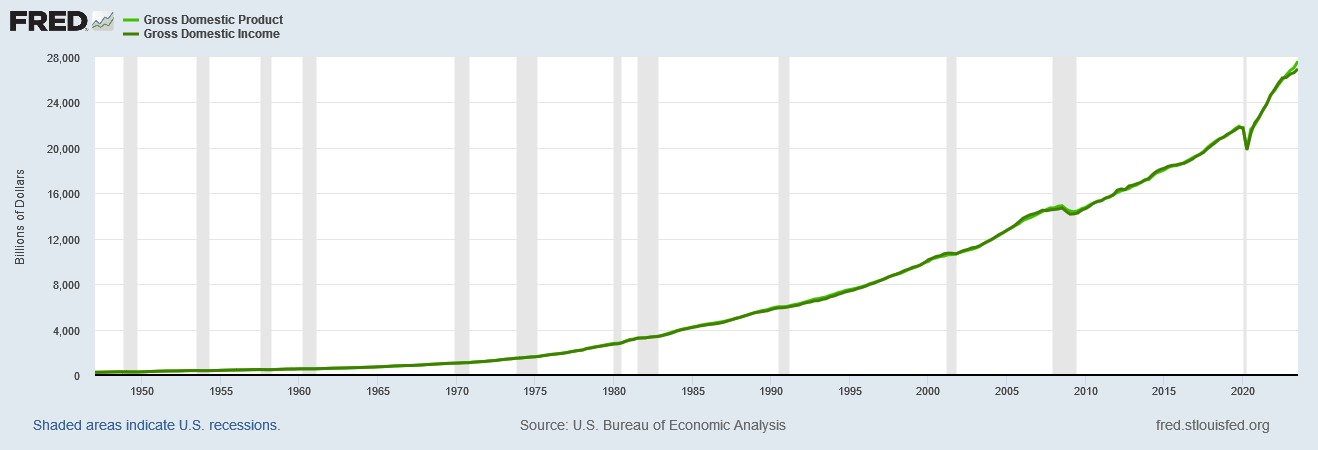
Theoretically, GDI should equal GDP, as everything purchased ultimately represents income to somebody. In reality, the two metrics vary slightly from each other but rarely by very much.
Until now.
If we index GDP and GDI to the first quarter of 2021, we can easily see the inflection point in Q3 2022, after which GDI is increasingly below GDP.
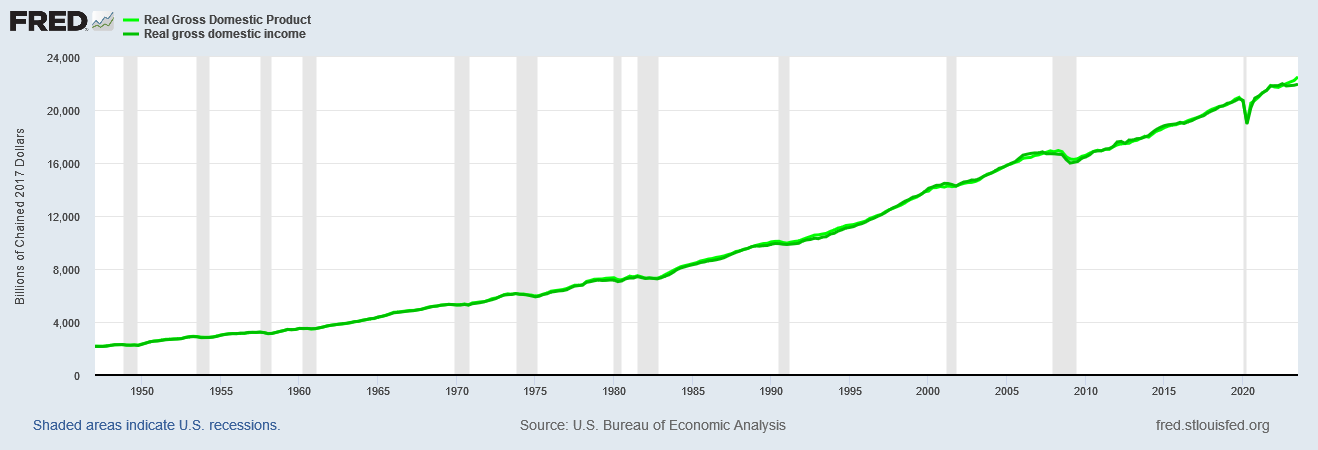
If we look back across the totality of GDP and GDI data present in the FRED system, we do not find a single period where the variance between these two metrics is this large or has endured for this long.
Clearly “something” has changed.
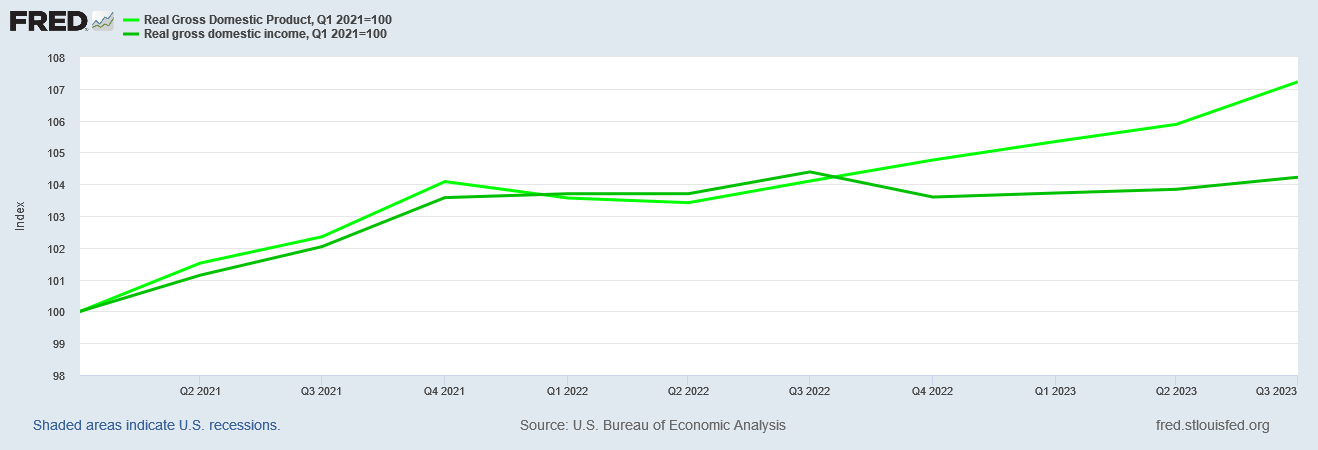
When we look at real GDP and real GDI, both using 2017 price levels, we see in the real GDI data both the Q4 2021 and Q3 2022 inflection points.
As with the nominal data, real GDP and real GDI historically do not deviate much from each other.
Until now, that is.
If we index real GDI to the first quarter of 2021, we find both inflection points clearly preserved.
In the three quarters between Q1 and Q4 of 2021, real GDI rose 3.6% of the Q1 2021 figure. In the three quarters between Q4 of 2021 and Q3 of 2022, real GDI only rose a further 0.8% of the Q1 2021 figure. From Q3 of 2022 onward to the most recent quarter of 2023—a total of four quarters—real GDI has actually declined by 0.2% of the Q1 2021 figure.
The decline itself is rather more significant than just that 0.2% variance, because in the fourth quarter of 2022 real GDI gave up all its gains since Q4 2021, and then grew even slower across the next three quarters than it had in the three quarters from Q4 2021 to Q3 2022.
There can be no doubt that both real Gross Domestic Income and real Gross Domestic Product began slowing in the fourth quarter of 2021, and real GDI slowed again in the third quarter of 2022.
Even in nominal terms, Gross Domestic Income has been growing more and more slowly since the fourth quarter of 2021.
Between Q1 2021 and Q4 2021, nominal GDP grew 8.6% of the Q1 2021 figure. Between Q4 2021 and Q3 2022, nominal GDP grew a further 6.7% of the Q1 2021 figure. In the four quarters since Q3 2022, nominal GDP grew a further 3.6% of the Q1 2021 value.
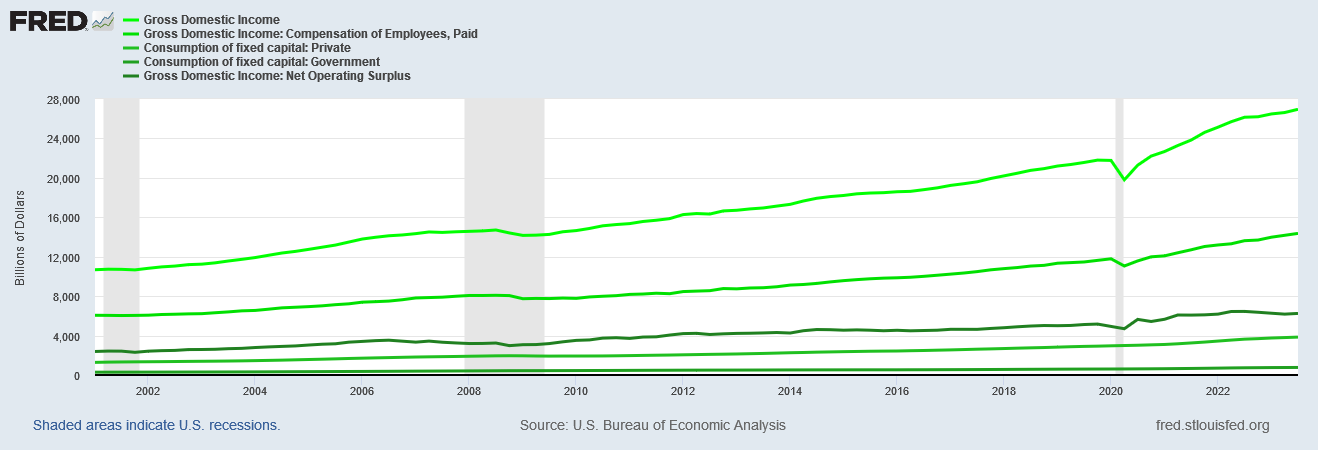
While GDI is calculated using more than just wages and salaries paid to workers, wages and salaries are by far the largest component of GDI and always have been.
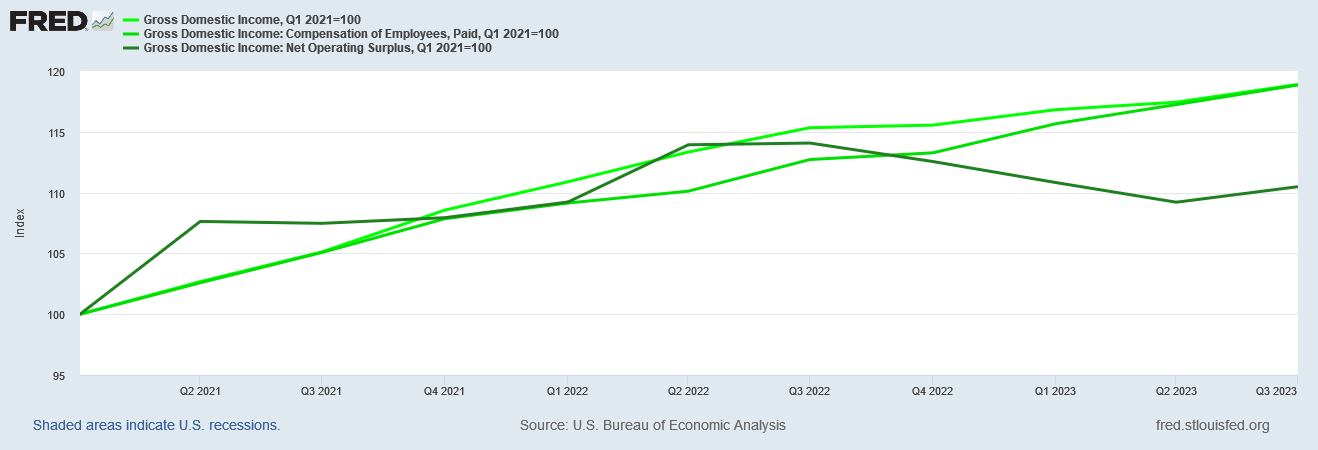
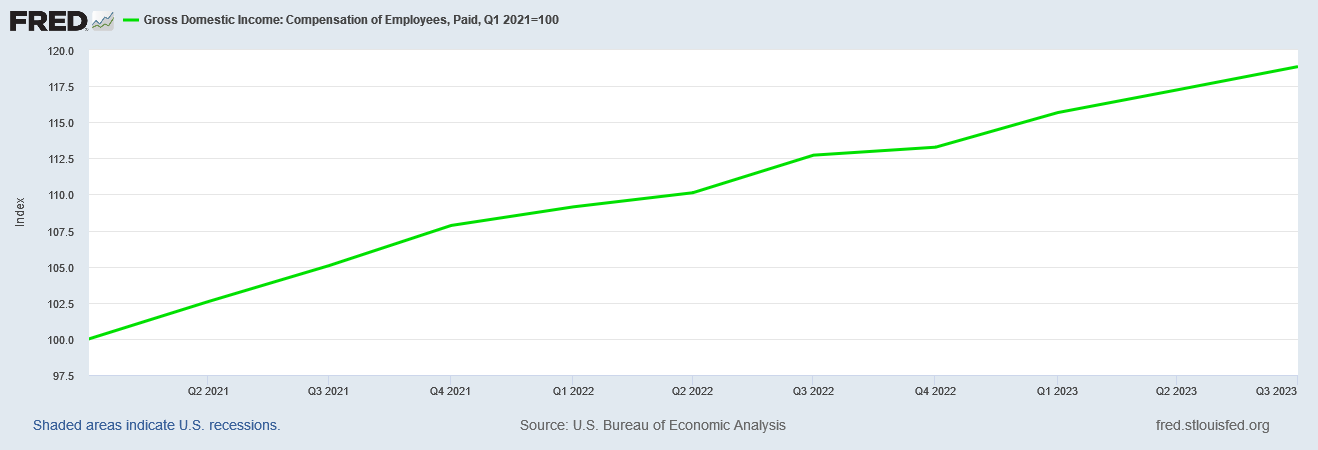
If we focus on the two largest components of GDI—employee compensation and net operating surplus (essentially, profits to various businesses), we see that net operating surplus began to decline in a big way after Q3 2022.
Employee compensation also inflected in both Q4 2021 and Q3 2022, although to a much smaller degree than net operating surplus.
Between Q1 and Q4 2021, employee compensation rose 7.9% of the Q1 2021 figure. Between Q4 2021 and Q3 2022, employee compensation rose a further 4.8% of the Q1 2021 figure. Employee compensation growth picked up a little bit after Q4 2022, and across the four quarters since Q3 2022, employee compensation rose 6.2% of the Q1 2021 figure.
Between business profits and employee wages, at both nominal and real levels, income in the US has been growing more softly, more slowly, and has even declined.
These are not good economic signals. Slower income growth regardless of the reason simply is not compatible with a productive and healthy economy.
To be sure, some analysts and commentators on Wall Street and in the corporate media are taking note of the growing discrepancy between GDI and GDP.
The US economy could be in worse shape than previously thought. That's evidenced by a worrying indicator, which hasn't flashed a warning this loud since right before the 2008 recession, according to Macquarie strategists.
The financial services firm pointed to the US's monster GDP growth over the third quarter, with the economy expanding at a revised clip of 5.2%.
That's led some commentators to assume the economy is nowhere near a slowdown, but a closer look at gross domestic income — the measure of total compensation given to production — spells a different story.
Yearly growth in gross domestic product is currently outpacing gross domestic income by the most since 2007, Macquarie said in a note.
Others argue that GDI is a more sensitive metric than GDP and will more quickly display signs of coming economic distress than the GDP data.
Gross domestic income (GDI) rose at an annual rate of just 1.5% in the July-September period and has grown feebly over the past year even while GDP has advanced solidly. Over the past four quarters, GDP has increased 3% while GDI has fallen 0.16%, according to an analysis of Commerce data by Joseph LaVorgna, chief economist of SMBC Nikko Securities.
That’s the biggest disparity between the two measures in recent memory.
The total level of GDI is also 2.5% below that of GDP, the largest gap since 1993, says Barclays economist Jonathan Millar
LaVorgna argues that GDI is doing a better job of picking up the early signals of a recession that many economists believe will hit the U.S. next year.
“I think GDP is overstating the strength of the economy,” LaVorgna says.
However, these views are very much a minority view, as a quick survey of Google News demonstrates. Far and away the prevailing views on Wall Street are that the economy is robust and healthy now, even if a recession may be likely later next year.
Still, the data is unmistakable, and what the data signifies is not at all obscure: not once but at least twice since the official end of the Pandemic Panic Recession, income growth in this country has slowed significantly. Some categories of income (e.g., company profits) are even declining.
While the National Bureau of Economic Research has shied away from calling any period since the Pandemic Panic Recession a recession, these noticeable downshifts in aggregate income would certainly be consistent with a new recession beginning as early as Q4 2021, and definitely by Q3 2022. That Q4 2021 also is marked by a downshift in real GDP growth adds further weight to the argument that the economy slipped into recession at least once during this period.
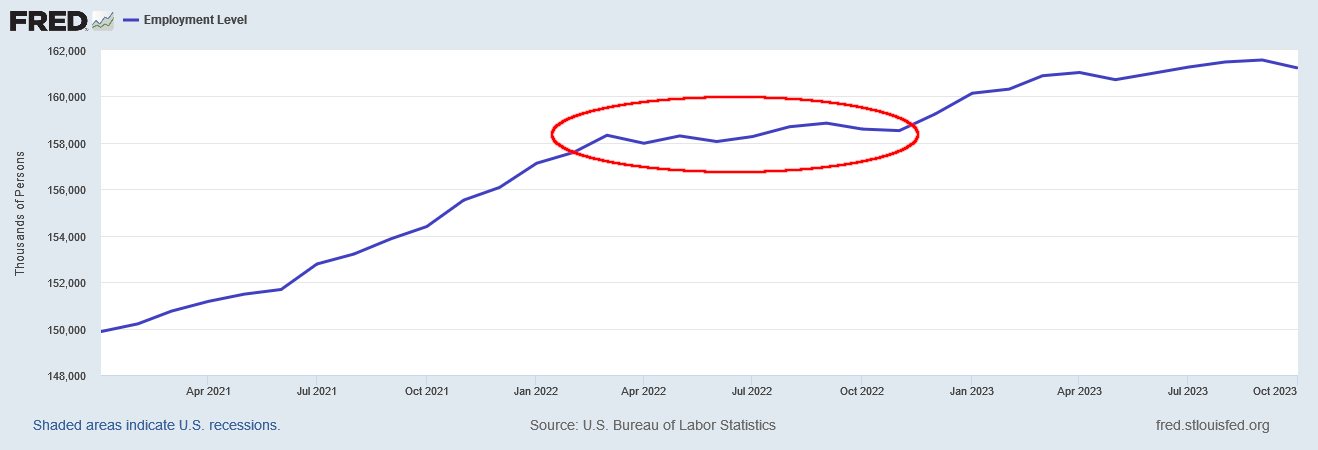
We should be mindful also that it was during 2022 that the Philadelphia Fed concluded that, contrary to the BLS jobs data, job growth had in fact been minimal at best.
We can see confirmation of the Fed analysis in the employment level plateau which occurred during the middle six months of 2022.
It is certain that employment growth in the US slowed dramatically after March of 2022 and has yet to recover its previous vigor. In October employment in the US actually decreased.
Thus we have, independent of the GDP and GDI data, a further recessionary signal starting in early spring 2022.
However, it is perhaps not supremely important as to when the US economy actually slipped into recession. What is important is that these recessionary signals are ongoing even now. If these signals are at all accurate, if their meaning is at all what I suspect them to be, then we have clear and umistakable evidence that the US economy is in recession right now.
I suspect for many readers they need only the confirmation of their own experiences, or perhaps those of their neighbors, to conclude the US economy is in a recession. At a minimum the US economy is not nearly as healthy as most people would like. The economic data is replete with red flags and warning signs, all of which scream “recession!” and are happening even as of this writing.
I decline to speculate on why most economic “experts” choose not to look at these signals, or why Wall Street, Washington, and corporate media all choose to promote a narrative of economic health and vitality when the data has so consistently and clearly proclaimed the exact opposite. I do not know why so many choose to ignore the data.
What I do know is what the data says. The data is telling me recession is here, and recession is getting worse. If we have learned anything in recent years it is that we should trust the data over the narrative in any news reporting or analysis.
I trust the facts, the evidence, and the data. So should you.
Ganti, A. “Gross Domestic Income (GDI): Formula and Calculations.” Investopedia, 2022, https://www.investopedia.com/terms/g/gdi.asp.
Fernando, J. “Gross Domestic Product (GDP): Formula and How to Use It.” Investopedia, 2023, https://www.investopedia.com/terms/g/gdp.asp.


