

Employment Situation Summary: Strong, Weak, Or Lou Costello Labor Math?
Once Again, The Numbers Do Not Say What The Report Says

The headline number from the September Employment Situation Summary is that 263,000 jobs were created, proof of declining unemployment and a wonderful jobs market in the US.
Total nonfarm payroll employment increased by 263,000 in September, and the unemployment rate edged down to 3.5 percent, the U.S. Bureau of Labor Statistics reported today. Notable job gains occurred in leisure and hospitality and in health care.
That’s what that number means, right?
Not exactly. Even without the vaudevillian absurdities of Lou Costello Labor Math1, focusing strictly on the headline numbers glosses over the more important realities contained within the supporting detail.
One Survey Shows Increased Employment, The Other Shows Decreased
Because of the tendency of the BLS to engage in questionable mathematical games, I prefer to focus on the raw data before seasonal adjustments are applied.
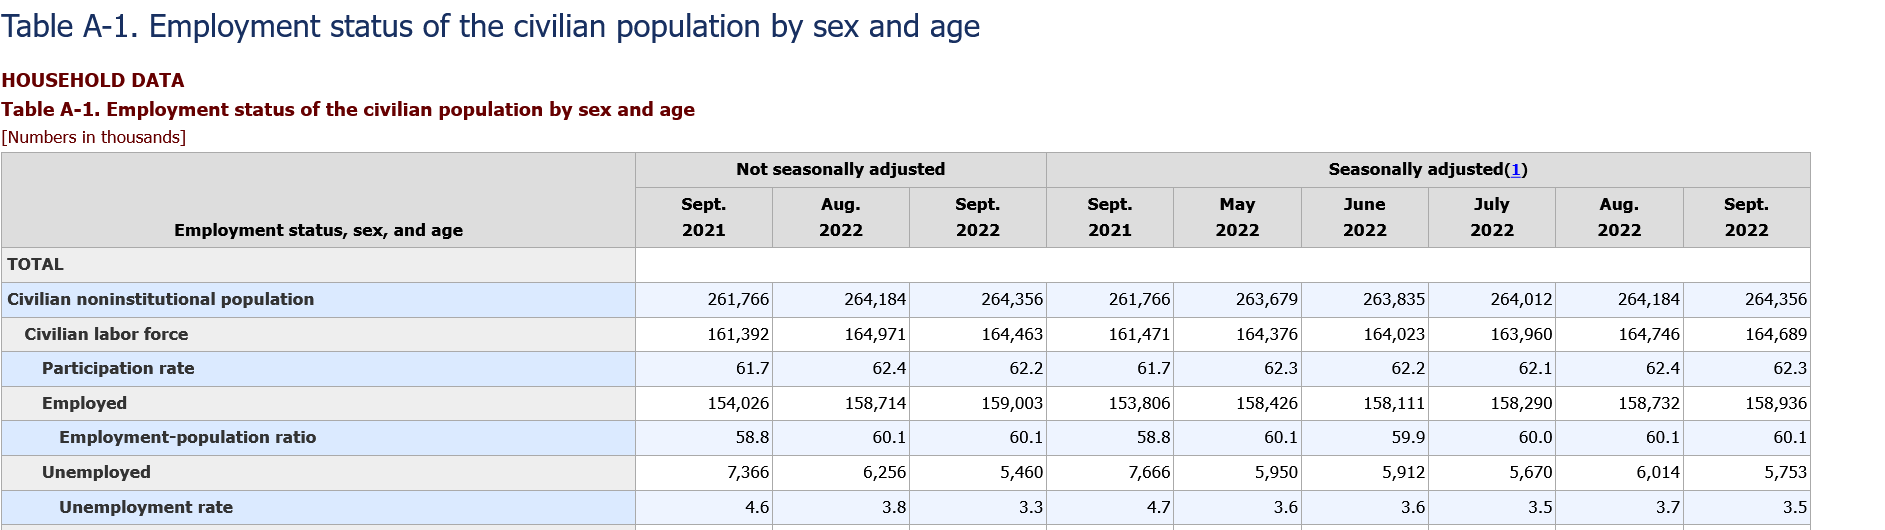
What the raw data for the household survey shows is that employment in the US actually increased by 289,000, rather than 263,000. Moreover, the ranks of the unemployed shrank not to 5.8 million, but to 5.4 million.
Sounds even better, right?
All things being equal, it would. However, as is so often the case, all things are not equal.
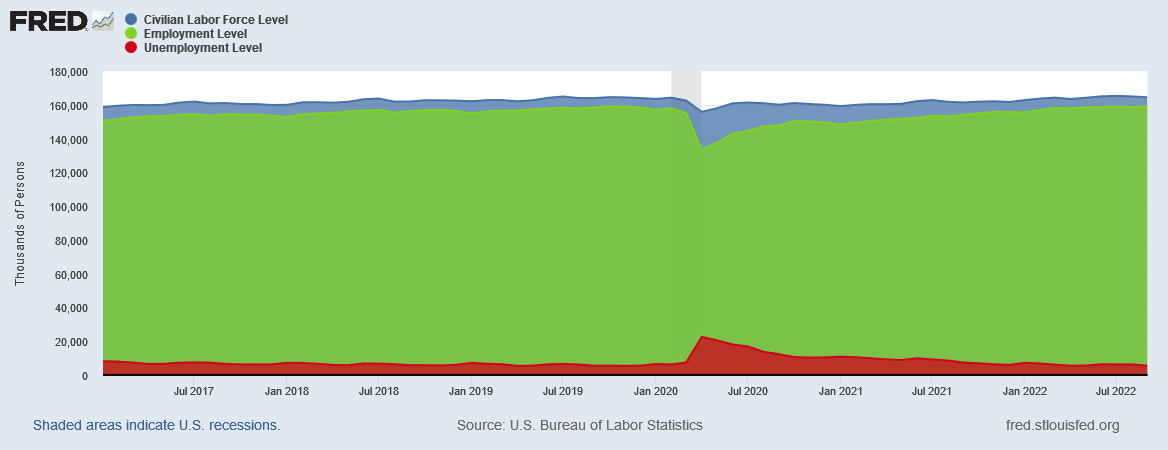
For starters, while employment has risen and unemployment has fallen, the overall civilian labor force has fallen as well—and has been doing so for a few months.

Thus, while employment apparently rose in September, the labor force has been shrinking since the summer. This is the raw data2, and some of that decline is undoubtedly attributable to seasonal fluctuations such as people returning to school after the summer--although a seasonal variance like that does not explain a decline that began during the summer.
Additionally, the second data set within the Employment Situation Summary, the establishment survey3, indicates that overall employment actually declined in September, from 131,156,000 to 130,708,000.

Interestingly enough, this decline is also seen in the raw data for the ADP Employment Report as well.

While seasonal variance does account for most if not all of this decline—which is to say that macroeconomic forces are not necessarily involved in the decline—the reality of the raw data is that businesses reported fewer workers in September than in August, both according to the BLS and the ADP Employment Report.
Which survey is “correct”? An excellent question. What both surveys indicate, however, is that the jobs market is, overall, cooler in September than it was in August. This is not a dramatic collapse in employment, but representation of the data showing a robust jobs market are probably a bit wide of the mark.
The “Not In Labor Force” Demographic Continues To Grow
What the household survey continues to show is growth in the “Not In Labor Force” demographic—which is must by simple math, as a stable overall population less a shrinking labor force means a greater number of individuals are not in the labor force.

Whether due to seasonal influences, Federal Reserve interest rate hikes, or other macroeconomic forces, for a significant part of 2022 to date an increasing number of workers are apparently “opting out” of working. Such shifts are again more indicative of a cooling labor market rather than a hot one.
While some workers are moving to the sidelines, others are choosing to work multiple jobs. The household survey showed 289,000 jobs created in the US, and 254,000 of them went to people holding down more than one job.

What the household survey is showing, therefore, is not so much an expanding labor market as a growing portion of workers who are working harder by holding down second jobs, a trend that has been ongoing even accounting for seasonal influences since the end of the lockdown-induced 2020 recession.
Increasing numbers of people feeling the need to work multiple jobs is not an indication of a robust economy, but of a labor force facing increasing difficulty making ends meet.
One reason why workers may be feeling the pinch might be due to the decline in full-time work that is also being shown by the household survey. Since before the summer, the household survey shows decreasing full time work and increasing part time work.

Trading full-time work for part-time is a sign of a soft labor market and a weakening economy.
The reality of such transitions may also be why more workers during this period have opted to exit the labor force altogether.
Workers Want To Work
If one looks strictly at the seasonally adjusted data—which is what is presented in the text of the Employment Situation Summary—the narrative suggests that those not in the labor force but who want a job hasn’t changed much.
The number of persons not in the labor force who currently want a job was little changed at 5.8 million in September and remains above its February 2020 level of 5.0 million. These individuals were not counted as unemployed because they were not actively looking for work during the 4 weeks preceding the survey or were unavailable to take a job.
While the text says “little changed”, the data says those not in the labor force who want a job now has risen—by about 207,000, for those who have sought employment within the past year.
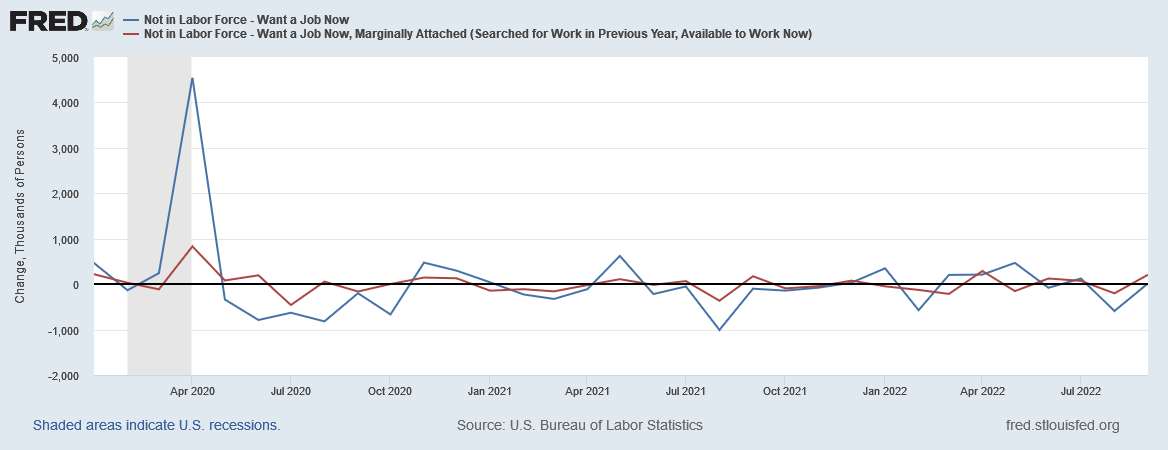
Is that “little change”? The reader is left to form their own opinion on that point.
Not Lou Costello Labor Math…But Not A Report Of A Strong Jobs Market Either
While the numbers in the September report do not appear especially egregious or misstated, they are not illustrative of the red-hot labor market the corporate media insists exists in the United States:
The Federal Reserve looks almost certain to deliver a fourth straight 75-basis point interest rate hike next month after a closely watched report Friday showed its aggressive rate hikes so far this year have done little to cool the U.S. labor market.
It is perverse irony that the portion of the corporate media that often presents as the most analytical is distinctly incurious about digging past the headline numbers on employment. The financial media ignored the detail beneath the headlines on the Employment Situation Summary just as they ignored the detail beneath the headlines on the August JOLTS Summary.
The US jobs market is not “red hot” nor is it “strong”. It is as it has been for at least the bulk of 2022: toxic and in many regards highly dysfunctional.
That the government bureaucrats might wish to put a positive spin on the data is unfortunate, but, human nature being what it is, it is at least understandable. Far less understandable is the unwillingness of the corporate media to truly delve into the data and call out the reality of the data. Dangerously incomprehensible is the seeming inability of the Federal Reserve to do the same when relying on this same data to justify further rate hikes to quell inflation.
The September Employment Situation Summary is not Lou Costello Labor Math—which is a refreshing change. However, neither does it say what the government and the media want people to think it says. Even without vaudevillian hijinks, the propaganda still tends to land some distance from the reality and the truth.
For the newer readers of this Substack, a sample of Abbott and Costello’s vaudevillian math routine which more than once best typifies the bizarre number games the BLS plays with the employment statistics.
Looking at the raw data does not mean the seasonal fluctuations do not exist or are not relevant. It means I am somewhat distrustful of how the BLS calculates seasonal variances.
The Employment Situation Summary blends two independent surveys together—the household survey, which polls actual workers for their view of employment trends, and the establishment survey, which looks at employment from the business perspective.